| Param | Original file | Final file |
|---|---|---|
| Filename | modeM0/AS1A04_104T03_9000002348_15940cztM0_level2.evt | modeM0/AS1A04_104T03_9000002348_15940cztM0_level2_quad_clean.evt |
| Size (bytes) | 508,674,240 | 94,740,480 |
| Size | 485.1 MB | 90.4 MB |
| Events in quadrant A | 3,947,739 | 589,529 |
| Events in quadrant B | 3,990,785 | 605,553 |
| Events in quadrant C | 3,601,341 | 581,848 |
| Events in quadrant D | 3,360,971 | 575,243 |
| Mode SS | |||
|---|---|---|---|
| Quadrant | BADHDUFLAG | Total packets | Discarded packets |
| A | 0 | 150 | 0 |
| B | 0 | 150 | 0 |
| C | 0 | 150 | 0 |
| D | 0 | 150 | 0 |
| Mode M9 | |||
|---|---|---|---|
| Quadrant | BADHDUFLAG | Total packets | Discarded packets |
| A | 0 | 6 | 0 |
| B | 0 | 6 | 0 |
| C | 0 | 6 | 0 |
| D | 0 | 7 | 0 |
| Mode M0 | |||
|---|---|---|---|
| Quadrant | BADHDUFLAG | Total packets | Discarded packets |
| A | 0 | 16581 | 2 |
| B | 0 | 16540 | 1 |
| C | 0 | 15416 | 1 |
| D | 0 | 15350 | 1 |
| Quadrant | Total seconds | Saturated seconds | Saturation percentage |
|---|---|---|---|
| A | 7434 | 205 | 2.757600% |
| B | 7434 | 156 | 2.098467% |
| C | 7434 | 106 | 1.425881% |
| D | 7434 | 54 | 0.726392% |
Noise dominated data is calculated using 1-second bins in cleaned event files. If a bin has >2000 counts, and if more than 50% of those come from <1% of pixels, then it is considered to be noise-dominated and hence unusable.
| Quadrant | # 1 sec bins | Bins with >0 counts | Bins with >2000 counts | High rate bins dominated by noise | Noise dominated (total time) | Noise dominated (detector-on time) | Marked lightcurve |
|---|---|---|---|---|---|---|---|
| A | 7720 | 7437 | 81 | 81 | 1.05% | 1.09% | 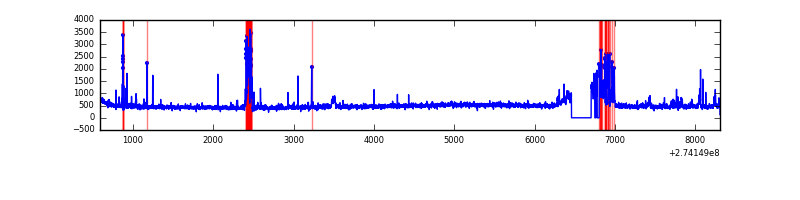 |
| B | 7720 | 7437 | 32 | 32 | 0.41% | 0.43% | 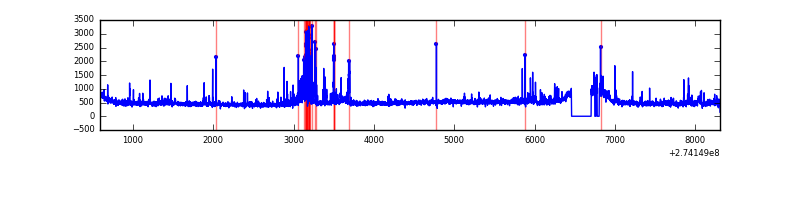 |
| C | 7720 | 7438 | 0 | 0 | 0.00% | 0.00% | 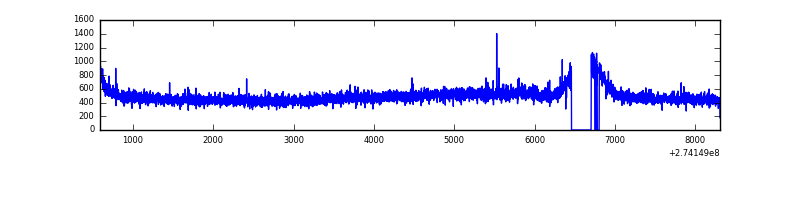 |
| D | 7720 | 7438 | 3 | 3 | 0.04% | 0.04% | 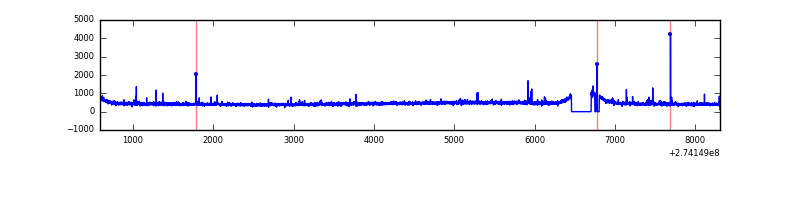 |
Top three noisy pixels from each quadrant. If the there are fewer than three noisy pixels in the level2.evt file, extra rows are filled as -1
| Pixel properties | Quadrant properties | ||||||
|---|---|---|---|---|---|---|---|
| Quadrant | DetID | PixID | Counts | Sigma | Mean | Median | Sigma |
| A | 15 | 239 | 470215 | 2583.04 | 886 | 868 | 181.7 |
| A | 13 | 34 | 37639 | 202.37 | 886 | 868 | 181.7 |
| A | 13 | 210 | 17351 | 90.71 | 886 | 868 | 181.7 |
| B | 10 | 245 | 304821 | 1759.74 | 897 | 873 | 172.7 |
| B | 4 | 173 | 39929 | 226.12 | 897 | 873 | 172.7 |
| B | 3 | 209 | 26767 | 149.91 | 897 | 873 | 172.7 |
| C | 14 | 238 | 129727 | 636.76 | 856 | 863 | 202.4 |
| C | 3 | 233 | 122741 | 602.24 | 856 | 863 | 202.4 |
| C | 13 | 61 | 6158 | 26.16 | 856 | 863 | 202.4 |
| D | 2 | 234 | 35117 | 159.51 | 869 | 841 | 214.9 |
| D | 10 | 70 | 26665 | 120.18 | 869 | 841 | 214.9 |
| D | 13 | 172 | 13280 | 57.89 | 869 | 841 | 214.9 |
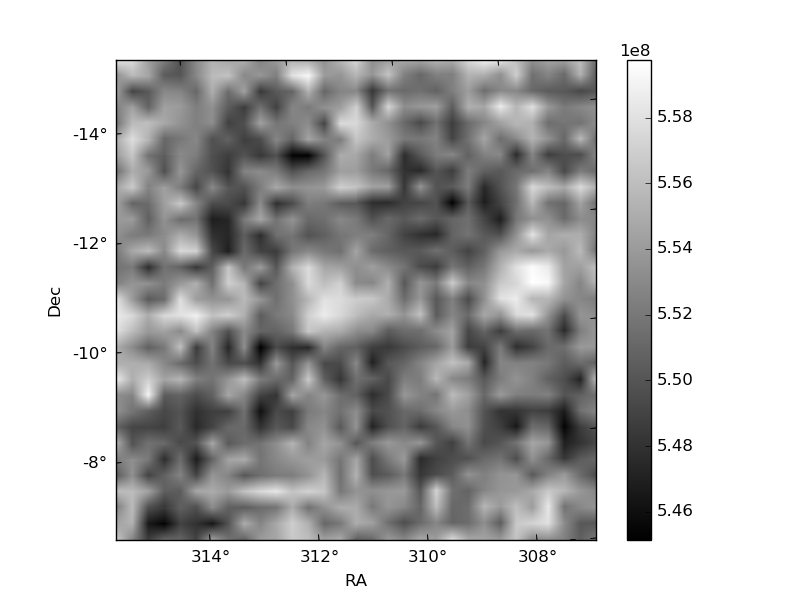
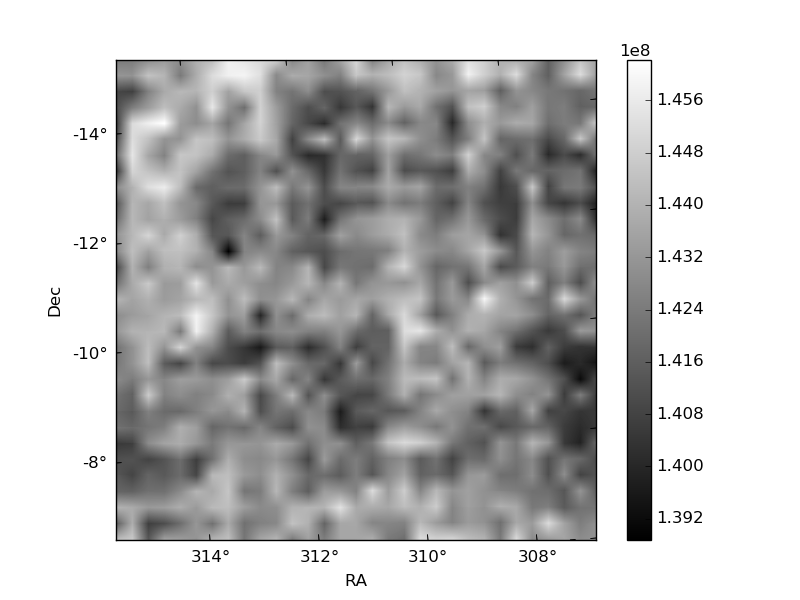
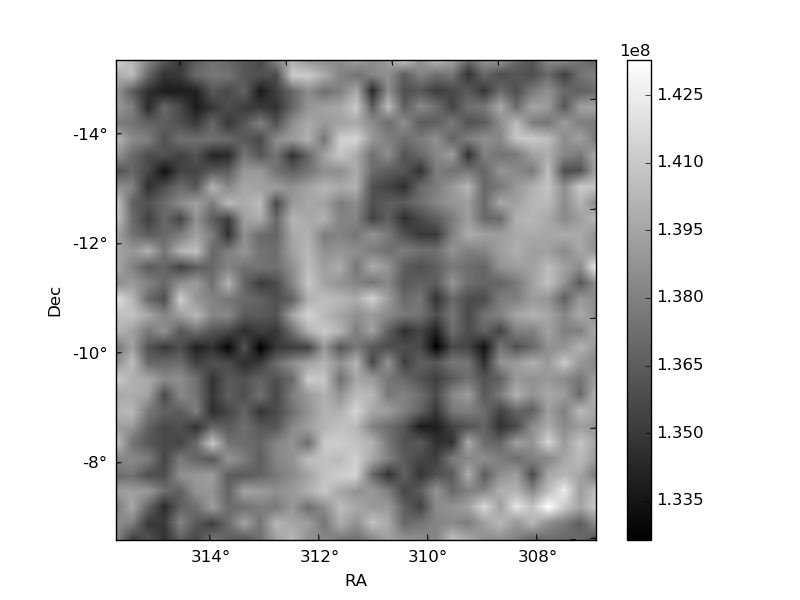
Histogram calculated using DETX and DETY for each event in the final _common_clean file
| Quadrant A | 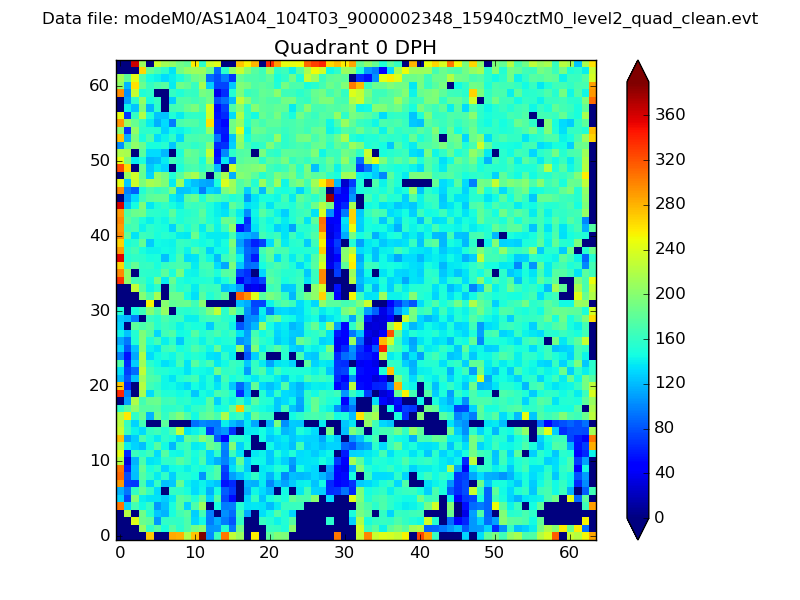 |
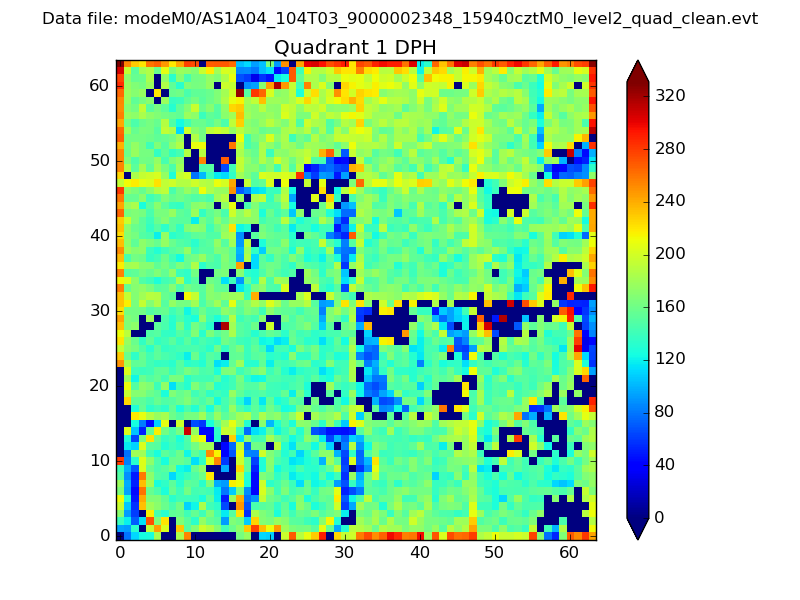 |
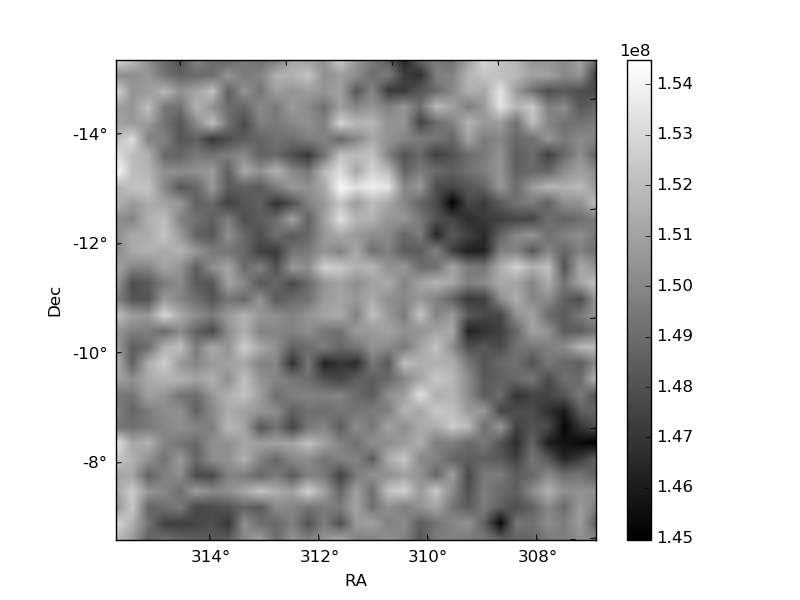
Quadrant B |
|---|---|---|---|
| Quadrant D | 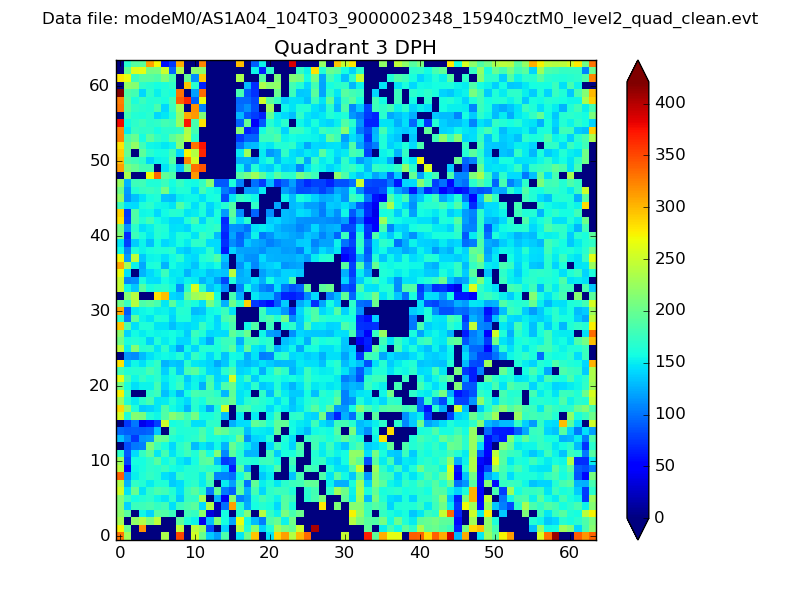 |
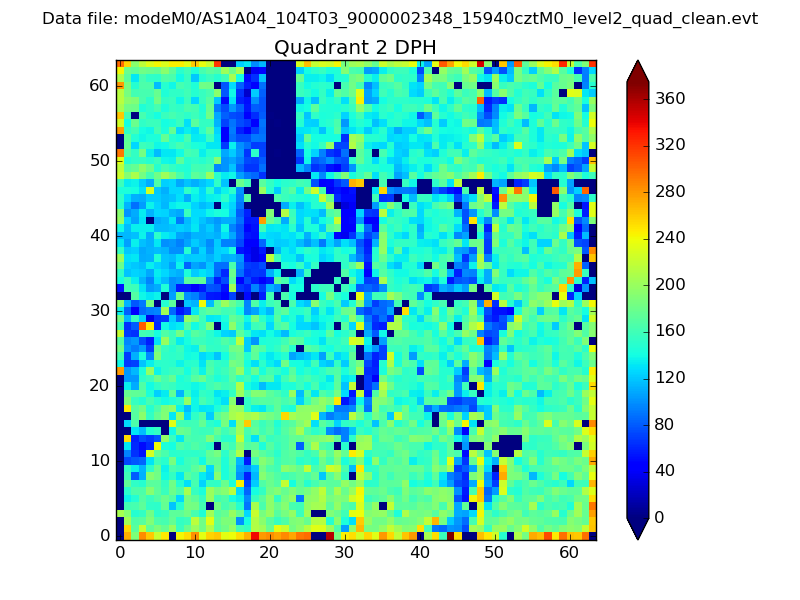 |
Quadrant C |
| Plot type | Count rate plots | Images |
|---|---|---|
| Comparison with Poisson distribution Blue bars denote a histogram of data divided into 1 sec bins. Red curve is a Poisson curve with rate = median count rate of data. |
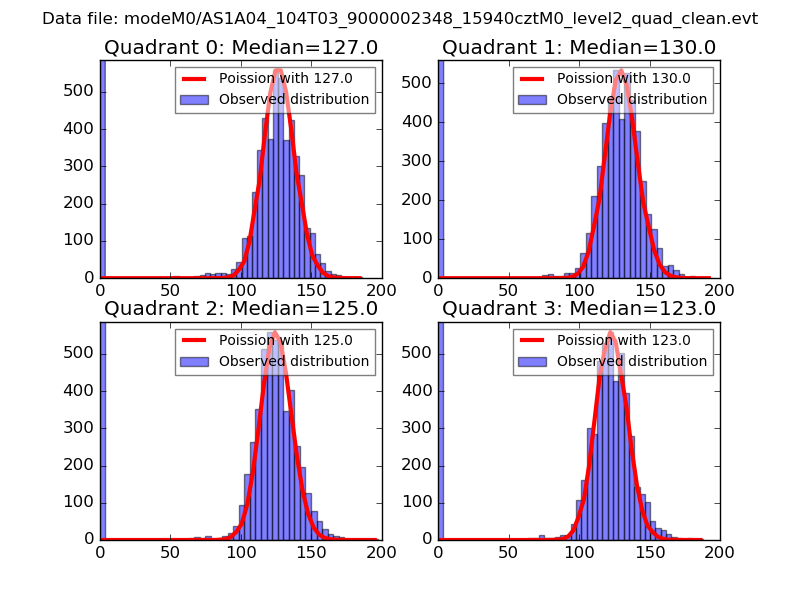 |
 |
| Quadrant-wise count rates Data is divided into 100 sec bins |
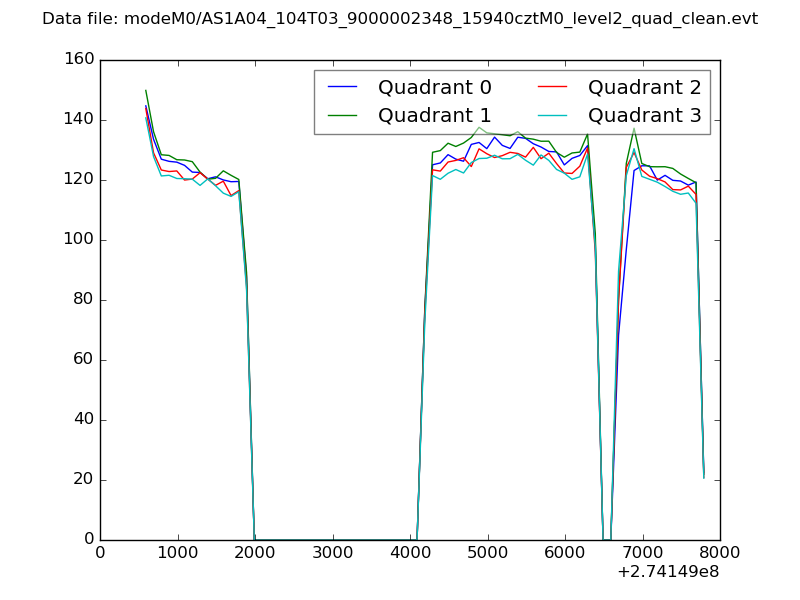 |
|
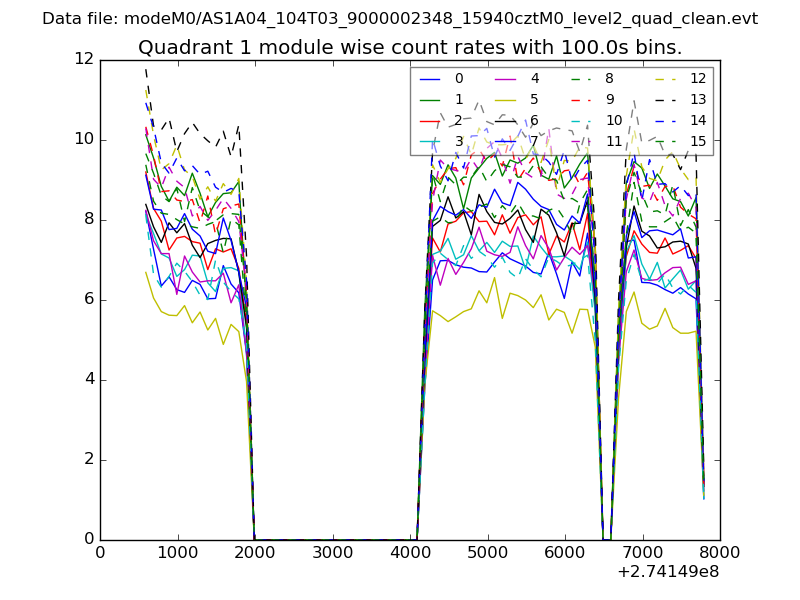
| Module-wise count rates for Quadrant A Data is divided into 100 sec bins |
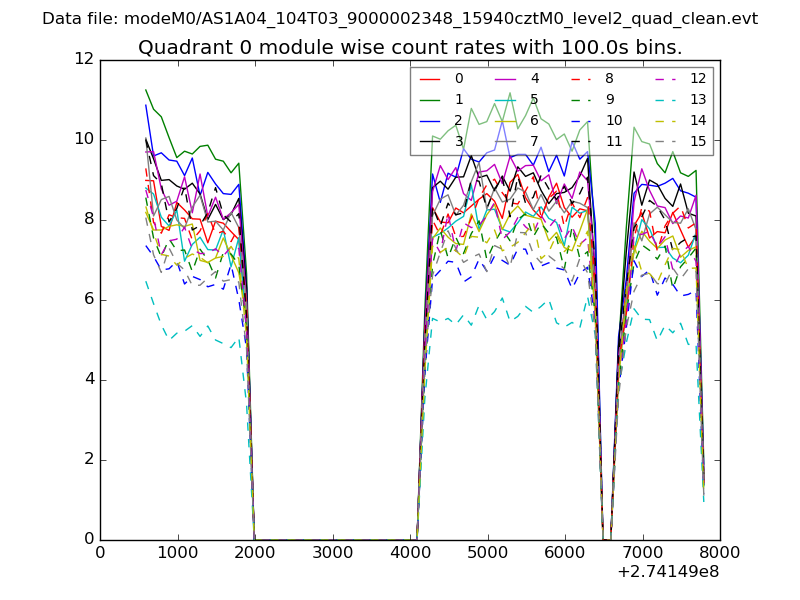 |
 |
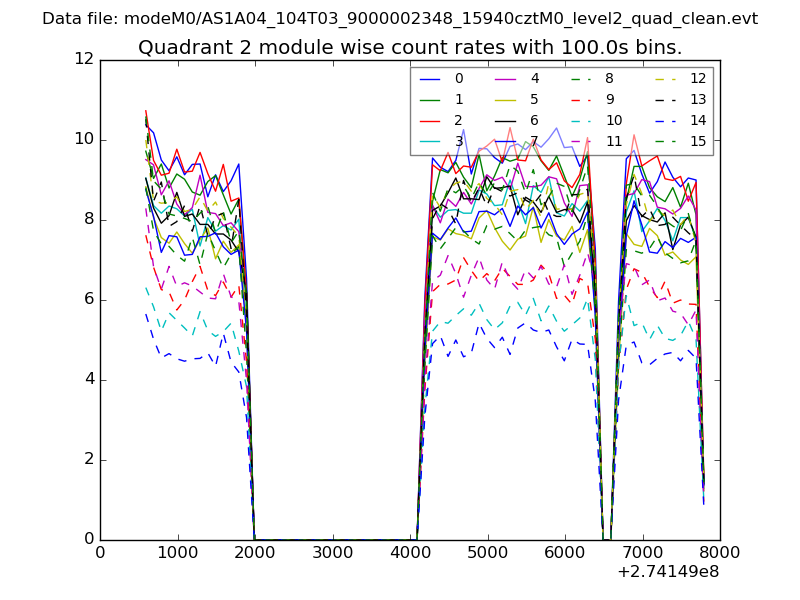
| Module-wise count rates for Quadrant B Data is divided into 100 sec bins |
 |
 |
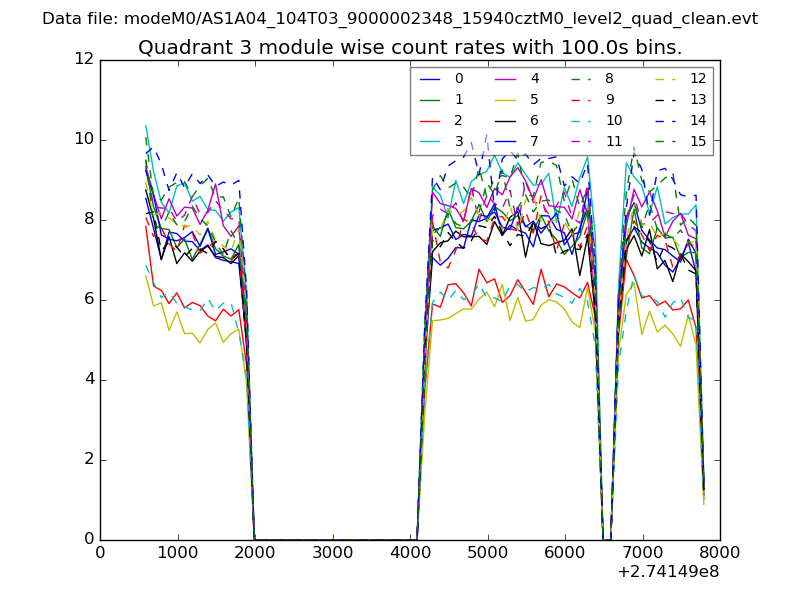
| Module-wise count rates for Quadrant C Data is divided into 100 sec bins |
 |
 |
| Module-wise count rates for Quadrant D Data is divided into 100 sec bins |
 |
 |
| Parameter | Plot |
|---|---|
| CZT HV Monitor | 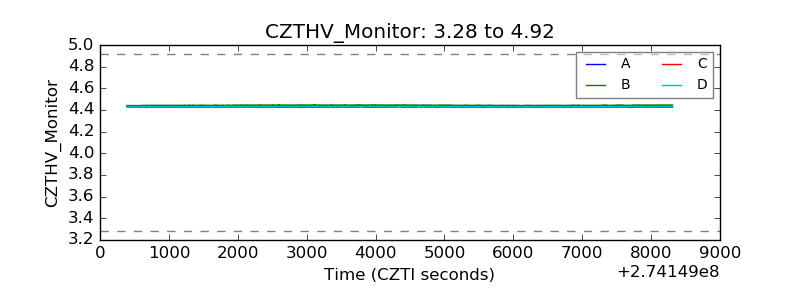 |
| D_VDD | 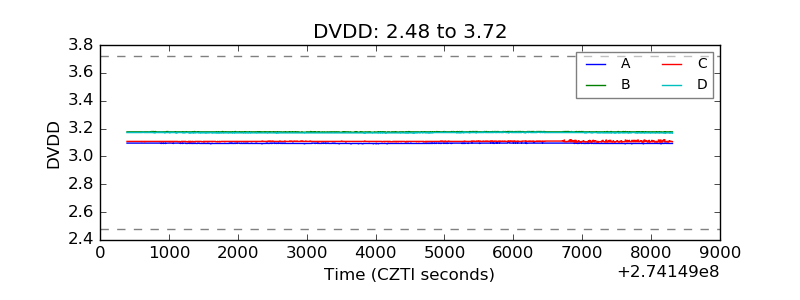 |
| Temperature 1 |  |
| Veto HV Monitor | 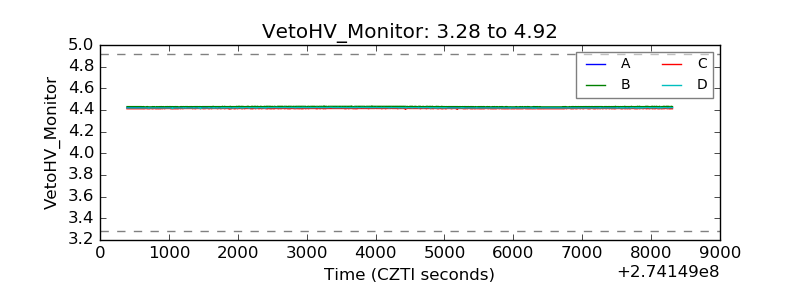 |
| Veto LLD | 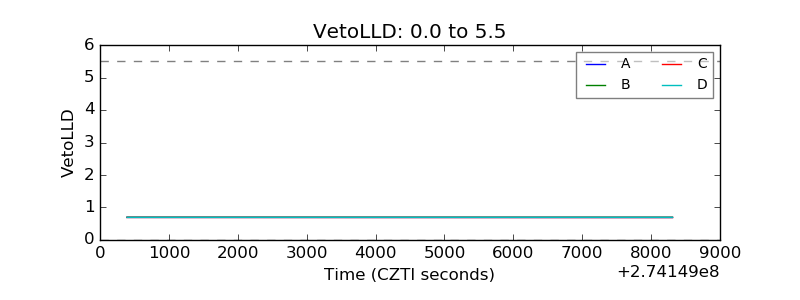 |
| Alpha Counter | 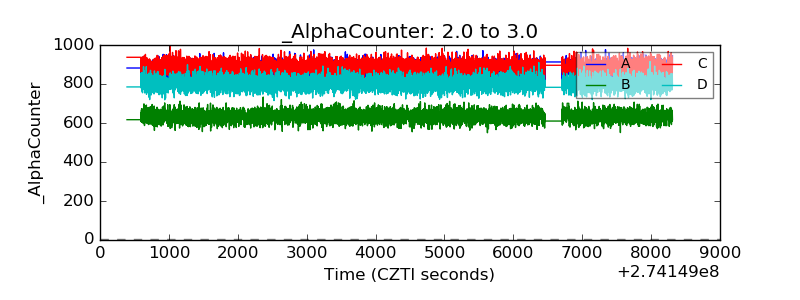 |
| _CPM_Rate | 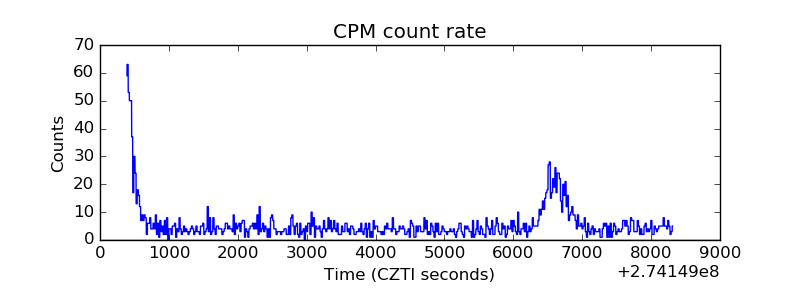 |
| CZT Counter | 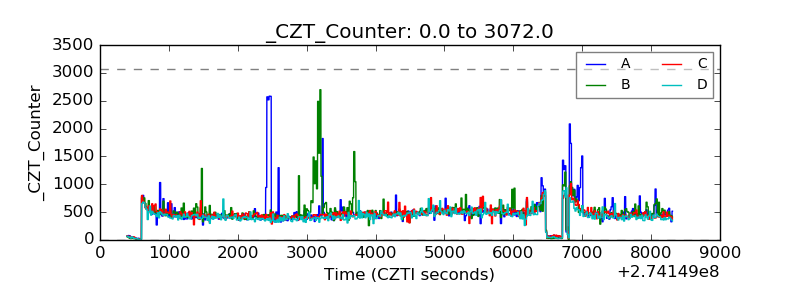 |
| +2.5 Volts monitor |  |
| +5 Volts monitor |  |
| _ROLL_ROT |  |
| _Roll_DEC |  |
| _Roll_RA | 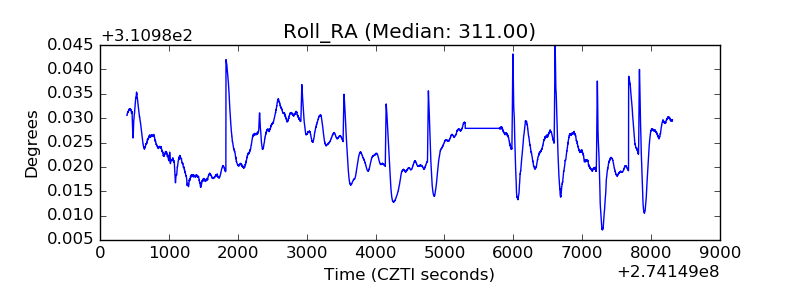 |
| Veto Counter | 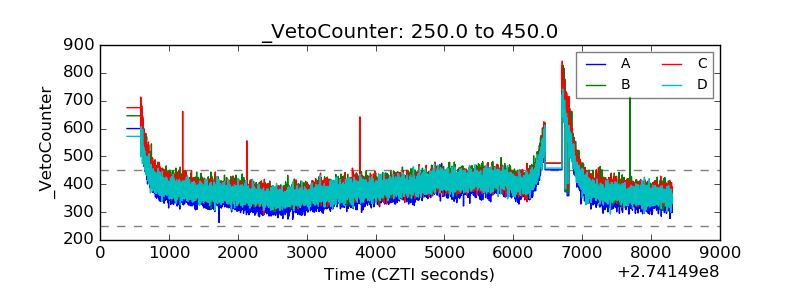 |