| Param | Original file | Final file |
|---|---|---|
| Filename | modeM0/AS1A04_104T03_9000002348_15942cztM0_level2.evt | modeM0/AS1A04_104T03_9000002348_15942cztM0_level2_quad_clean.evt |
| Size (bytes) | 503,049,600 | 79,810,560 |
| Size | 479.7 MB | 76.1 MB |
| Events in quadrant A | 3,580,500 | 475,916 |
| Events in quadrant B | 4,039,416 | 482,770 |
| Events in quadrant C | 3,690,695 | 467,173 |
| Events in quadrant D | 3,408,086 | 462,113 |
| Mode SS | |||
|---|---|---|---|
| Quadrant | BADHDUFLAG | Total packets | Discarded packets |
| A | 0 | 154 | 0 |
| B | 0 | 154 | 0 |
| C | 0 | 154 | 0 |
| D | 0 | 154 | 0 |
| Mode M9 | |||
|---|---|---|---|
| Quadrant | BADHDUFLAG | Total packets | Discarded packets |
| A | 0 | 4 | 0 |
| B | 0 | 4 | 0 |
| C | 0 | 4 | 0 |
| D | 0 | 4 | 0 |
| Mode M0 | |||
|---|---|---|---|
| Quadrant | BADHDUFLAG | Total packets | Discarded packets |
| A | 0 | 15792 | 3 |
| B | 0 | 16924 | 2 |
| C | 0 | 15817 | 2 |
| D | 0 | 15706 | 2 |
| Quadrant | Total seconds | Saturated seconds | Saturation percentage |
|---|---|---|---|
| A | 7598 | 82 | 1.079231% |
| B | 7598 | 129 | 1.697815% |
| C | 7598 | 123 | 1.618847% |
| D | 7599 | 51 | 0.671141% |
Noise dominated data is calculated using 1-second bins in cleaned event files. If a bin has >2000 counts, and if more than 50% of those come from <1% of pixels, then it is considered to be noise-dominated and hence unusable.
| Quadrant | # 1 sec bins | Bins with >0 counts | Bins with >2000 counts | High rate bins dominated by noise | Noise dominated (total time) | Noise dominated (detector-on time) | Marked lightcurve |
|---|---|---|---|---|---|---|---|
| A | 7959 | 7599 | 4 | 4 | 0.05% | 0.05% | 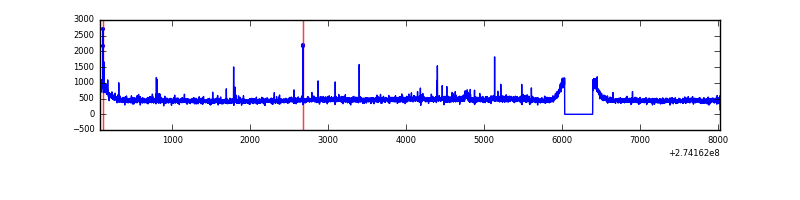 |
| B | 7959 | 7600 | 15 | 15 | 0.19% | 0.20% | 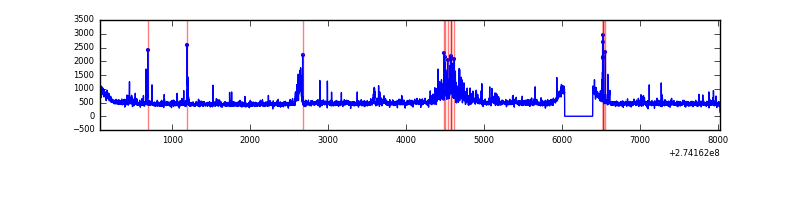 |
| C | 7959 | 7600 | 2 | 2 | 0.03% | 0.03% | 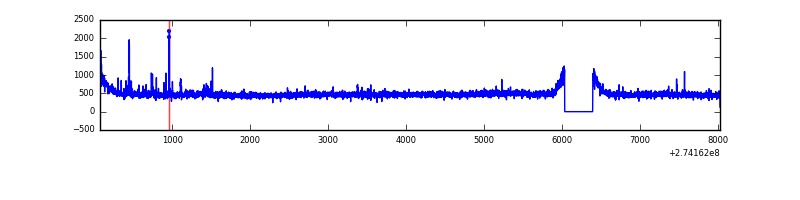 |
| D | 7960 | 7601 | 3 | 3 | 0.04% | 0.04% | 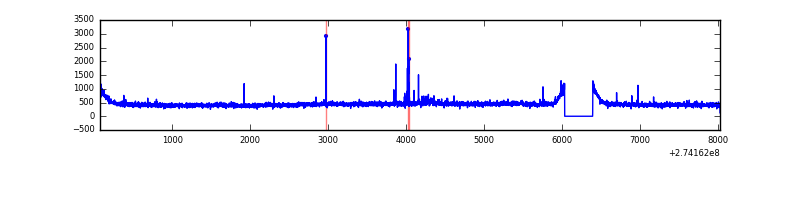 |
Top three noisy pixels from each quadrant. If the there are fewer than three noisy pixels in the level2.evt file, extra rows are filled as -1
| Pixel properties | Quadrant properties | ||||||
|---|---|---|---|---|---|---|---|
| Quadrant | DetID | PixID | Counts | Sigma | Mean | Median | Sigma |
| A | 15 | 239 | 48808 | 254.95 | 912 | 891 | 187.9 |
| A | 13 | 210 | 20640 | 105.08 | 912 | 891 | 187.9 |
| A | 0 | 226 | 8118 | 38.45 | 912 | 891 | 187.9 |
| B | 4 | 142 | 149551 | 831.82 | 916 | 893 | 178.7 |
| B | 4 | 173 | 114471 | 635.53 | 916 | 893 | 178.7 |
| B | 0 | 189 | 93840 | 520.09 | 916 | 893 | 178.7 |
| C | 3 | 233 | 138542 | 659.3 | 874 | 880 | 208.8 |
| C | 14 | 238 | 131372 | 624.96 | 874 | 880 | 208.8 |
| C | 7 | 247 | 13415 | 60.03 | 874 | 880 | 208.8 |
| D | 2 | 234 | 34116 | 152.96 | 885 | 859 | 217.4 |
| D | 10 | 70 | 17330 | 75.75 | 885 | 859 | 217.4 |
| D | 12 | 110 | 14838 | 64.29 | 885 | 859 | 217.4 |
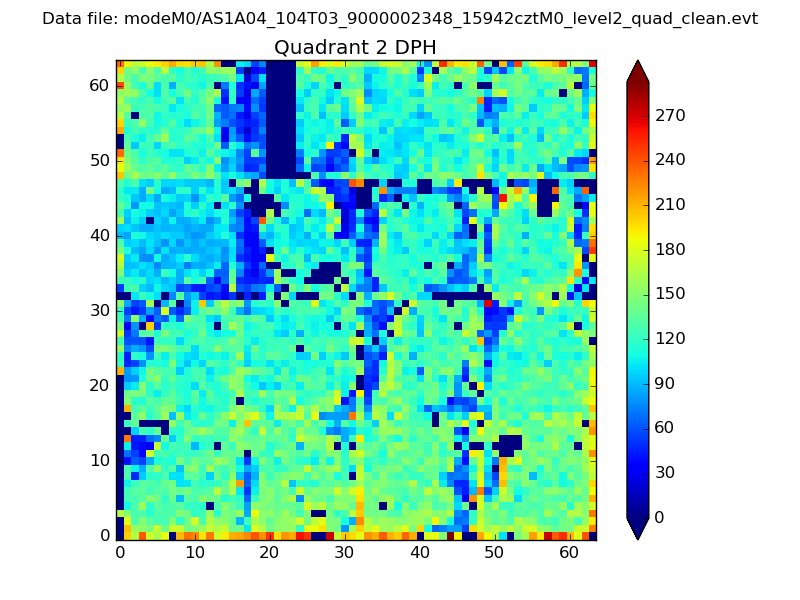
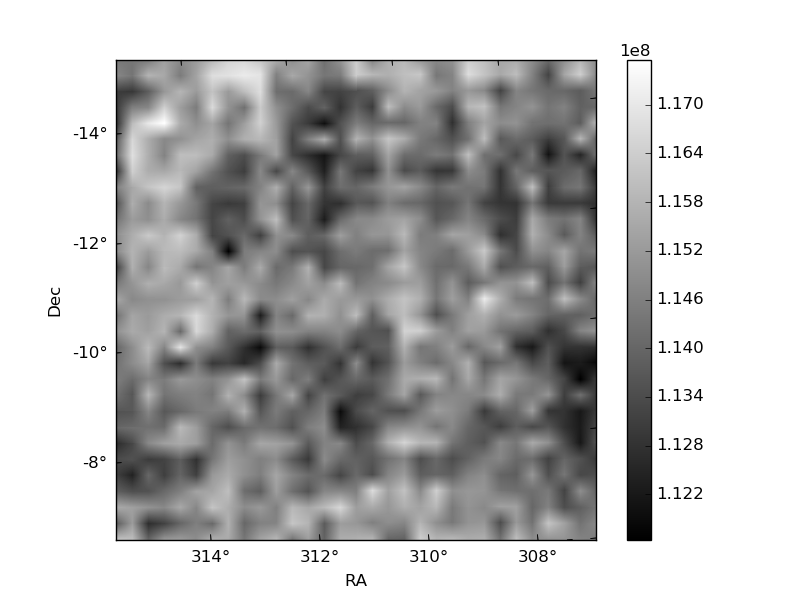
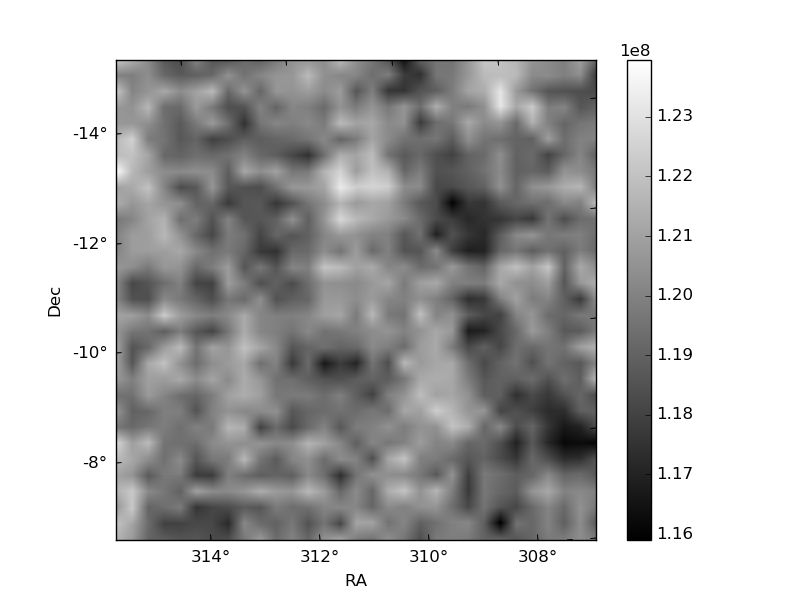
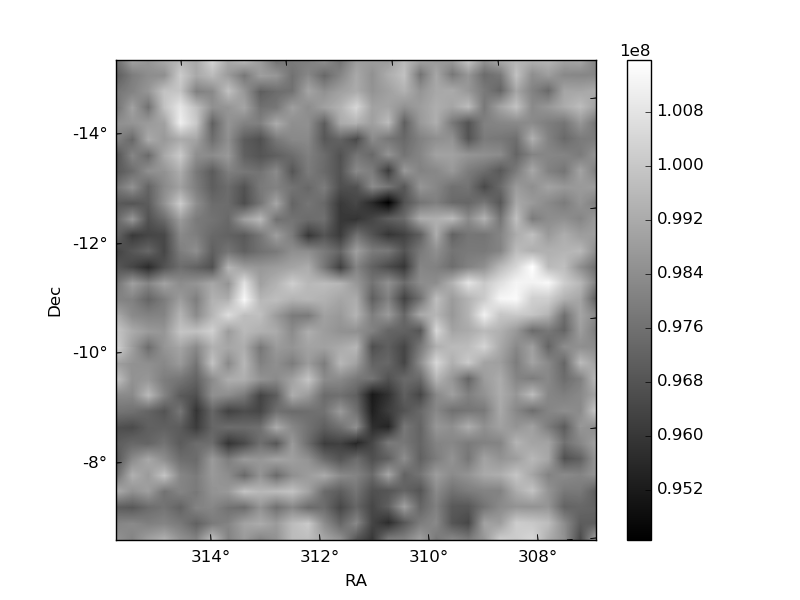
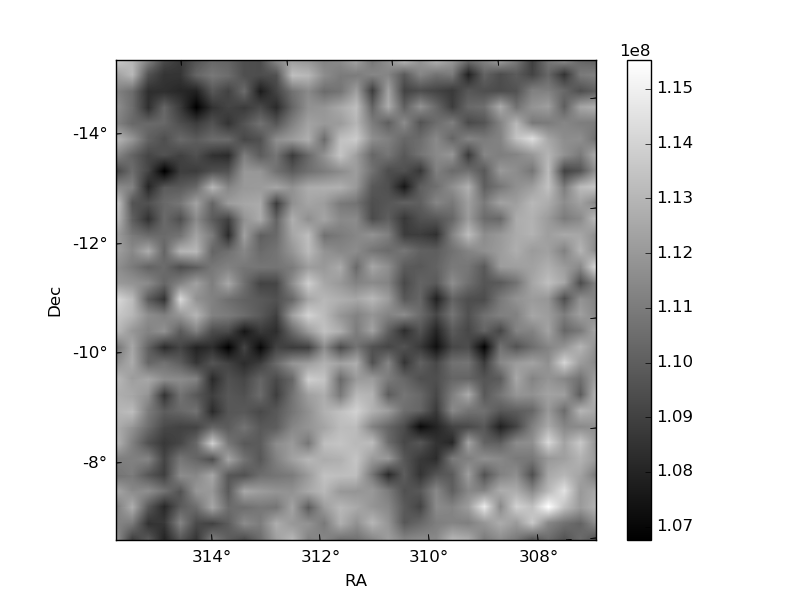
Histogram calculated using DETX and DETY for each event in the final _common_clean file
| Quadrant A | 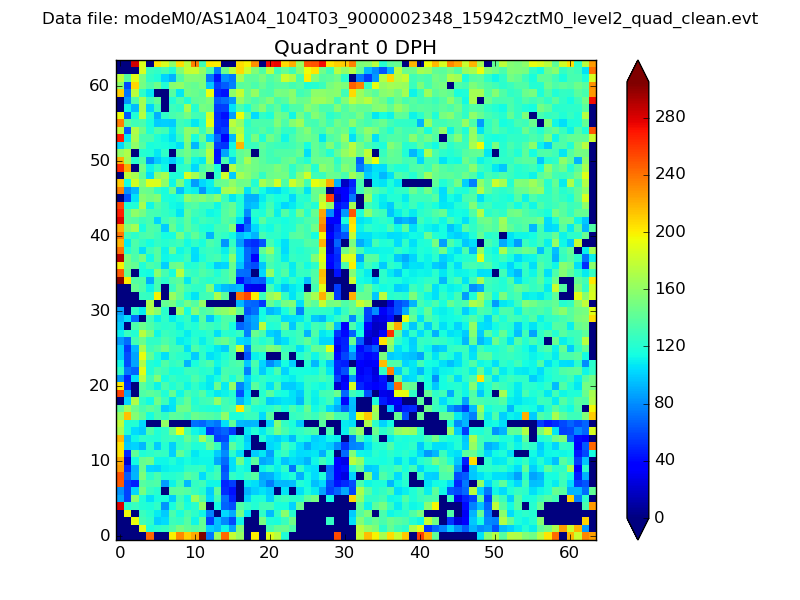 |
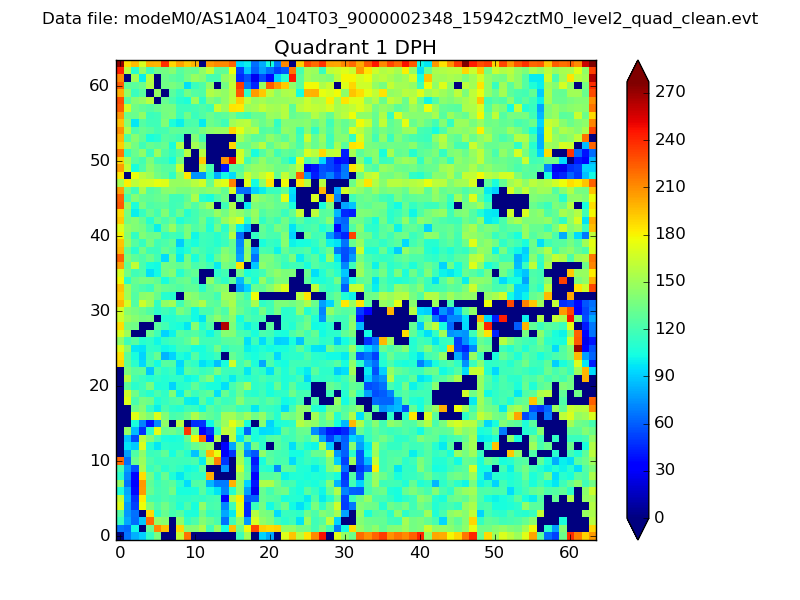 |
Quadrant B |
|---|---|---|---|
| Quadrant D | 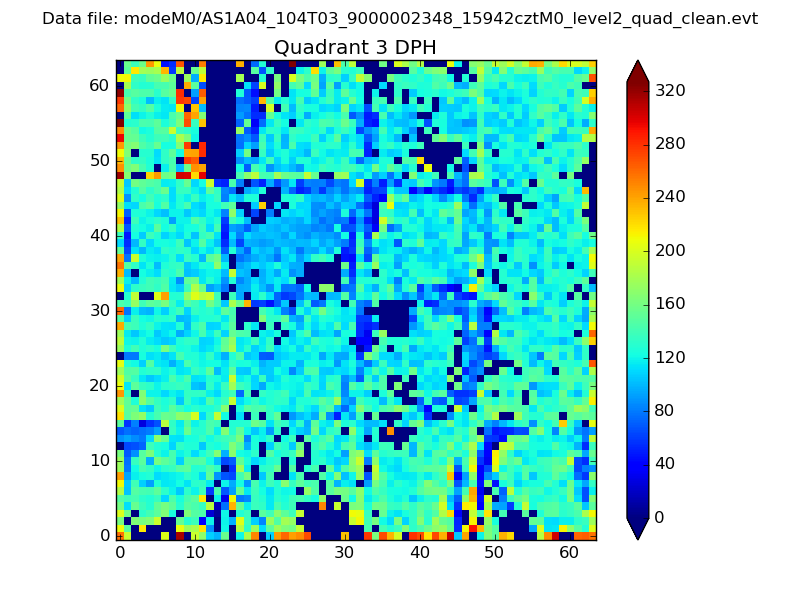 |
 |
Quadrant C |
| Plot type | Count rate plots | Images |
|---|---|---|
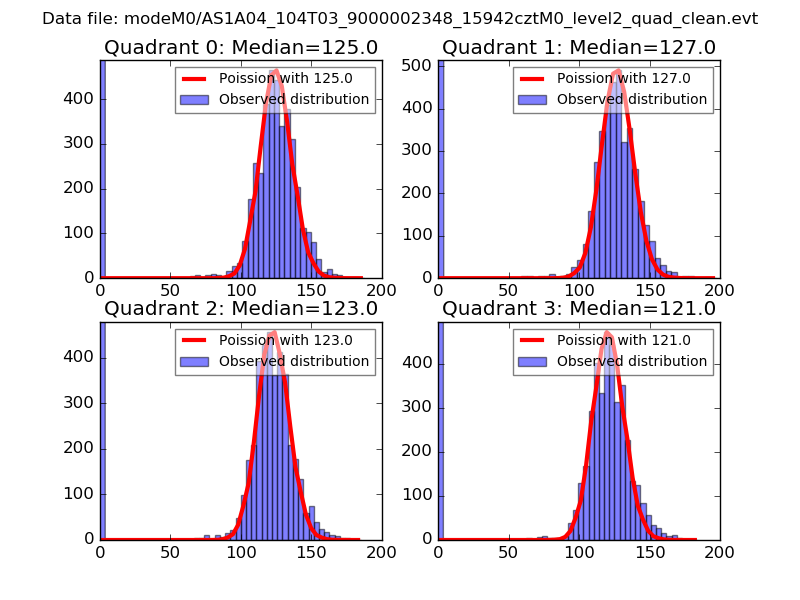
| Comparison with Poisson distribution Blue bars denote a histogram of data divided into 1 sec bins. Red curve is a Poisson curve with rate = median count rate of data. |
 |
 |
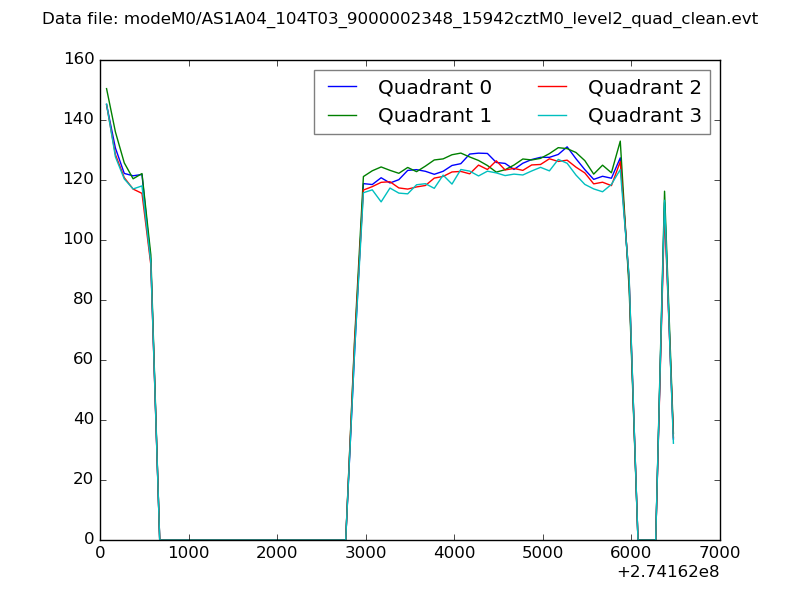
| Quadrant-wise count rates Data is divided into 100 sec bins |
 |
|
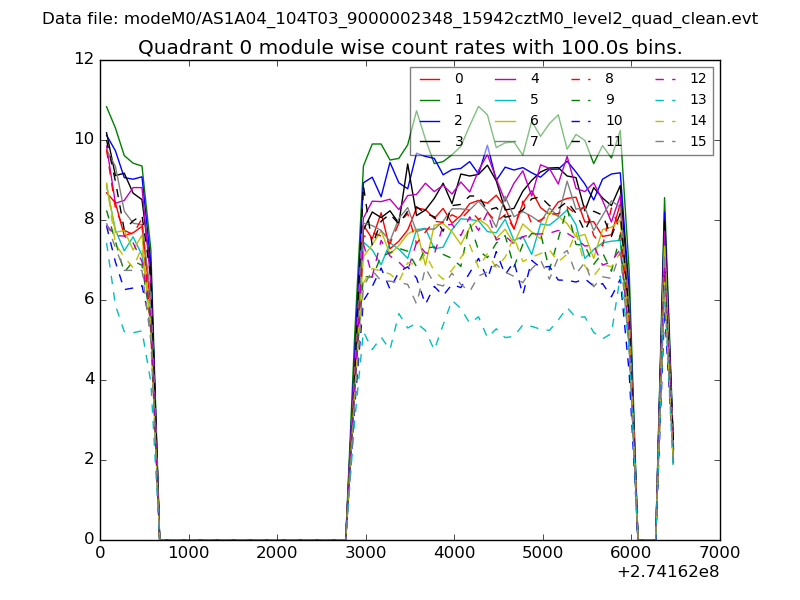
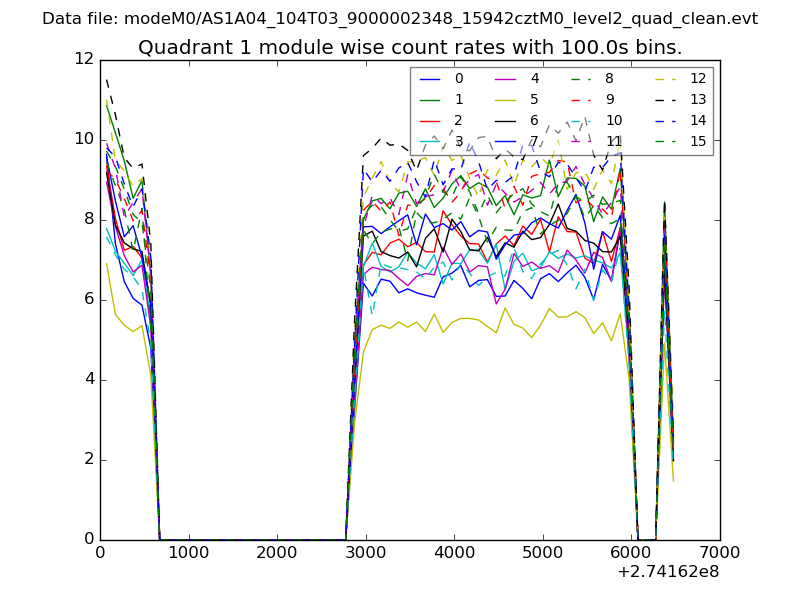
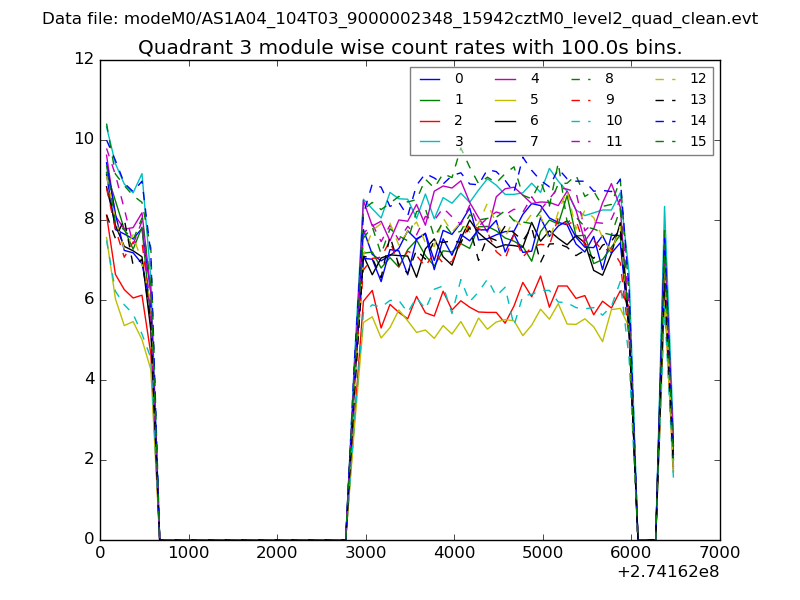
| Module-wise count rates for Quadrant A Data is divided into 100 sec bins |
 |
 |
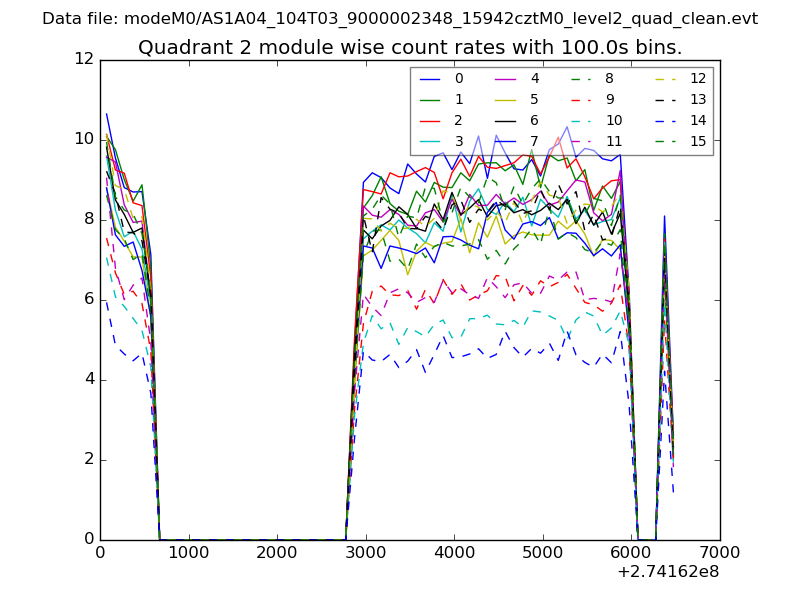
| Module-wise count rates for Quadrant B Data is divided into 100 sec bins |
 |
 |
| Module-wise count rates for Quadrant C Data is divided into 100 sec bins |
 |
 |
| Module-wise count rates for Quadrant D Data is divided into 100 sec bins |
 |
 |
| Parameter | Plot |
|---|---|
| CZT HV Monitor | 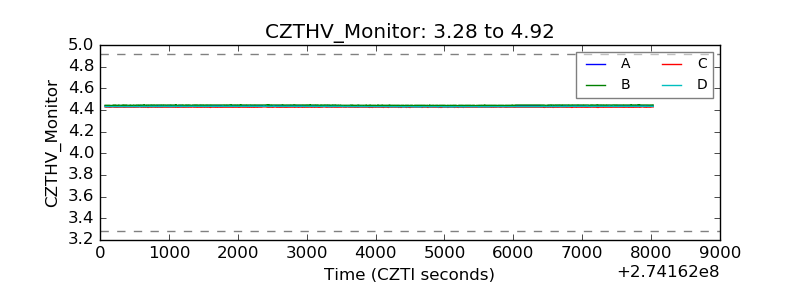 |
| D_VDD |  |
| Temperature 1 | 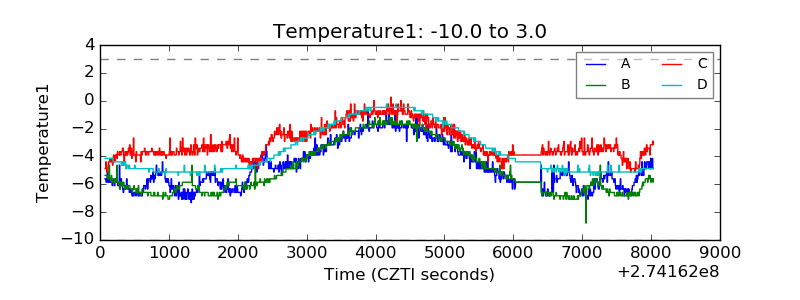 |
| Veto HV Monitor | 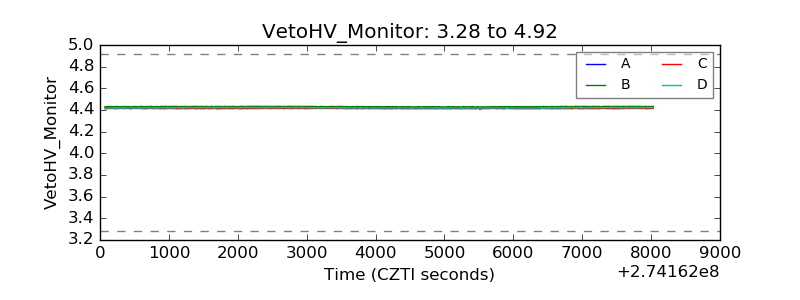 |
| Veto LLD |  |
| Alpha Counter | 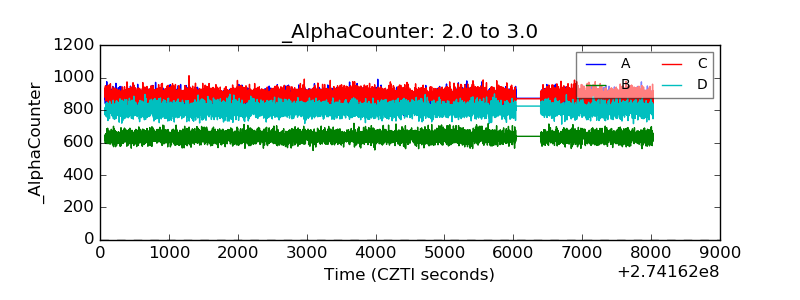 |
| _CPM_Rate | 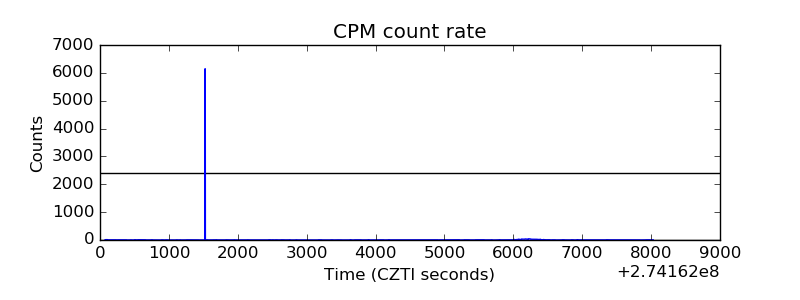 |
| CZT Counter | 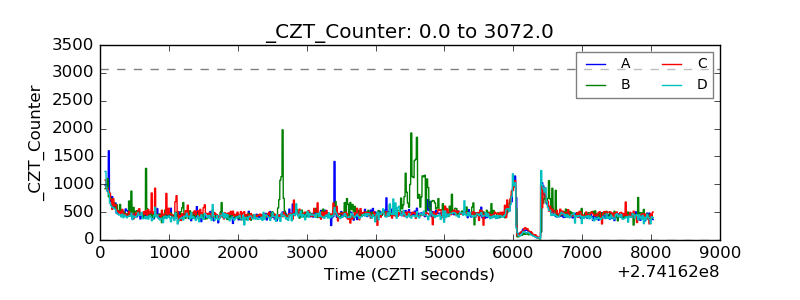 |
| +2.5 Volts monitor | 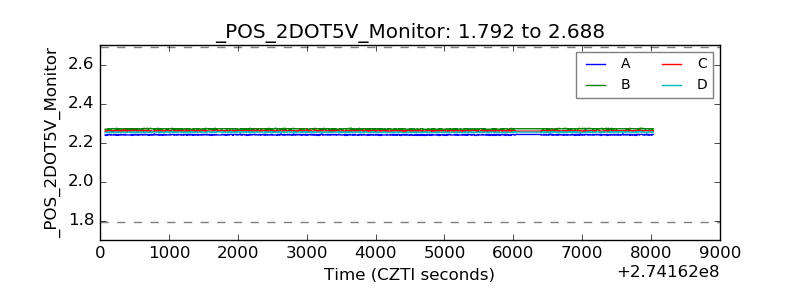 |
| +5 Volts monitor |  |
| _ROLL_ROT | 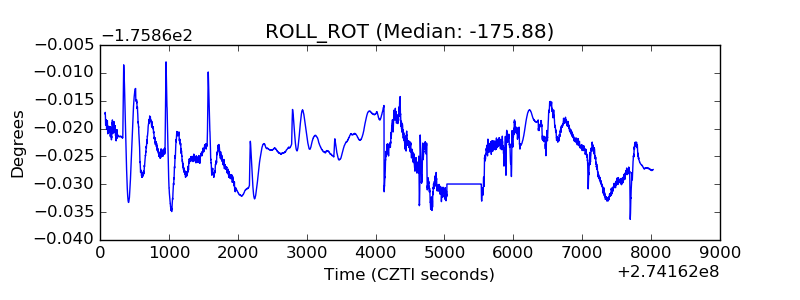 |
| _Roll_DEC | 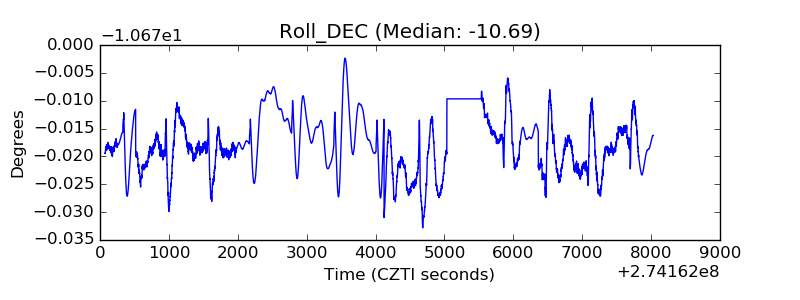 |
| _Roll_RA | 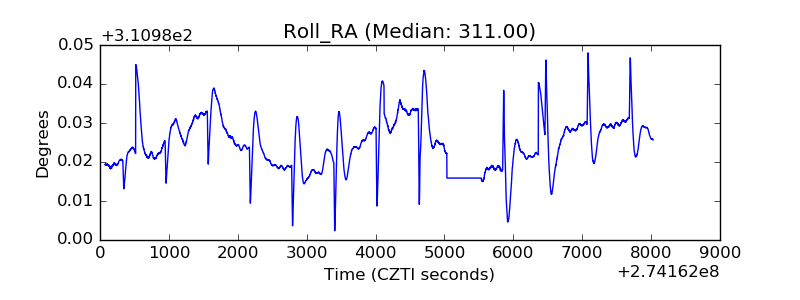 |
| Veto Counter | 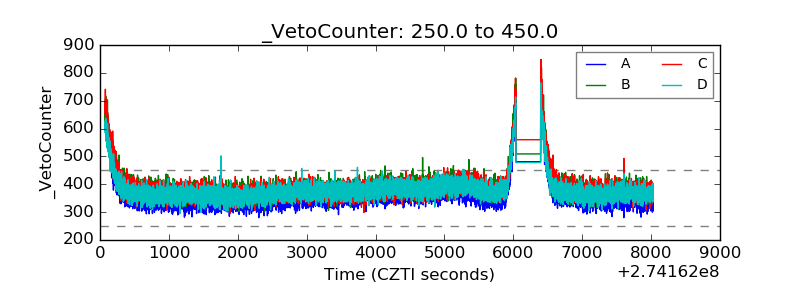 |