| Param | Original file | Final file |
|---|---|---|
| Filename | modeM0/AS1G08_066T02_9000002346cztM0_level2.fits | modeM0/AS1G08_066T02_9000002346cztM0_level2_quad_clean.evt |
| Size (bytes) | 286,401,600 | 259,571,520 |
| Size | 273.1 MB | 247.5 MB |
| Events in quadrant A | 1,710,754 | 1,485,123 |
| Events in quadrant B | 1,664,324 | 1,519,679 |
| Events in quadrant C | 1,690,882 | 1,421,556 |
| Events in quadrant D | 1,495,338 | 1,322,109 |
| Mode SS | |||
|---|---|---|---|
| Quadrant | BADHDUFLAG | Total packets | Discarded packets |
| A | 0 | 622 | 0 |
| B | 0 | 622 | 0 |
| C | 0 | 622 | 0 |
| D | 0 | 622 | 0 |
| Mode M0 | |||
|---|---|---|---|
| Quadrant | BADHDUFLAG | Total packets | Discarded packets |
| A | 0 | 68096 | 0 |
| B | 0 | 64556 | 0 |
| C | 0 | 63631 | 0 |
| D | 0 | 63459 | 0 |
| Mode M9 | |||
|---|---|---|---|
| Quadrant | BADHDUFLAG | Total packets | Discarded packets |
| A | 0 | 16 | 0 |
| B | 0 | 16 | 0 |
| C | 0 | 16 | 0 |
| D | 0 | 16 | 0 |
| Quadrant | Total seconds | Saturated seconds | Saturation percentage |
|---|---|---|---|
| A | 30724 | 645 | 2.099336% |
| B | 30724 | 624 | 2.030986% |
| C | 30724 | 652 | 2.122120% |
| D | 30724 | 446 | 1.451634% |
Noise dominated data is calculated using 1-second bins in cleaned event files. If a bin has >2000 counts, and if more than 50% of those come from <1% of pixels, then it is considered to be noise-dominated and hence unusable.
| Quadrant | # 1 sec bins | Bins with >0 counts | Bins with >2000 counts | High rate bins dominated by noise | Noise dominated (total time) | Noise dominated (detector-on time) | Marked lightcurve |
|---|---|---|---|---|---|---|---|
| A | 32409 | 30721 | 0 | 0 | 0.00% | 0.00% |  |
| B | 32409 | 30723 | 0 | 0 | 0.00% | 0.00% |  |
| C | 32409 | 30722 | 0 | 0 | 0.00% | 0.00% |  |
| D | 32409 | 30721 | 0 | 0 | 0.00% | 0.00% | 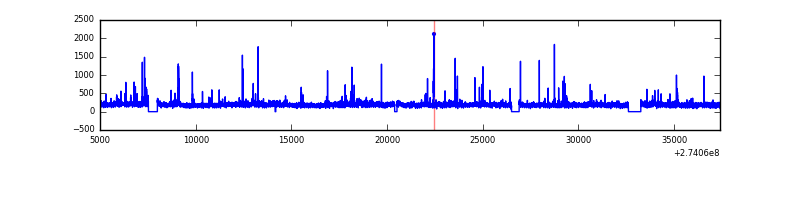 |
Top three noisy pixels from each quadrant. If the there are fewer than three noisy pixels in the level2.evt file, extra rows are filled as -1
| Pixel properties | Quadrant properties | ||||||
|---|---|---|---|---|---|---|---|
| Quadrant | DetID | PixID | Counts | Sigma | Mean | Median | Sigma |
| A | 0 | 29 | 1551 | 9.86 | 445 | 414 | 115.3 |
| A | 7 | 110 | 1355 | 8.16 | 445 | 414 | 115.3 |
| A | 15 | 236 | 1346 | 8.08 | 445 | 414 | 115.3 |
| B | 2 | 9 | 1413 | 11.02 | 440 | 418 | 90.3 |
| B | 2 | 8 | 1160 | 8.22 | 440 | 418 | 90.3 |
| B | 5 | 225 | 1140 | 8.0 | 440 | 418 | 90.3 |
| C | 12 | 241 | 1222 | 7.03 | 445 | 413 | 115.1 |
| C | 3 | 158 | 1182 | 6.68 | 445 | 413 | 115.1 |
| C | 2 | 191 | 1166 | 6.54 | 445 | 413 | 115.1 |
| D | 3 | 14 | 1125 | 6.37 | 426 | 385 | 116.2 |
| D | 6 | 231 | 1098 | 6.14 | 426 | 385 | 116.2 |
| D | 1 | 19 | 1036 | 5.6 | 426 | 385 | 116.2 |
Histogram calculated using DETX and DETY for each event in the final _common_clean file
| Quadrant A |  |
 |
Quadrant B |
|---|---|---|---|
| Quadrant D |  |
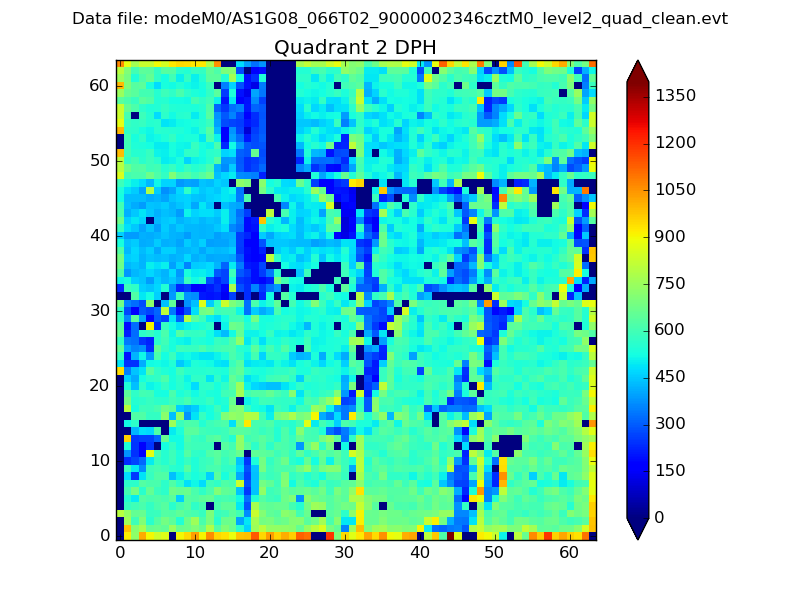 |
Quadrant C |
| Plot type | Count rate plots | Images |
|---|---|---|
| Comparison with Poisson distribution Blue bars denote a histogram of data divided into 1 sec bins. Red curve is a Poisson curve with rate = median count rate of data. |
 |
 |
| Quadrant-wise count rates Data is divided into 100 sec bins |
 |
|
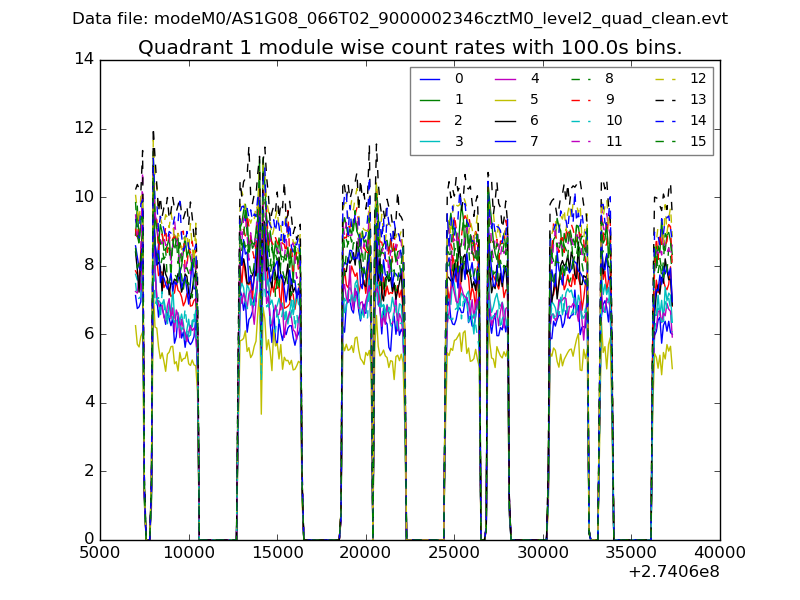
| Module-wise count rates for Quadrant A Data is divided into 100 sec bins |
 |
 |
| Module-wise count rates for Quadrant B Data is divided into 100 sec bins |
 |
 |
| Module-wise count rates for Quadrant C Data is divided into 100 sec bins |
 |
 |
| Module-wise count rates for Quadrant D Data is divided into 100 sec bins |
 |
 |
| Parameter | Plot |
|---|---|
| CZT HV Monitor |  |
| D_VDD |  |
| Temperature 1 |  |
| Veto HV Monitor |  |
| Veto LLD |  |
| Alpha Counter |  |
| _CPM_Rate |  |
| CZT Counter |  |
| +2.5 Volts monitor | 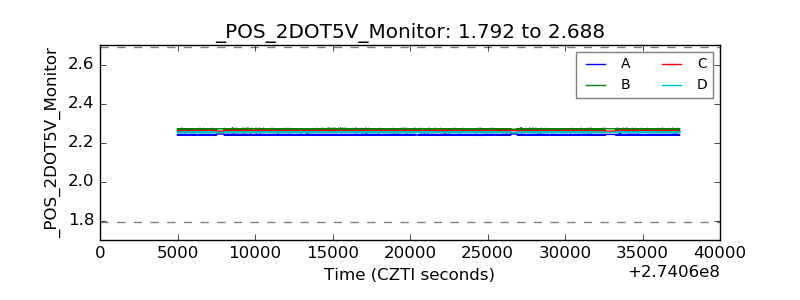 |
| +5 Volts monitor |  |
| _ROLL_ROT |  |
| _Roll_DEC |  |
| _Roll_RA |  |
| Veto Counter |  |