| Param | Original file | Final file |
|---|---|---|
| Filename | modeM0/AS1G08_066T02_9000002346_15925cztM0_level2.evt | modeM0/AS1G08_066T02_9000002346_15925cztM0_level2_quad_clean.evt |
| Size (bytes) | 298,814,400 | 43,928,640 |
| Size | 285.0 MB | 41.9 MB |
| Events in quadrant A | 2,423,210 | 261,738 |
| Events in quadrant B | 2,179,979 | 271,279 |
| Events in quadrant C | 2,164,870 | 256,342 |
| Events in quadrant D | 2,003,647 | 253,090 |
| Mode SS | |||
|---|---|---|---|
| Quadrant | BADHDUFLAG | Total packets | Discarded packets |
| A | 0 | 82 | 0 |
| B | 0 | 82 | 0 |
| C | 0 | 82 | 0 |
| D | 0 | 82 | 0 |
| Mode M0 | |||
|---|---|---|---|
| Quadrant | BADHDUFLAG | Total packets | Discarded packets |
| A | 0 | 9812 | 1 |
| B | 0 | 8975 | 0 |
| C | 0 | 8843 | 0 |
| D | 0 | 8660 | 0 |
| Mode M9 | |||
|---|---|---|---|
| Quadrant | BADHDUFLAG | Total packets | Discarded packets |
| A | 0 | 5 | 0 |
| B | 0 | 5 | 0 |
| C | 0 | 5 | 0 |
| D | 0 | 5 | 0 |
| Quadrant | Total seconds | Saturated seconds | Saturation percentage |
|---|---|---|---|
| A | 4078 | 81 | 1.986268% |
| B | 4078 | 81 | 1.986268% |
| C | 4078 | 84 | 2.059833% |
| D | 4078 | 30 | 0.735655% |
Noise dominated data is calculated using 1-second bins in cleaned event files. If a bin has >2000 counts, and if more than 50% of those come from <1% of pixels, then it is considered to be noise-dominated and hence unusable.
| Quadrant | # 1 sec bins | Bins with >0 counts | Bins with >2000 counts | High rate bins dominated by noise | Noise dominated (total time) | Noise dominated (detector-on time) | Marked lightcurve |
|---|---|---|---|---|---|---|---|
| A | 4549 | 4080 | 11 | 11 | 0.24% | 0.27% | 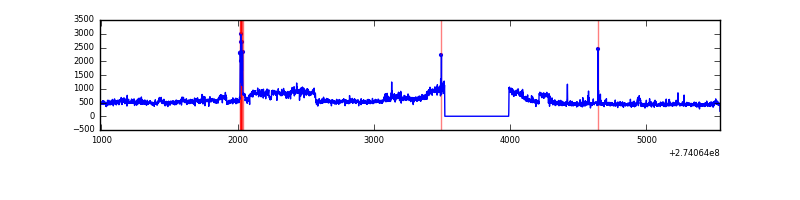 |
| B | 4549 | 4080 | 1 | 1 | 0.02% | 0.02% | 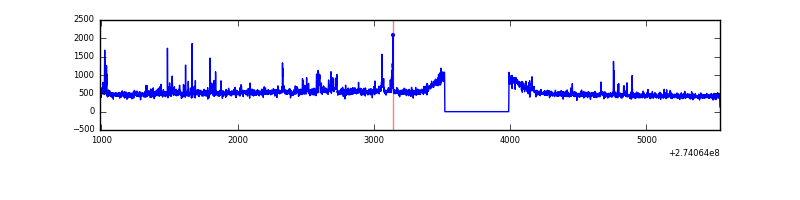 |
| C | 4549 | 4080 | 0 | 0 | 0.00% | 0.00% | 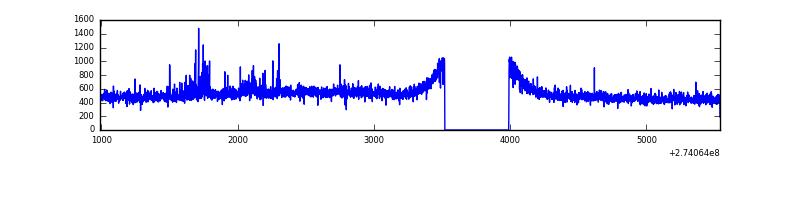 |
| D | 4549 | 4080 | 5 | 5 | 0.11% | 0.12% | 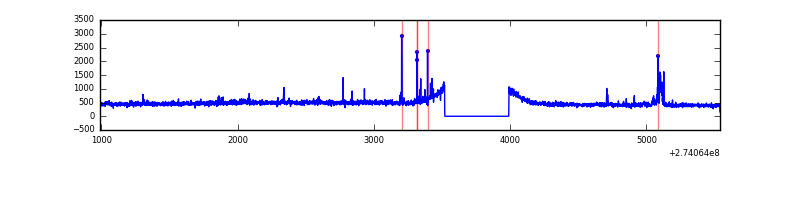 |
Top three noisy pixels from each quadrant. If the there are fewer than three noisy pixels in the level2.evt file, extra rows are filled as -1
| Pixel properties | Quadrant properties | ||||||
|---|---|---|---|---|---|---|---|
| Quadrant | DetID | PixID | Counts | Sigma | Mean | Median | Sigma |
| A | 15 | 239 | 420806 | 3941.41 | 519 | 507 | 106.6 |
| A | 0 | 226 | 4462 | 37.09 | 519 | 507 | 106.6 |
| A | 12 | 194 | 3900 | 31.82 | 519 | 507 | 106.6 |
| B | 0 | 189 | 56472 | 548.38 | 524 | 510 | 102.1 |
| B | 4 | 216 | 34781 | 335.82 | 524 | 510 | 102.1 |
| B | 4 | 173 | 16423 | 155.93 | 524 | 510 | 102.1 |
| C | 3 | 233 | 84301 | 696.74 | 501 | 505 | 120.3 |
| C | 14 | 238 | 76312 | 630.31 | 501 | 505 | 120.3 |
| C | 7 | 247 | 47957 | 394.55 | 501 | 505 | 120.3 |
| D | 10 | 40 | 28300 | 220.2 | 510 | 494 | 126.3 |
| D | 2 | 234 | 15019 | 115.02 | 510 | 494 | 126.3 |
| D | 12 | 17 | 11669 | 88.5 | 510 | 494 | 126.3 |
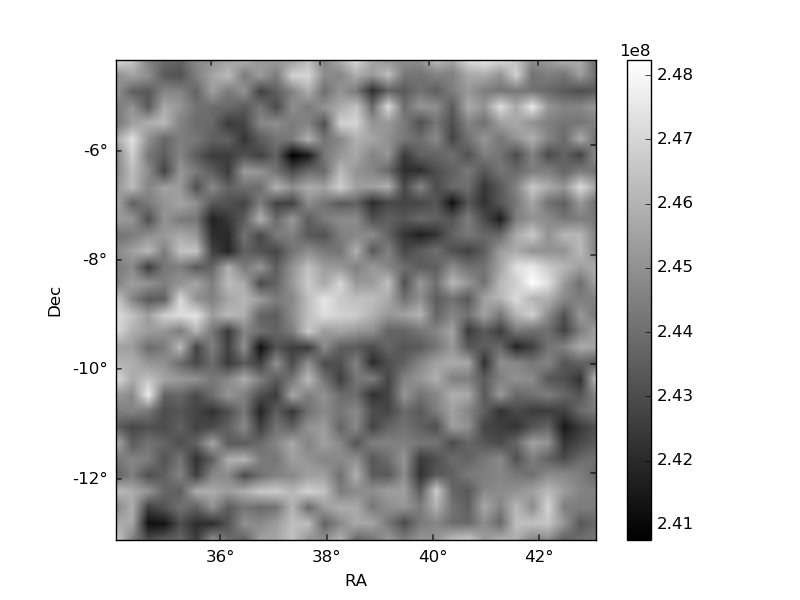
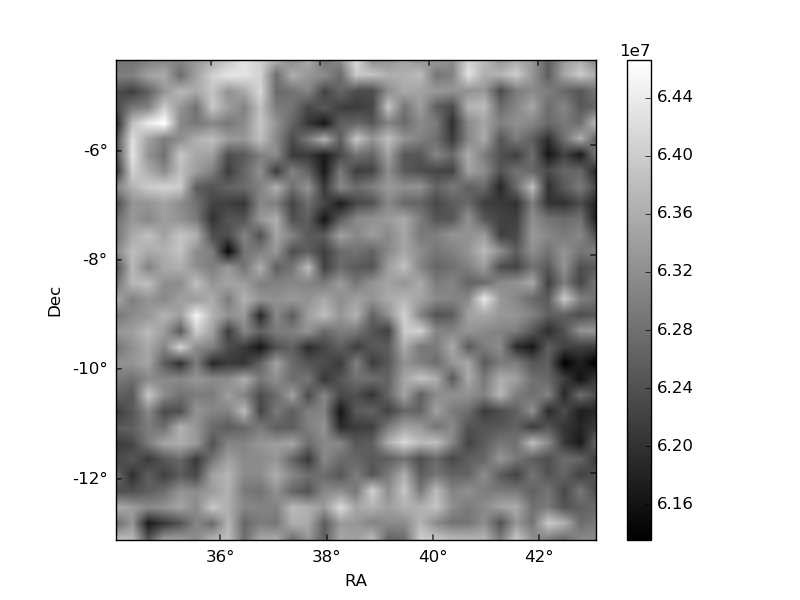
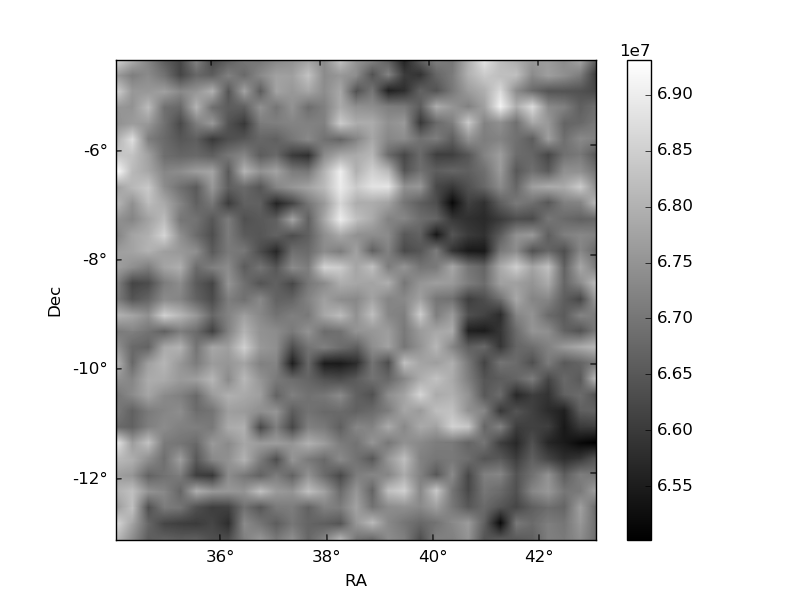
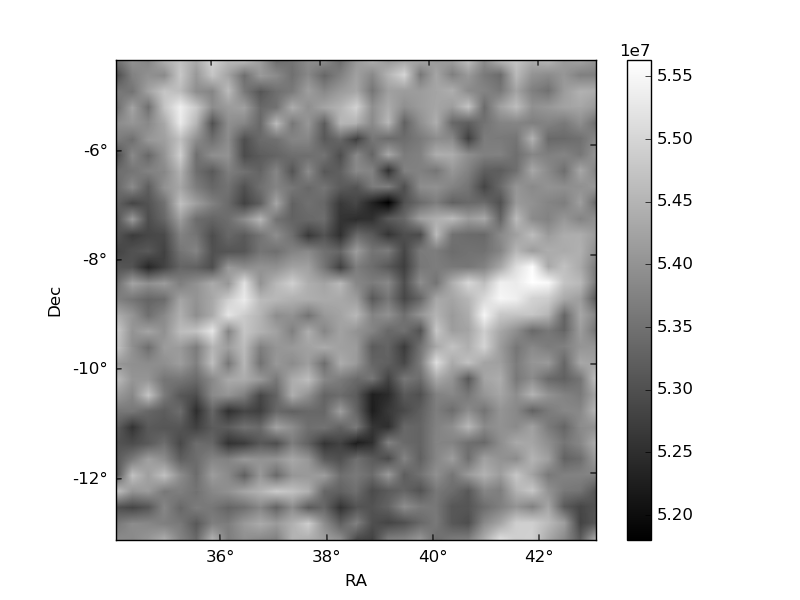
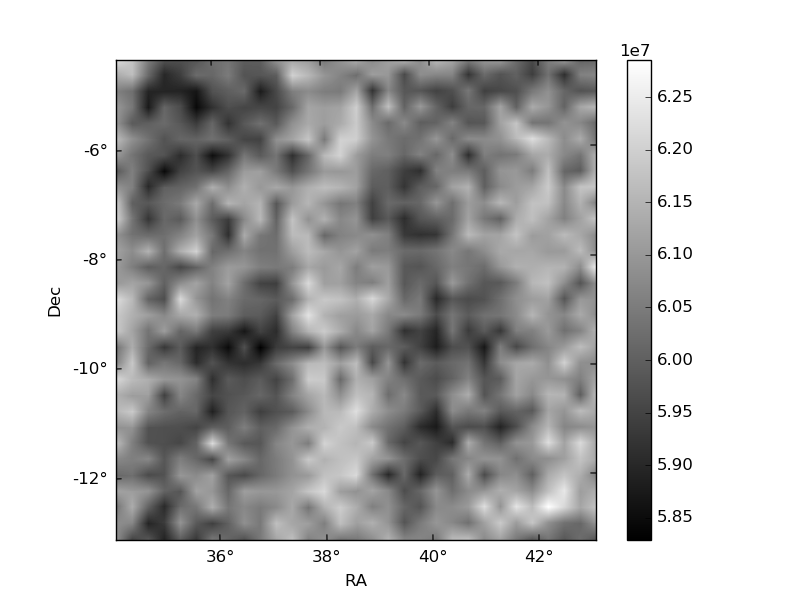
Histogram calculated using DETX and DETY for each event in the final _common_clean file
| Quadrant A | 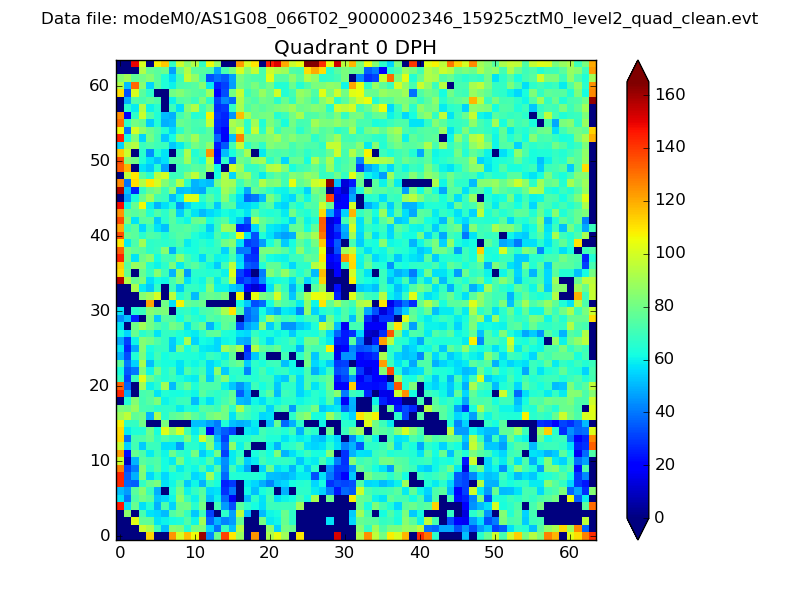 |
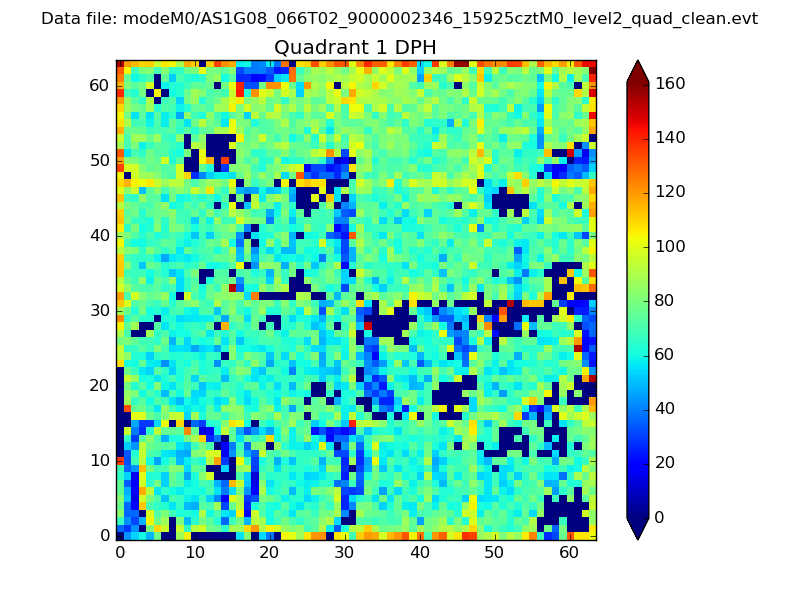 |
Quadrant B |
|---|---|---|---|
| Quadrant D | 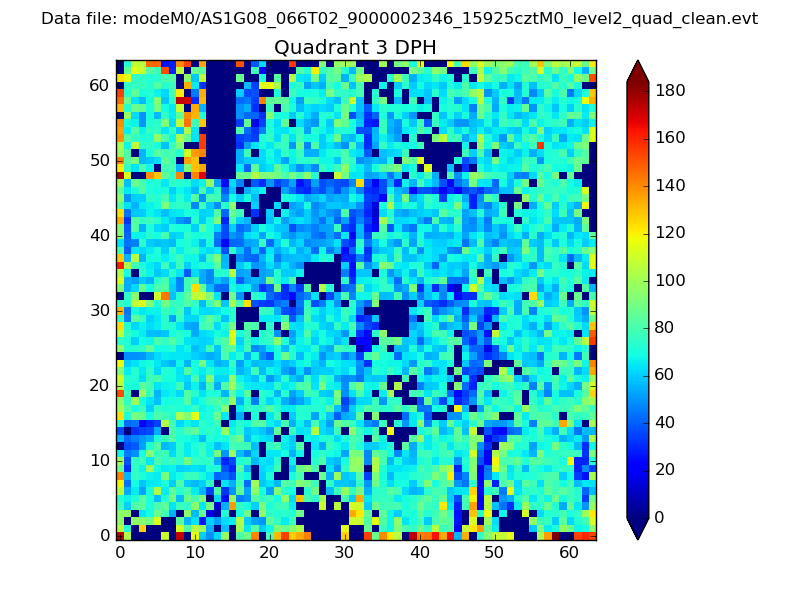 |
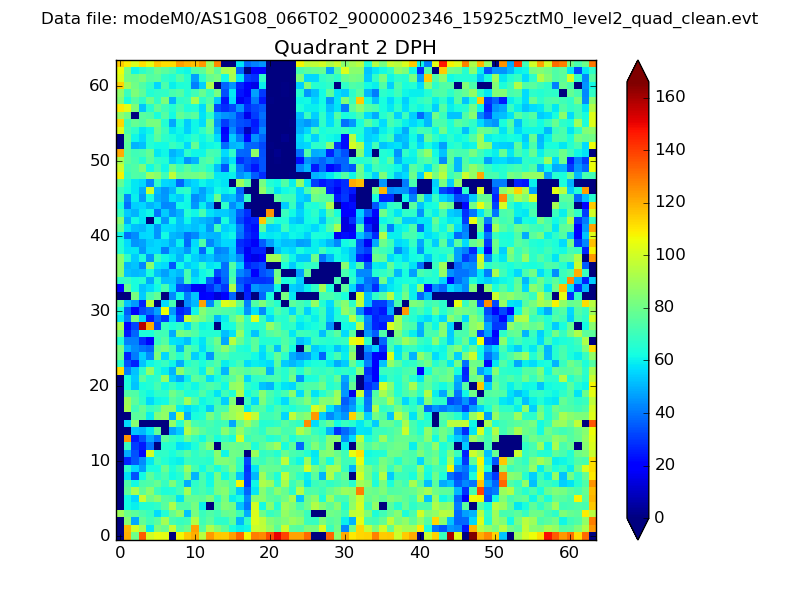 |
Quadrant C |
| Plot type | Count rate plots | Images |
|---|---|---|
| Comparison with Poisson distribution Blue bars denote a histogram of data divided into 1 sec bins. Red curve is a Poisson curve with rate = median count rate of data. |
 |
 |
| Quadrant-wise count rates Data is divided into 100 sec bins |
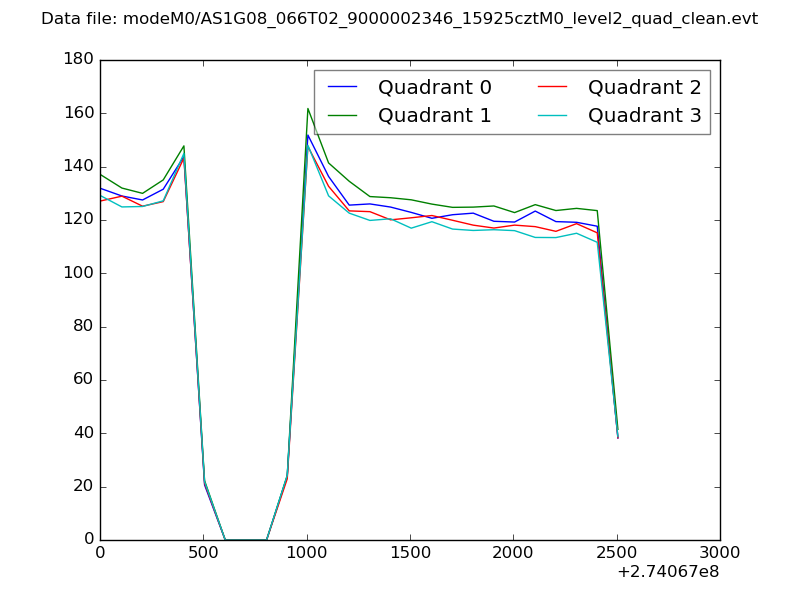 |
|
| Module-wise count rates for Quadrant A Data is divided into 100 sec bins |
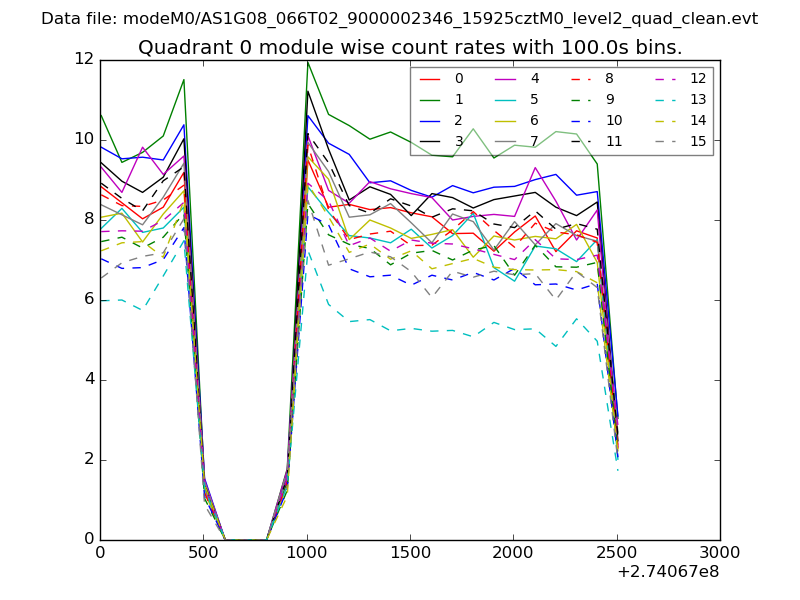 |
 |
| Module-wise count rates for Quadrant B Data is divided into 100 sec bins |
 |
 |
| Module-wise count rates for Quadrant C Data is divided into 100 sec bins |
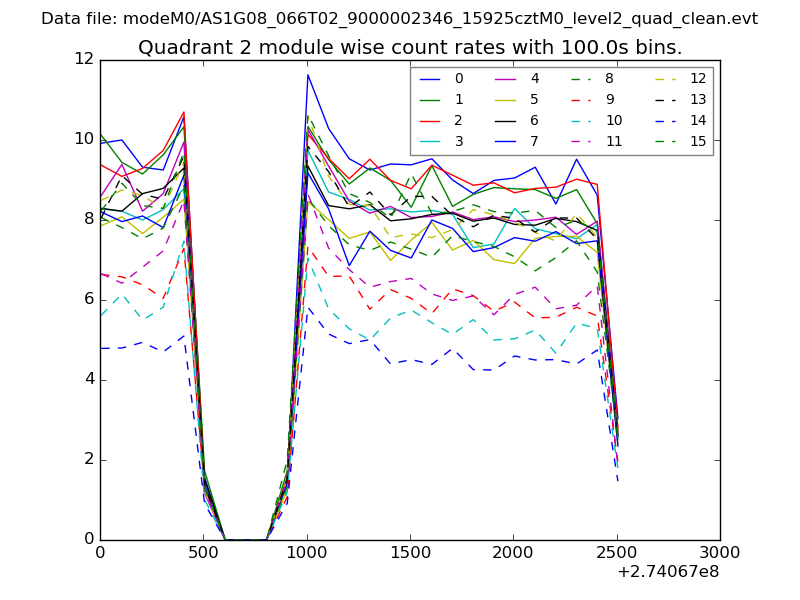 |
 |
| Module-wise count rates for Quadrant D Data is divided into 100 sec bins |
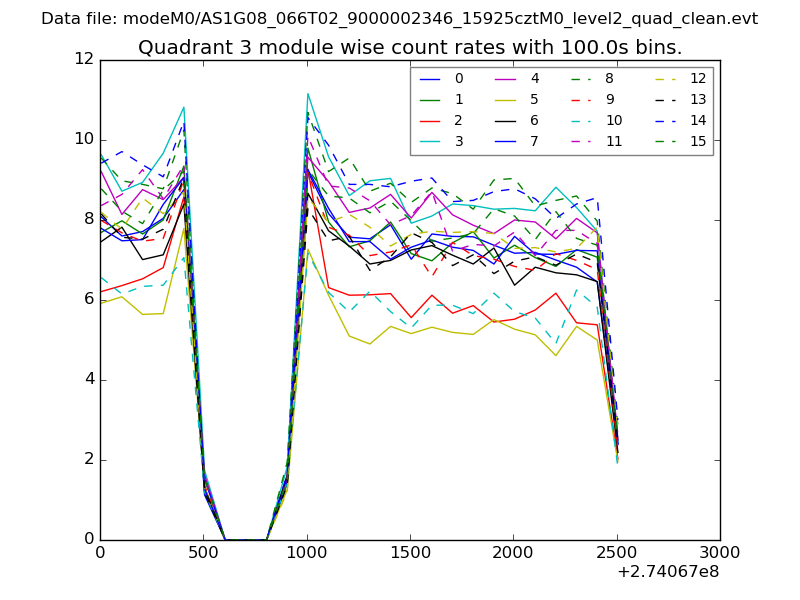 |
 |
| Parameter | Plot |
|---|---|
| CZT HV Monitor |  |
| D_VDD | 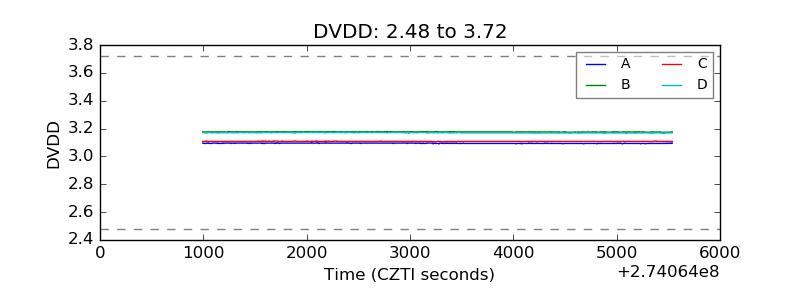 |
| Temperature 1 | 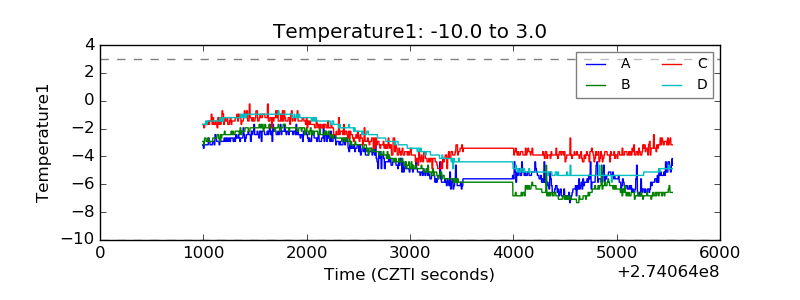 |
| Veto HV Monitor | 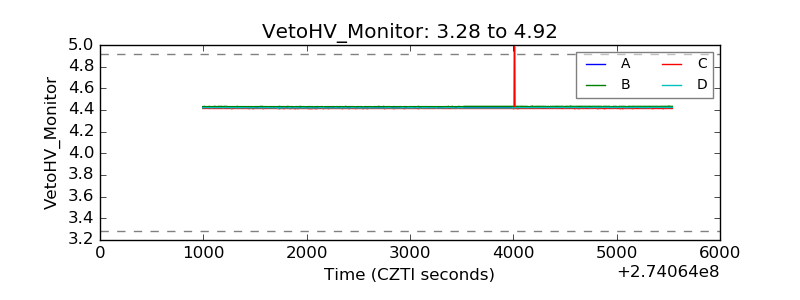 |
| Veto LLD | 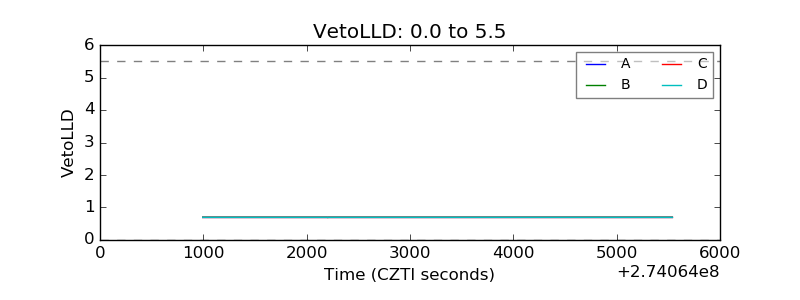 |
| Alpha Counter | 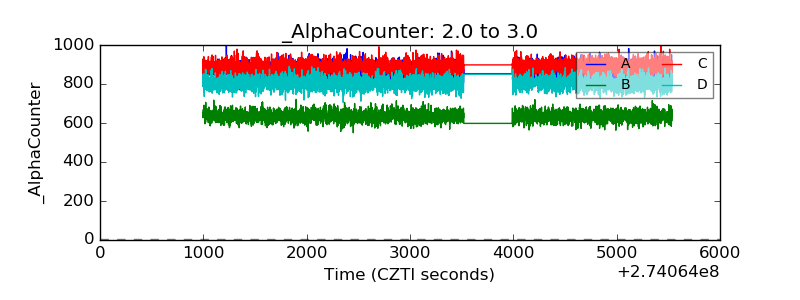 |
| _CPM_Rate | 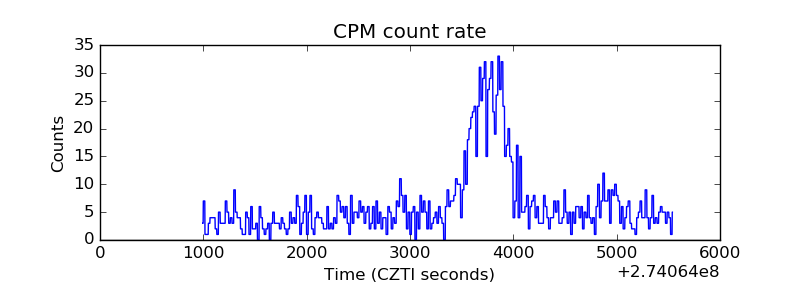 |
| CZT Counter | 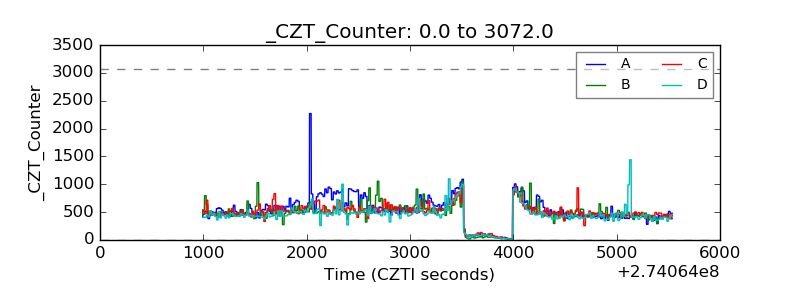 |
| +2.5 Volts monitor |  |
| +5 Volts monitor |  |
| _ROLL_ROT | 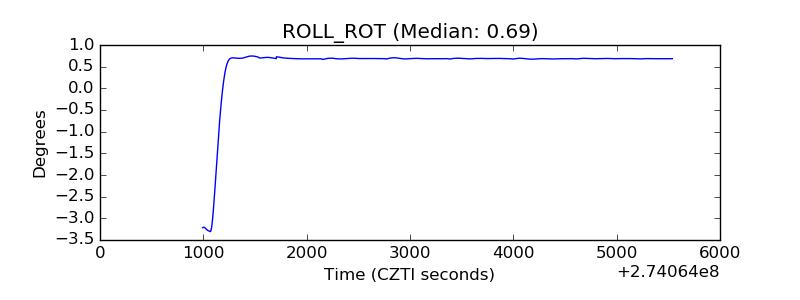 |
| _Roll_DEC | 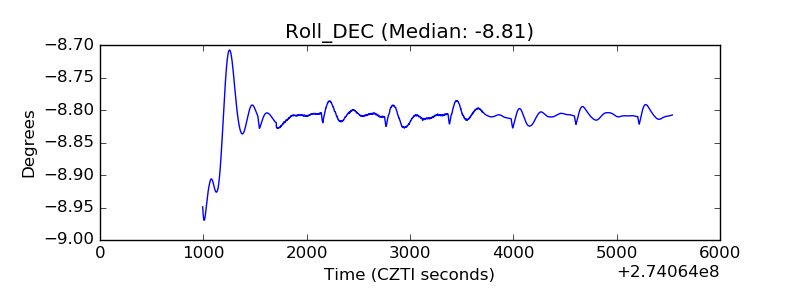 |
| _Roll_RA | 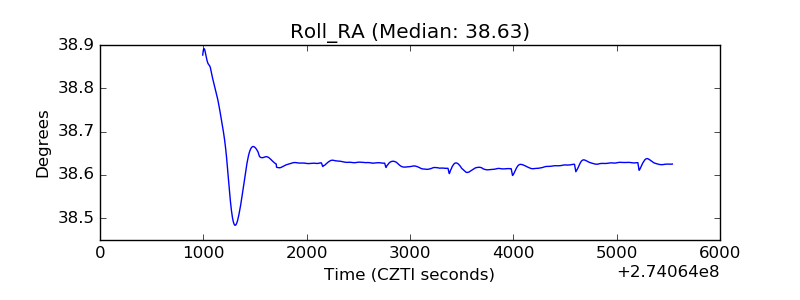 |
| Veto Counter |  |