| Param | Original file | Final file |
|---|---|---|
| Filename | modeM0/AS1G08_066T02_9000002346_15926cztM0_level2.evt | modeM0/AS1G08_066T02_9000002346_15926cztM0_level2_quad_clean.evt |
| Size (bytes) | 462,424,320 | 92,370,240 |
| Size | 441.0 MB | 88.1 MB |
| Events in quadrant A | 3,470,118 | 582,134 |
| Events in quadrant B | 3,407,283 | 600,982 |
| Events in quadrant C | 3,447,975 | 570,467 |
| Events in quadrant D | 3,208,505 | 561,534 |
| Mode SS | |||
|---|---|---|---|
| Quadrant | BADHDUFLAG | Total packets | Discarded packets |
| A | 0 | 162 | 24 |
| B | 0 | 162 | 22 |
| C | 0 | 162 | 24 |
| D | 0 | 162 | 24 |
| Mode M0 | |||
|---|---|---|---|
| Quadrant | BADHDUFLAG | Total packets | Discarded packets |
| A | 0 | 17077 | 2441 |
| B | 0 | 17058 | 2467 |
| C | 0 | 16957 | 2413 |
| D | 0 | 16930 | 2458 |
| Mode M9 | |||
|---|---|---|---|
| Quadrant | BADHDUFLAG | Total packets | Discarded packets |
| A | 0 | 2 | 0 |
| B | 0 | 2 | 0 |
| C | 0 | 2 | 0 |
| D | 0 | 3 | 0 |
| Quadrant | Total seconds | Saturated seconds | Saturation percentage |
|---|---|---|---|
| A | 6914 | 181 | 2.617877% |
| B | 6903 | 164 | 2.375779% |
| C | 6915 | 193 | 2.791034% |
| D | 6897 | 108 | 1.565898% |
Noise dominated data is calculated using 1-second bins in cleaned event files. If a bin has >2000 counts, and if more than 50% of those come from <1% of pixels, then it is considered to be noise-dominated and hence unusable.
| Quadrant | # 1 sec bins | Bins with >0 counts | Bins with >2000 counts | High rate bins dominated by noise | Noise dominated (total time) | Noise dominated (detector-on time) | Marked lightcurve |
|---|---|---|---|---|---|---|---|
| A | 8140 | 7302 | 1 | 1 | 0.01% | 0.01% | 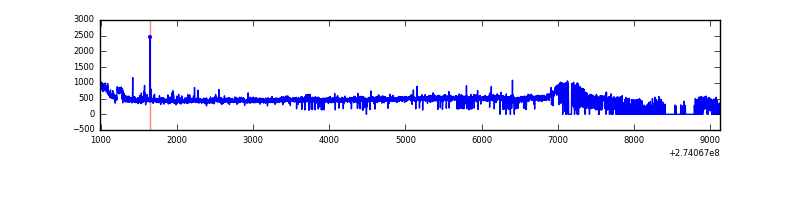 |
| B | 8131 | 7296 | 0 | 0 | 0.00% | 0.00% | 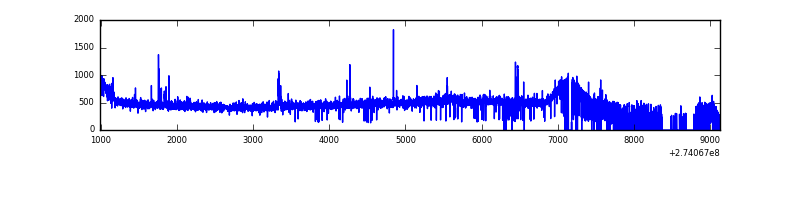 |
| C | 8138 | 7327 | 0 | 0 | 0.00% | 0.00% | 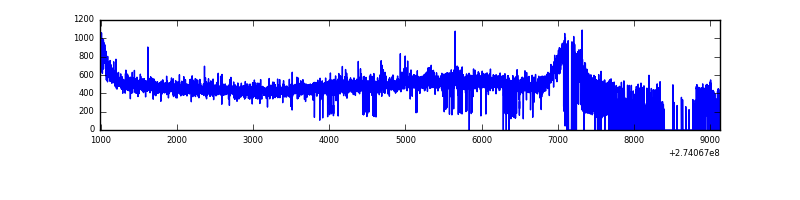 |
| D | 8137 | 7303 | 3 | 3 | 0.04% | 0.04% | 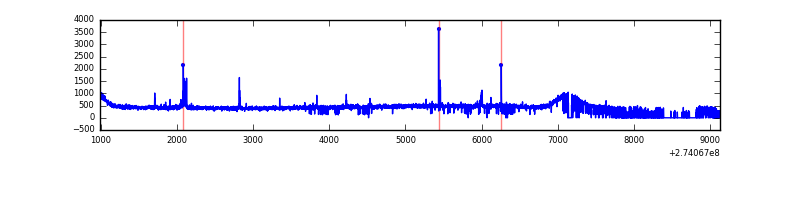 |
Top three noisy pixels from each quadrant. If the there are fewer than three noisy pixels in the level2.evt file, extra rows are filled as -1
| Pixel properties | Quadrant properties | ||||||
|---|---|---|---|---|---|---|---|
| Quadrant | DetID | PixID | Counts | Sigma | Mean | Median | Sigma |
| A | 15 | 239 | 209192 | 1200.41 | 847 | 826 | 173.6 |
| A | 0 | 226 | 7008 | 35.61 | 847 | 826 | 173.6 |
| A | 12 | 194 | 6328 | 31.7 | 847 | 826 | 173.6 |
| B | 4 | 173 | 34999 | 206.83 | 850 | 828 | 165.2 |
| B | 12 | 111 | 19868 | 115.25 | 850 | 828 | 165.2 |
| B | 0 | 189 | 19474 | 112.86 | 850 | 828 | 165.2 |
| C | 14 | 238 | 124133 | 632.33 | 820 | 826 | 195.0 |
| C | 3 | 233 | 103556 | 526.81 | 820 | 826 | 195.0 |
| C | 7 | 247 | 18835 | 92.35 | 820 | 826 | 195.0 |
| D | 10 | 40 | 28605 | 135.54 | 831 | 804 | 205.1 |
| D | 2 | 234 | 25083 | 118.37 | 831 | 804 | 205.1 |
| D | 7 | 223 | 12821 | 58.59 | 831 | 804 | 205.1 |
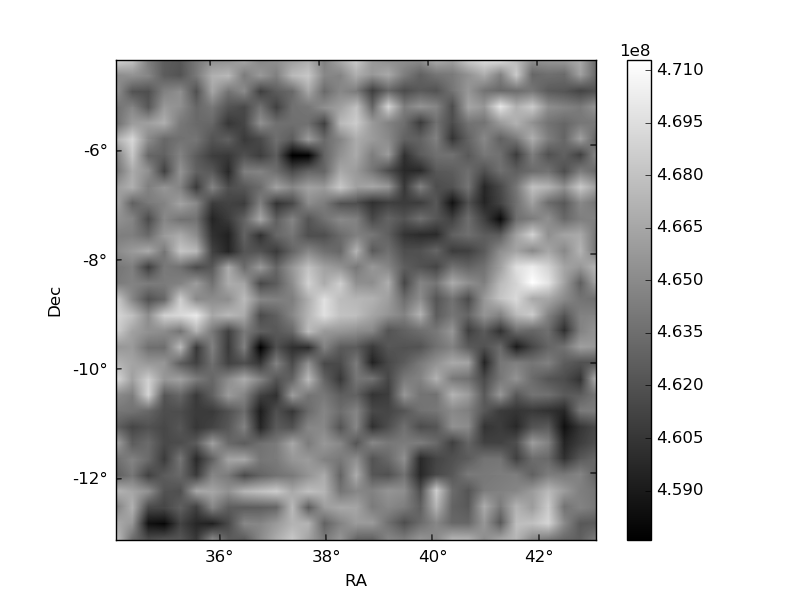
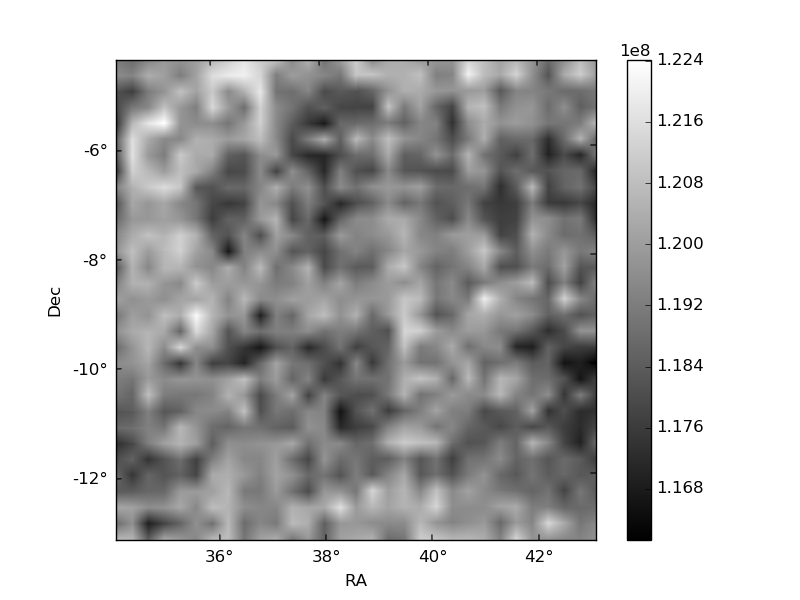
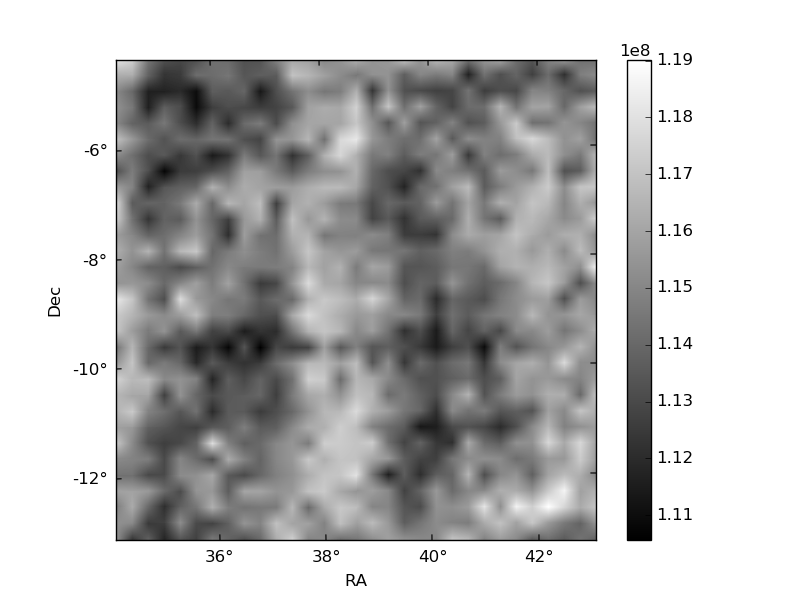
Histogram calculated using DETX and DETY for each event in the final _common_clean file
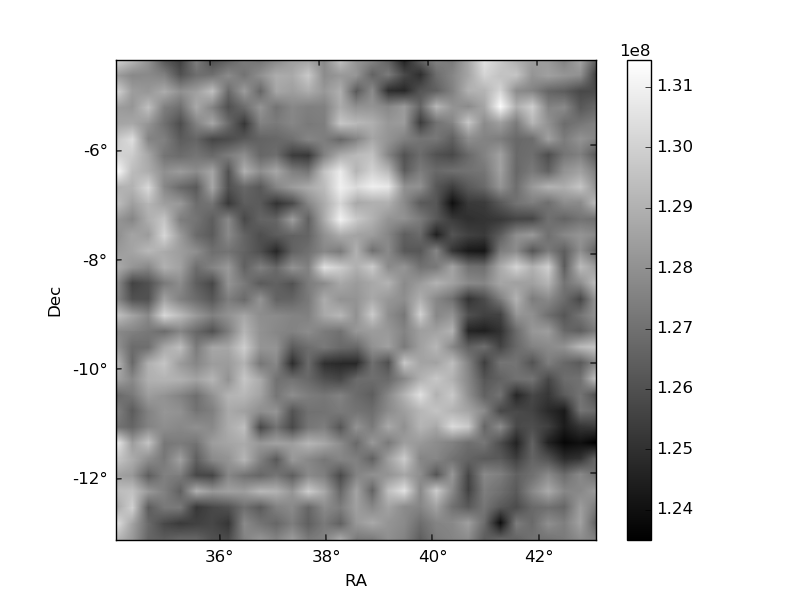
| Quadrant A | 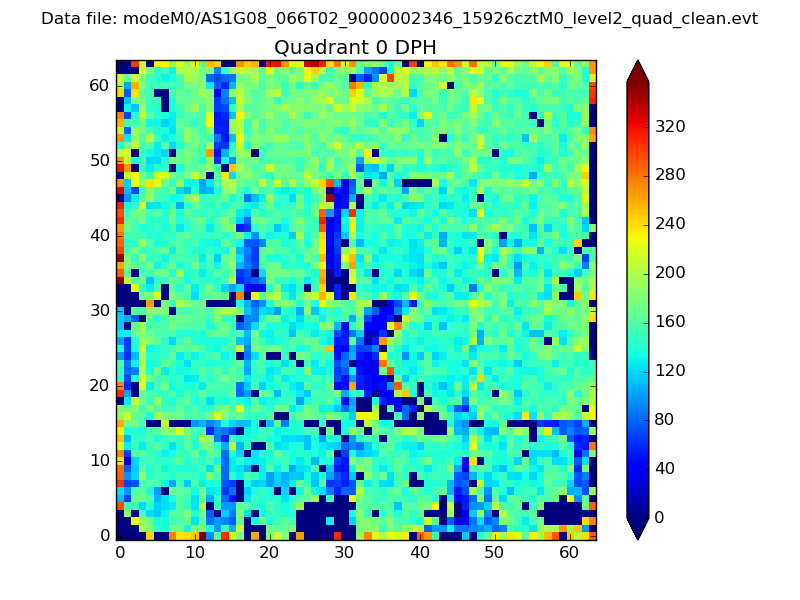 |
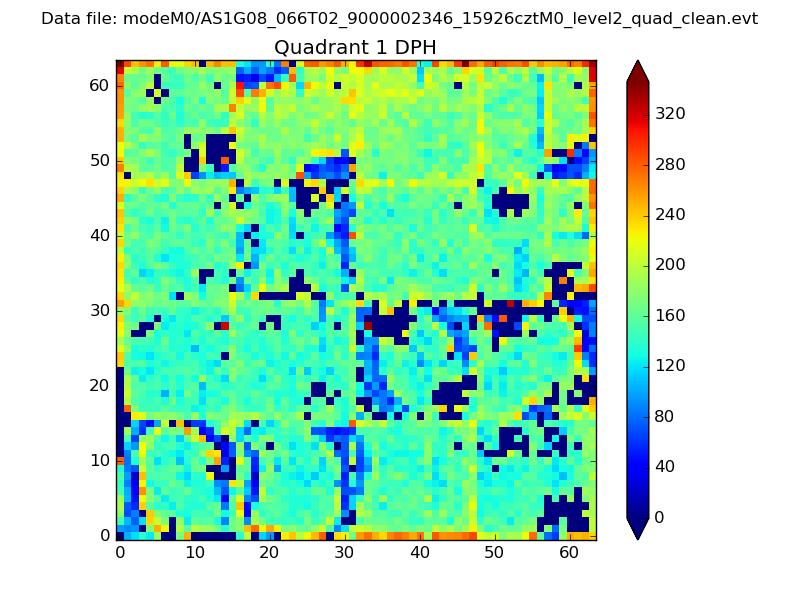 |
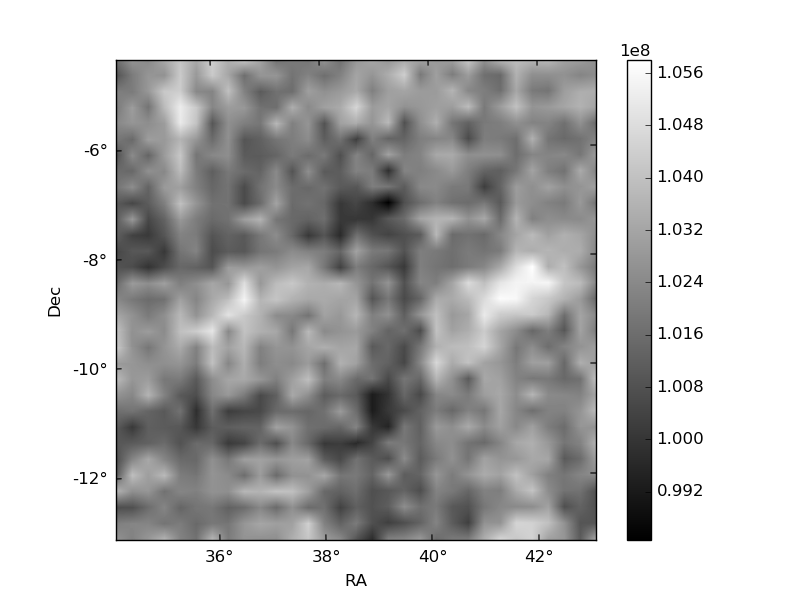
Quadrant B |
|---|---|---|---|
| Quadrant D | 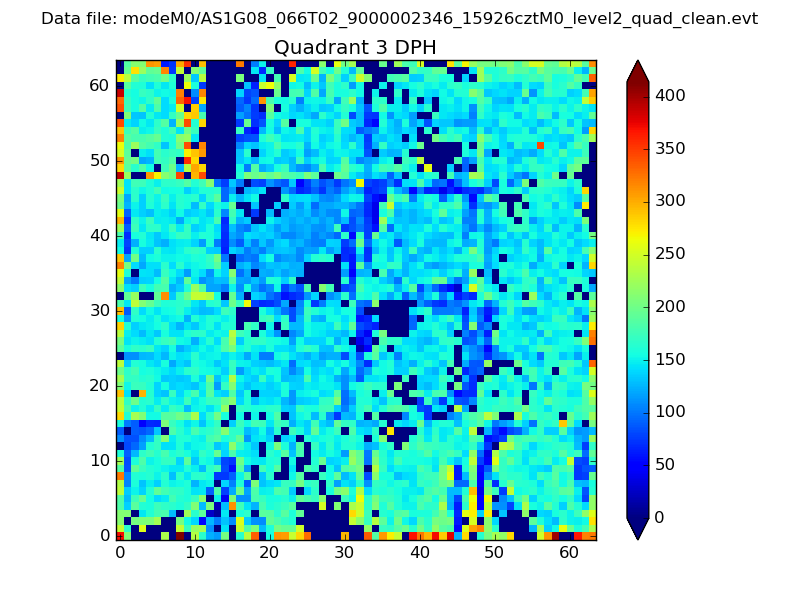 |
 |
Quadrant C |
| Plot type | Count rate plots | Images |
|---|---|---|
| Comparison with Poisson distribution Blue bars denote a histogram of data divided into 1 sec bins. Red curve is a Poisson curve with rate = median count rate of data. |
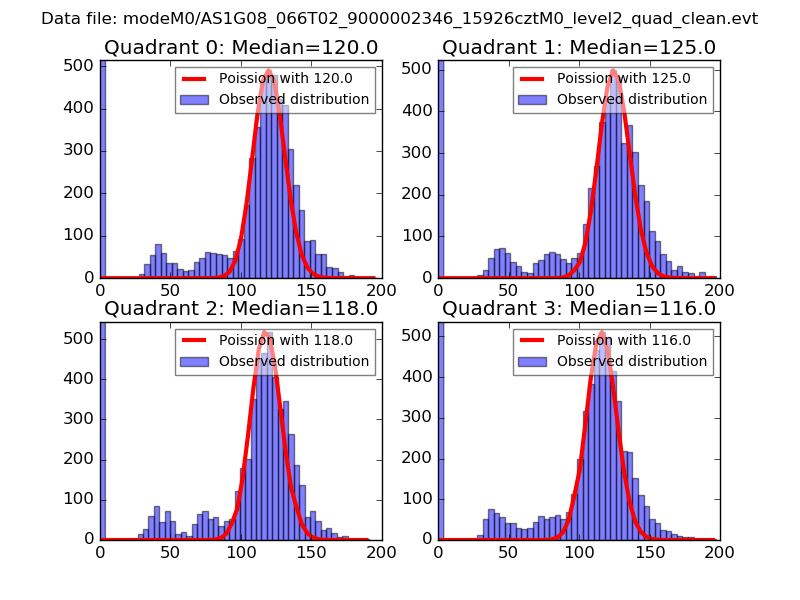 |
 |
| Quadrant-wise count rates Data is divided into 100 sec bins |
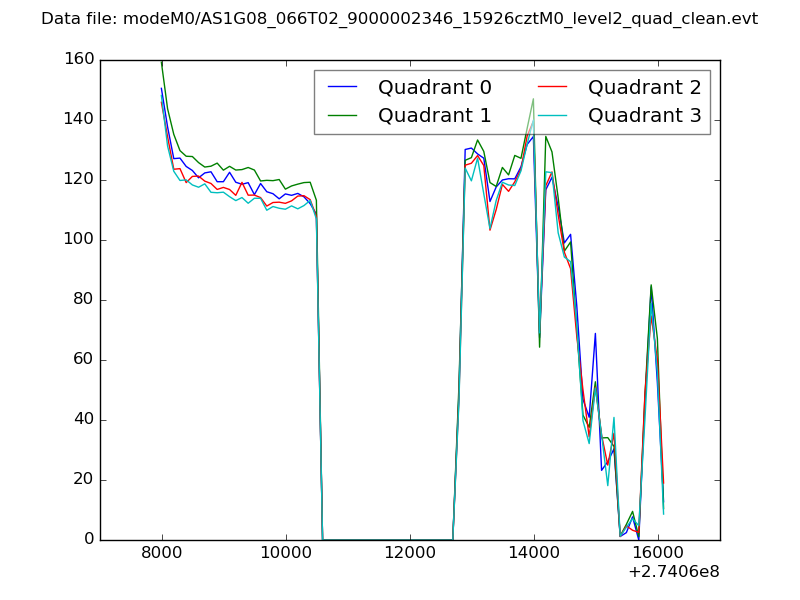 |
|
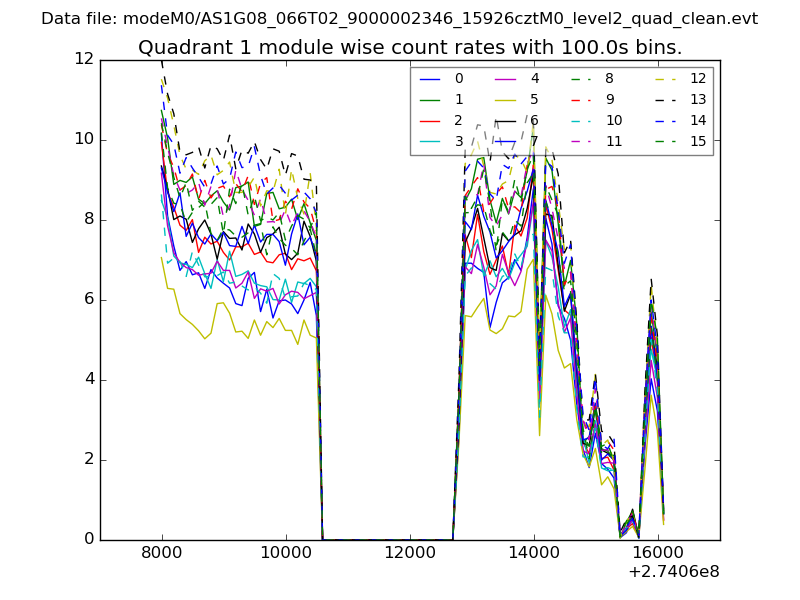
| Module-wise count rates for Quadrant A Data is divided into 100 sec bins |
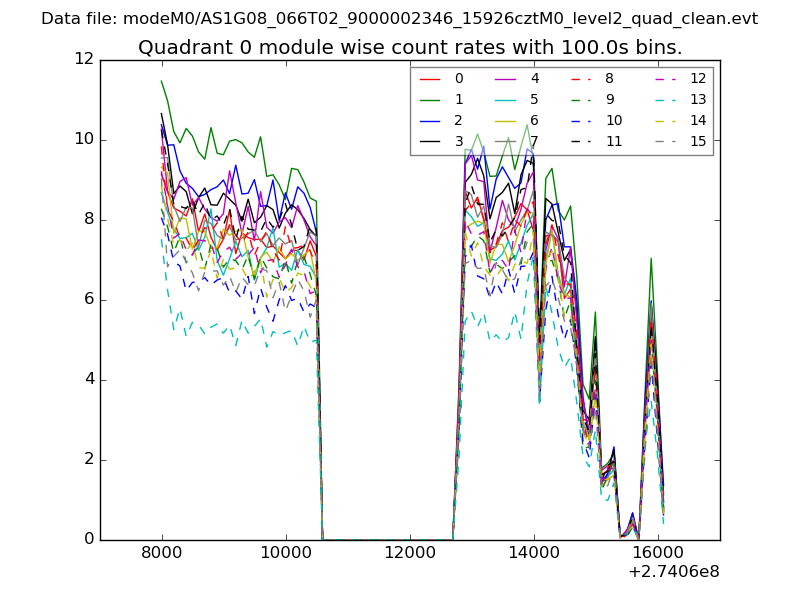 |
 |
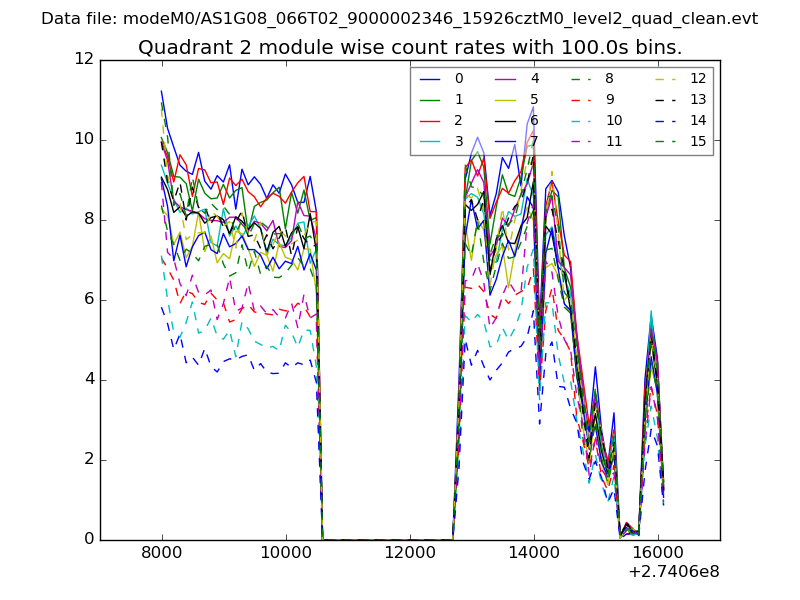
| Module-wise count rates for Quadrant B Data is divided into 100 sec bins |
 |
 |
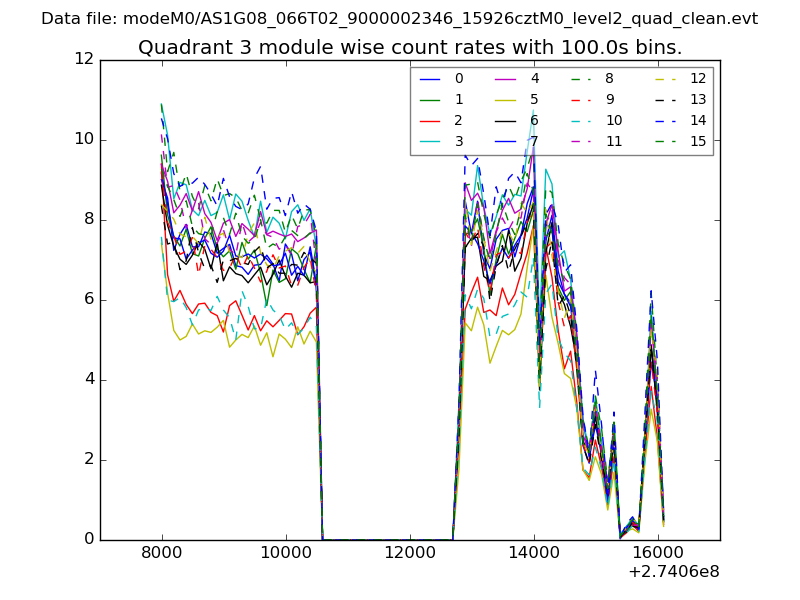
| Module-wise count rates for Quadrant C Data is divided into 100 sec bins |
 |
 |
| Module-wise count rates for Quadrant D Data is divided into 100 sec bins |
 |
 |
| Parameter | Plot |
|---|---|
| CZT HV Monitor | 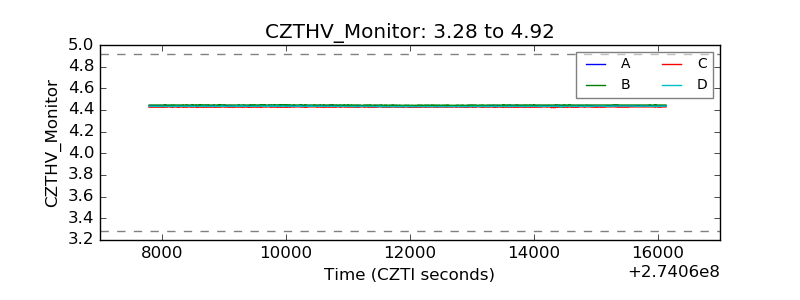 |
| D_VDD | 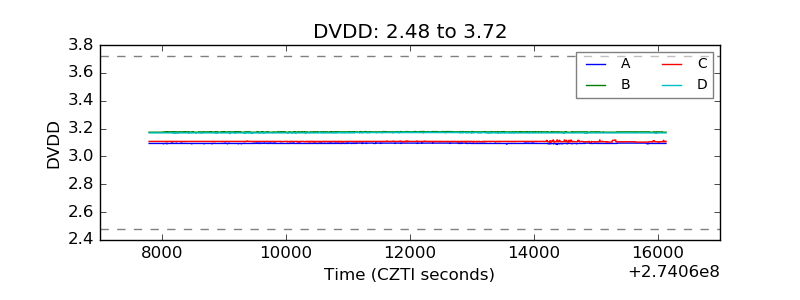 |
| Temperature 1 | 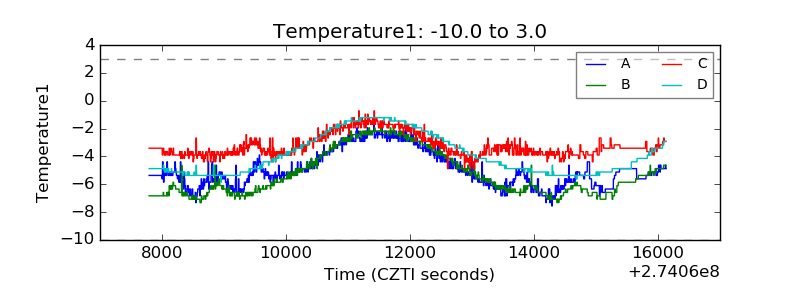 |
| Veto HV Monitor | 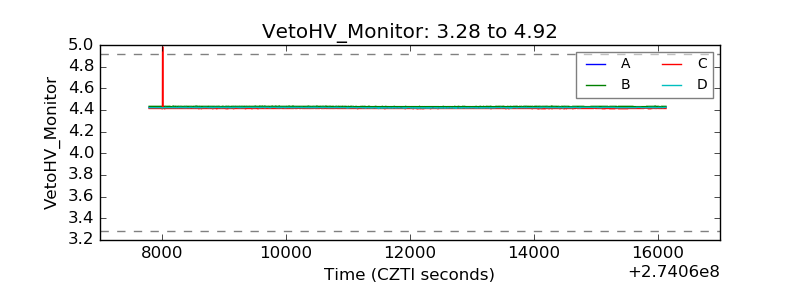 |
| Veto LLD | 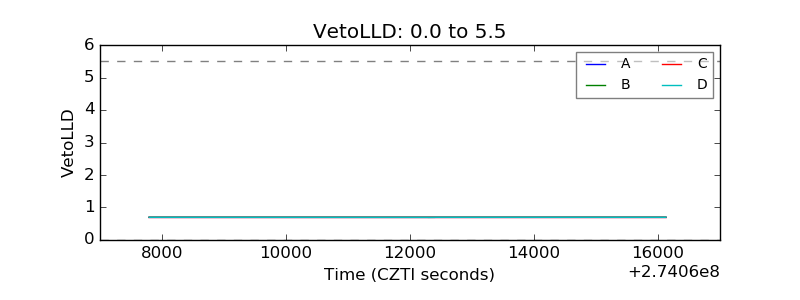 |
| Alpha Counter | 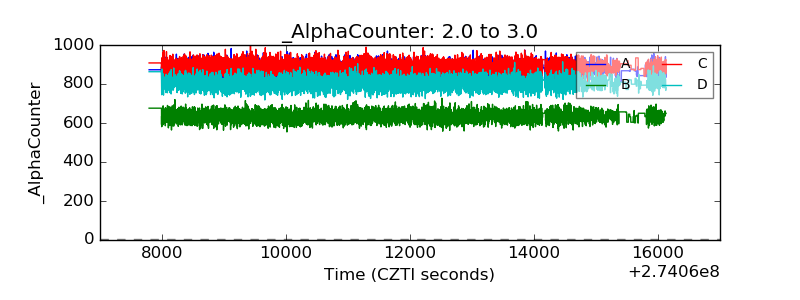 |
| _CPM_Rate | 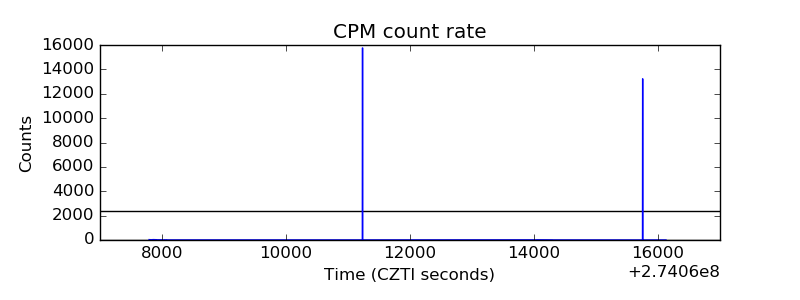 |
| CZT Counter |  |
| +2.5 Volts monitor |  |
| +5 Volts monitor | 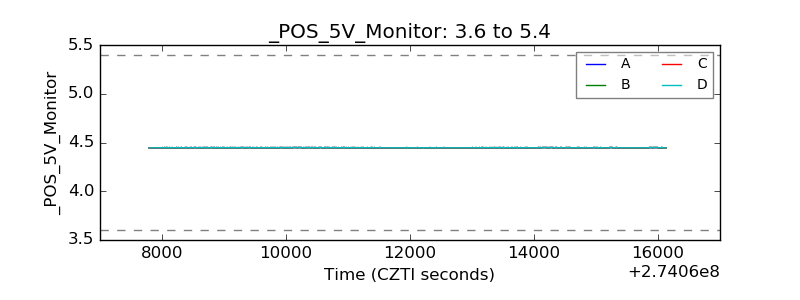 |
| _ROLL_ROT | 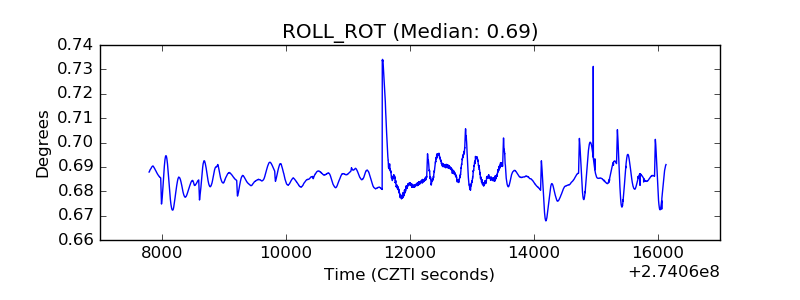 |
| _Roll_DEC | 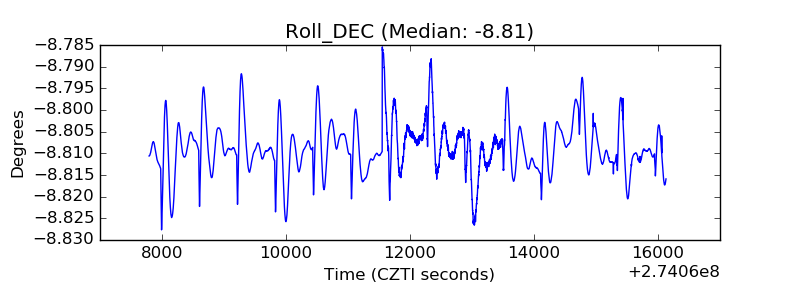 |
| _Roll_RA | 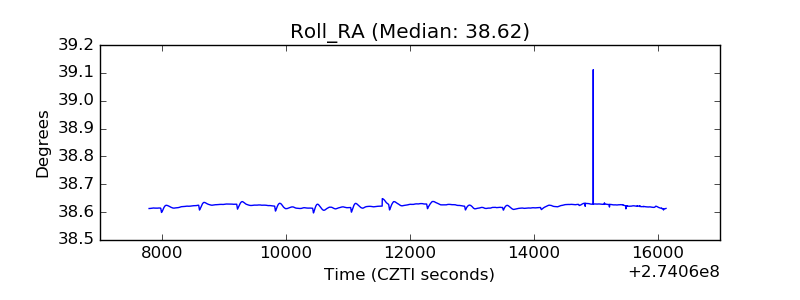 |
| Veto Counter | 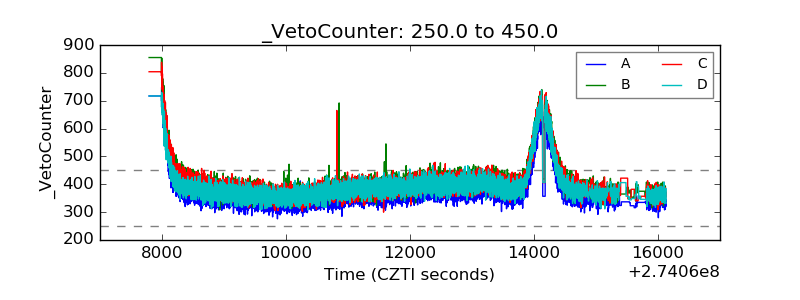 |