| Param | Original file | Final file |
|---|---|---|
| Filename | modeM0/AS1G08_066T02_9000002346_15930cztM0_level2.evt | modeM0/AS1G08_066T02_9000002346_15930cztM0_level2_quad_clean.evt |
| Size (bytes) | 989,925,120 | 165,902,400 |
| Size | 944.1 MB | 158.2 MB |
| Events in quadrant A | 7,906,287 | 1,001,509 |
| Events in quadrant B | 7,212,315 | 1,034,880 |
| Events in quadrant C | 7,193,753 | 983,537 |
| Events in quadrant D | 6,653,094 | 969,957 |
| Mode SS | |||
|---|---|---|---|
| Quadrant | BADHDUFLAG | Total packets | Discarded packets |
| A | 0 | 306 | 0 |
| B | 0 | 306 | 0 |
| C | 0 | 306 | 0 |
| D | 0 | 306 | 0 |
| Mode M0 | |||
|---|---|---|---|
| Quadrant | BADHDUFLAG | Total packets | Discarded packets |
| A | 0 | 32466 | 2 |
| B | 0 | 30904 | 2 |
| C | 0 | 30478 | 2 |
| D | 0 | 30522 | 2 |
| Mode M9 | |||
|---|---|---|---|
| Quadrant | BADHDUFLAG | Total packets | Discarded packets |
| A | 0 | 10 | 0 |
| B | 0 | 10 | 0 |
| C | 0 | 10 | 0 |
| D | 0 | 10 | 0 |
| Quadrant | Total seconds | Saturated seconds | Saturation percentage |
|---|---|---|---|
| A | 14979 | 176 | 1.174978% |
| B | 14979 | 173 | 1.154950% |
| C | 14979 | 191 | 1.275118% |
| D | 14979 | 135 | 0.901262% |
Noise dominated data is calculated using 1-second bins in cleaned event files. If a bin has >2000 counts, and if more than 50% of those come from <1% of pixels, then it is considered to be noise-dominated and hence unusable.
| Quadrant | # 1 sec bins | Bins with >0 counts | Bins with >2000 counts | High rate bins dominated by noise | Noise dominated (total time) | Noise dominated (detector-on time) | Marked lightcurve |
|---|---|---|---|---|---|---|---|
| A | 16030 | 14980 | 3 | 3 | 0.02% | 0.02% | 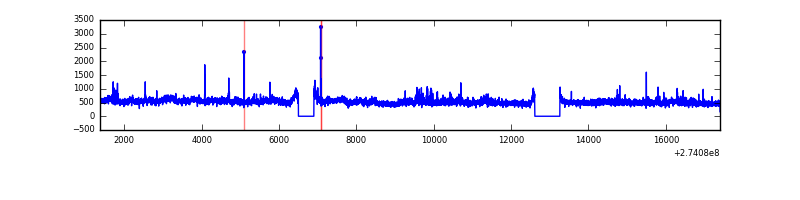 |
| B | 16030 | 14980 | 18 | 18 | 0.11% | 0.12% | 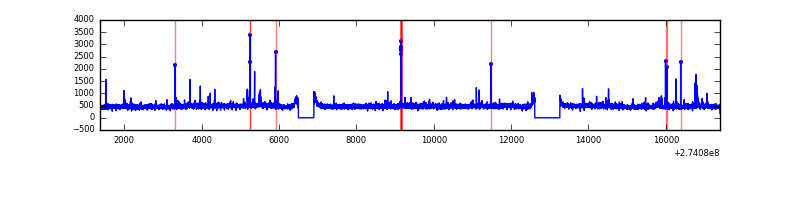 |
| C | 16030 | 14980 | 0 | 0 | 0.00% | 0.00% | 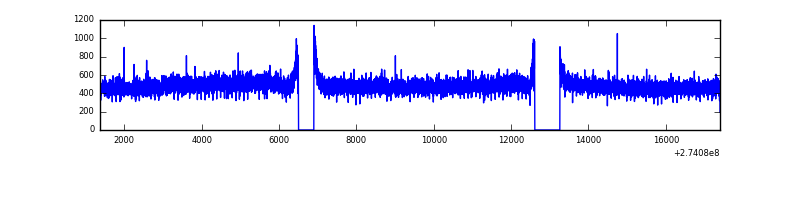 |
| D | 16030 | 14980 | 4 | 4 | 0.02% | 0.03% | 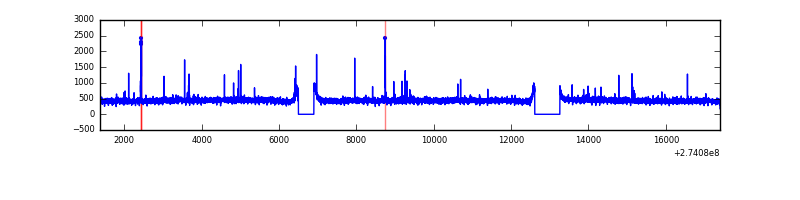 |
Top three noisy pixels from each quadrant. If the there are fewer than three noisy pixels in the level2.evt file, extra rows are filled as -1
| Pixel properties | Quadrant properties | ||||||
|---|---|---|---|---|---|---|---|
| Quadrant | DetID | PixID | Counts | Sigma | Mean | Median | Sigma |
| A | 15 | 239 | 1072690 | 3017.37 | 1766 | 1730 | 354.9 |
| A | 15 | 174 | 19786 | 50.87 | 1766 | 1730 | 354.9 |
| A | 0 | 226 | 16021 | 40.26 | 1766 | 1730 | 354.9 |
| B | 0 | 189 | 56074 | 159.57 | 1771 | 1725 | 340.6 |
| B | 4 | 173 | 48424 | 137.11 | 1771 | 1725 | 340.6 |
| B | 4 | 216 | 47748 | 135.12 | 1771 | 1725 | 340.6 |
| C | 3 | 233 | 302835 | 757.55 | 1700 | 1708 | 397.5 |
| C | 14 | 238 | 258557 | 646.16 | 1700 | 1708 | 397.5 |
| C | 13 | 61 | 12048 | 26.01 | 1700 | 1708 | 397.5 |
| D | 2 | 234 | 61194 | 141.53 | 1729 | 1678 | 420.5 |
| D | 13 | 172 | 39084 | 88.95 | 1729 | 1678 | 420.5 |
| D | 13 | 168 | 25406 | 56.42 | 1729 | 1678 | 420.5 |
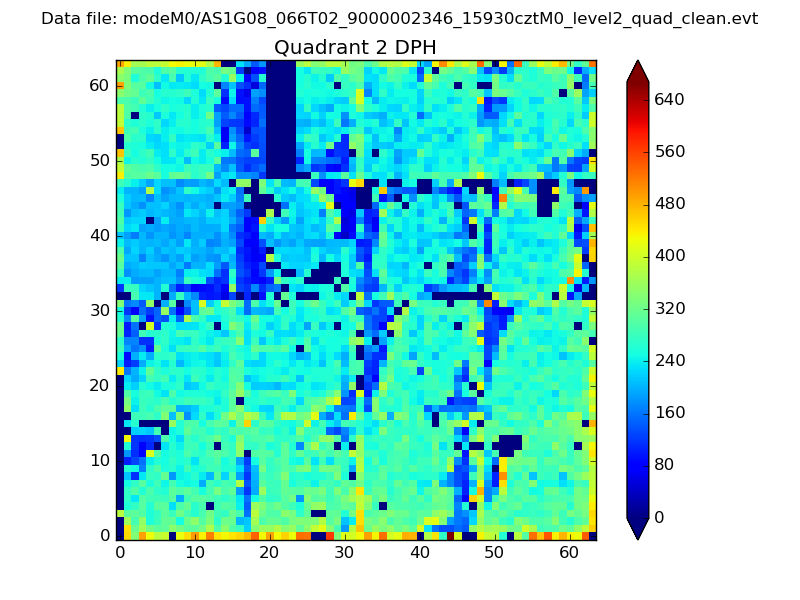
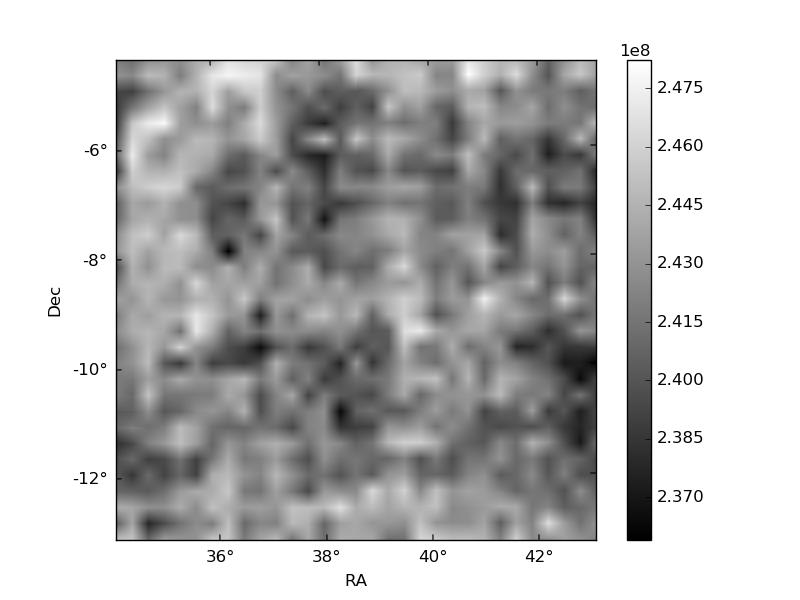
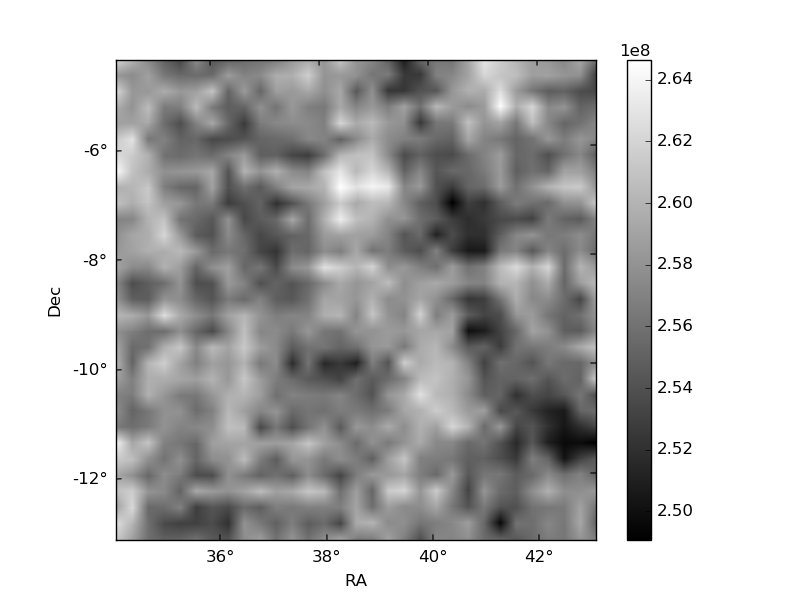
Histogram calculated using DETX and DETY for each event in the final _common_clean file
| Quadrant A | 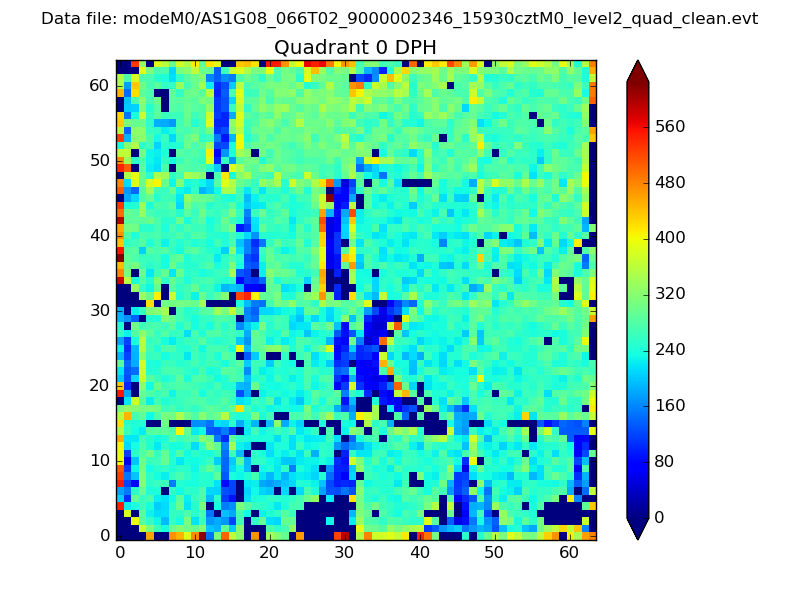 |
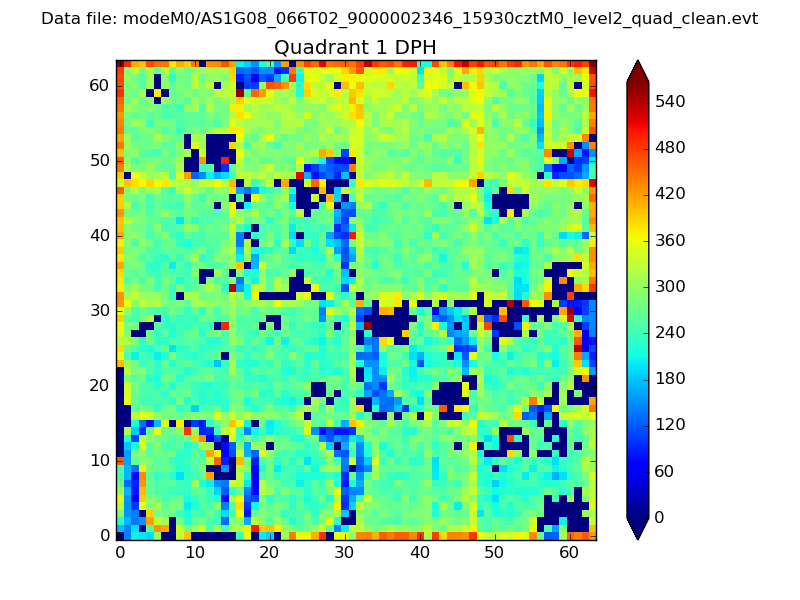 |
Quadrant B |
|---|---|---|---|
| Quadrant D | 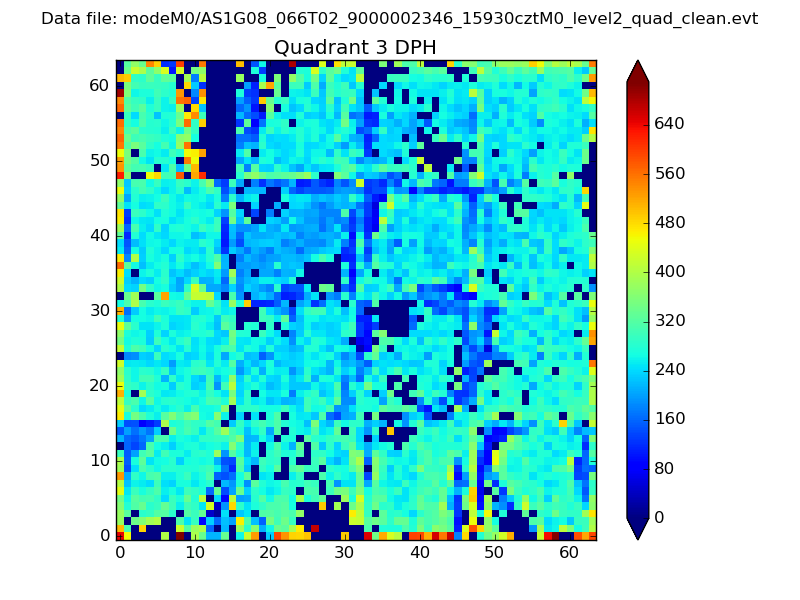 |
 |
Quadrant C |
| Plot type | Count rate plots | Images |
|---|---|---|
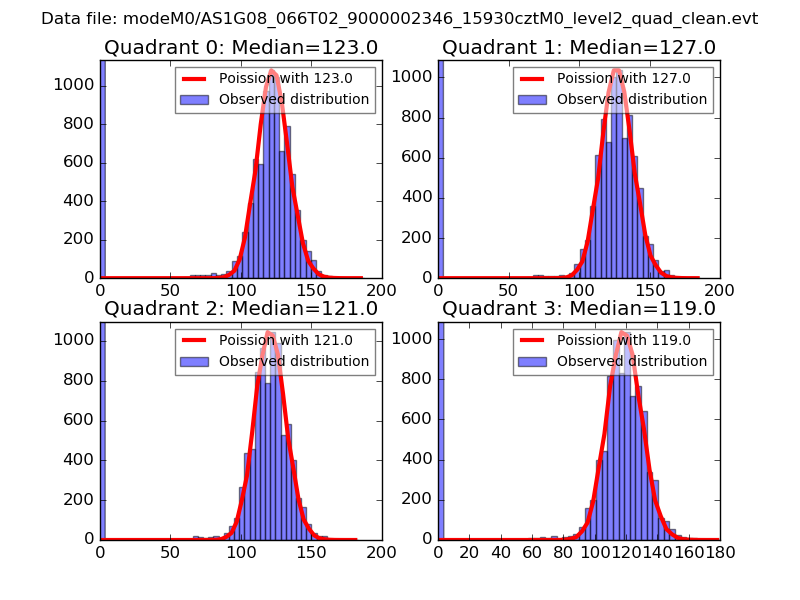
| Comparison with Poisson distribution Blue bars denote a histogram of data divided into 1 sec bins. Red curve is a Poisson curve with rate = median count rate of data. |
 |
 |
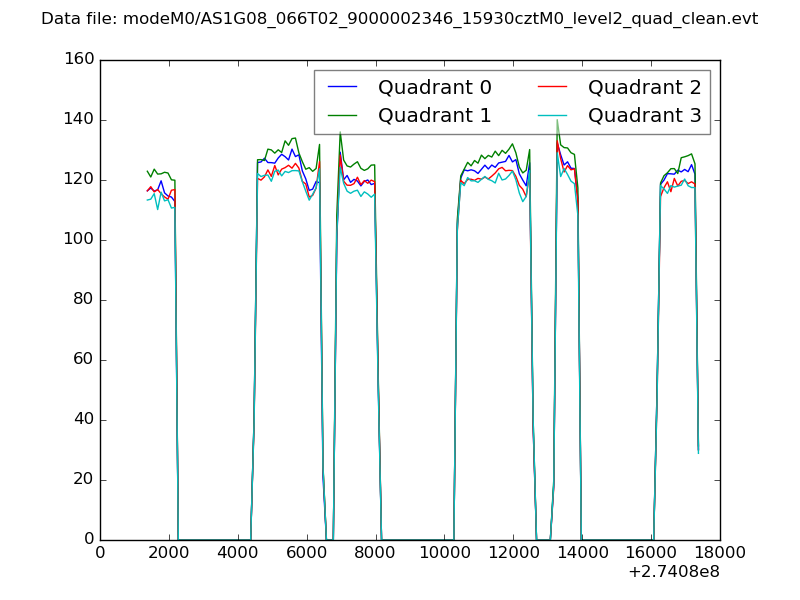
| Quadrant-wise count rates Data is divided into 100 sec bins |
 |
|
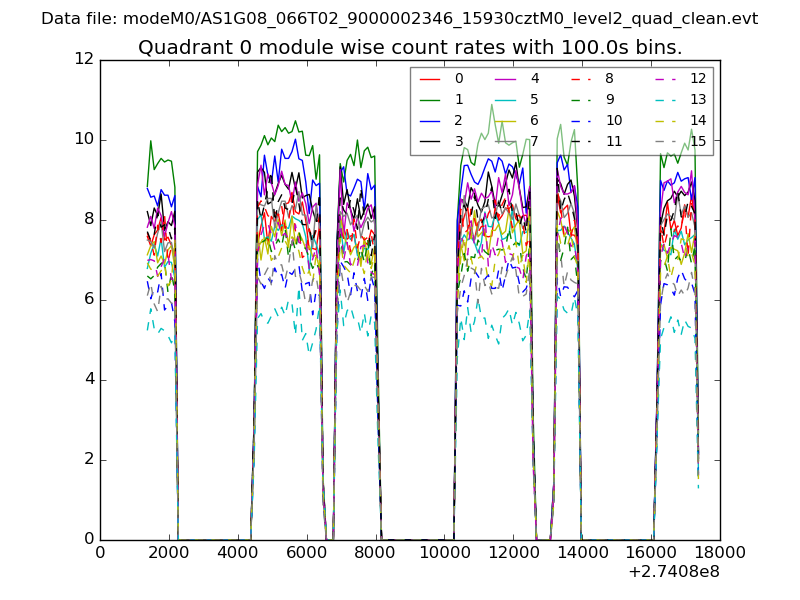
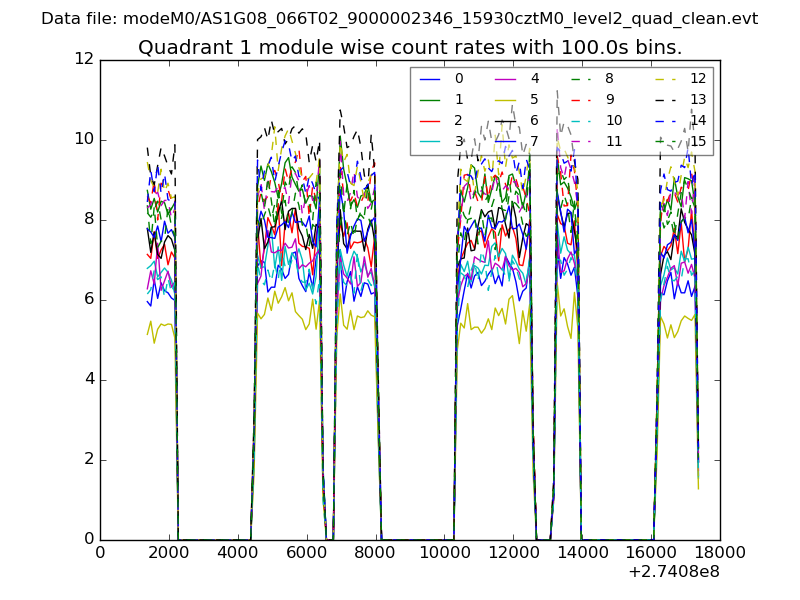
| Module-wise count rates for Quadrant A Data is divided into 100 sec bins |
 |
 |
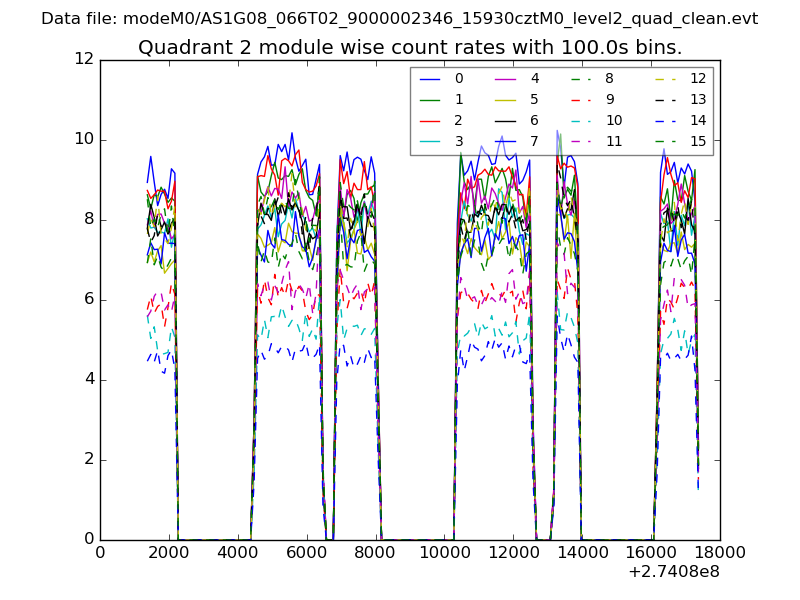
| Module-wise count rates for Quadrant B Data is divided into 100 sec bins |
 |
 |
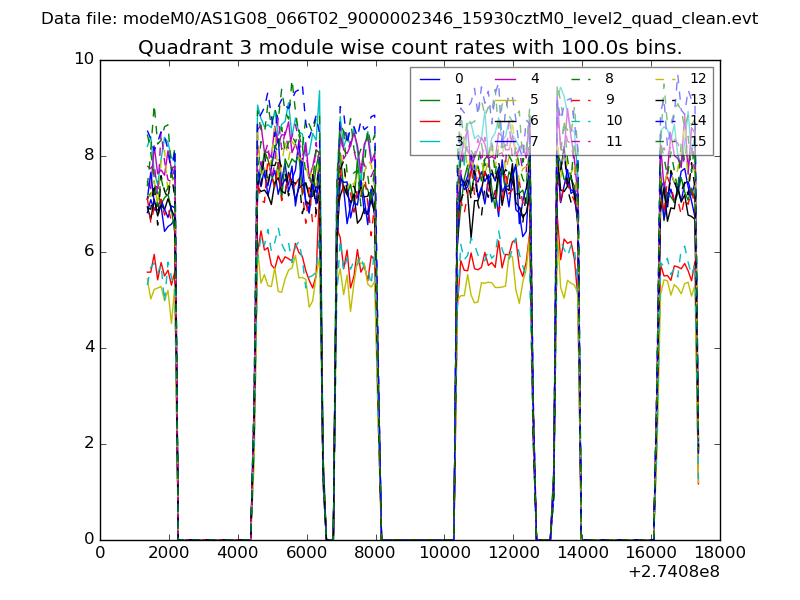
| Module-wise count rates for Quadrant C Data is divided into 100 sec bins |
 |
 |
| Module-wise count rates for Quadrant D Data is divided into 100 sec bins |
 |
 |
| Parameter | Plot |
|---|---|
| CZT HV Monitor | 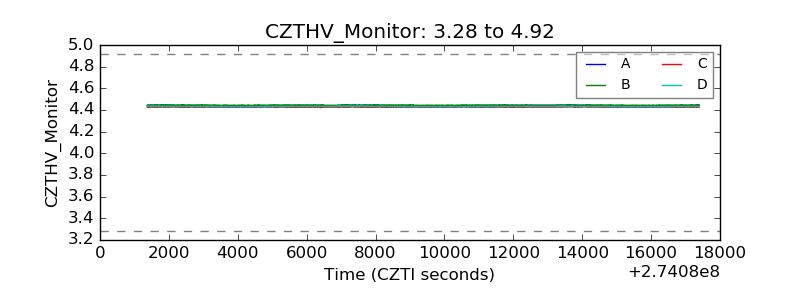 |
| D_VDD | 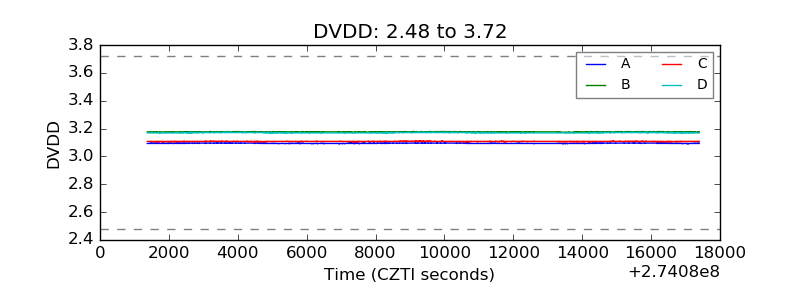 |
| Temperature 1 | 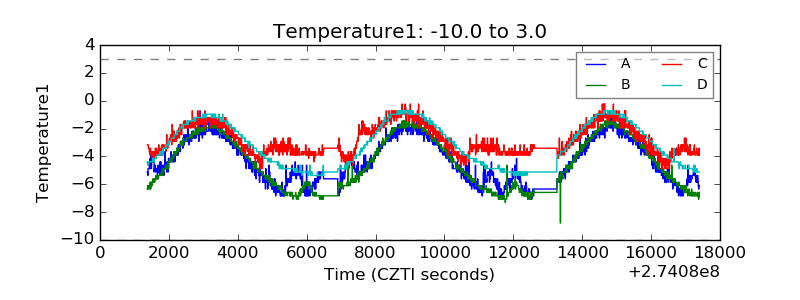 |
| Veto HV Monitor | 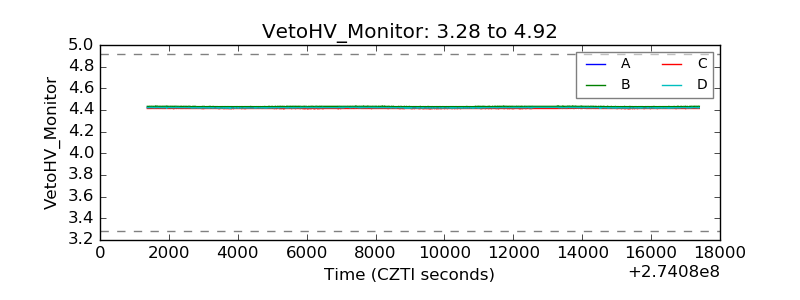 |
| Veto LLD | 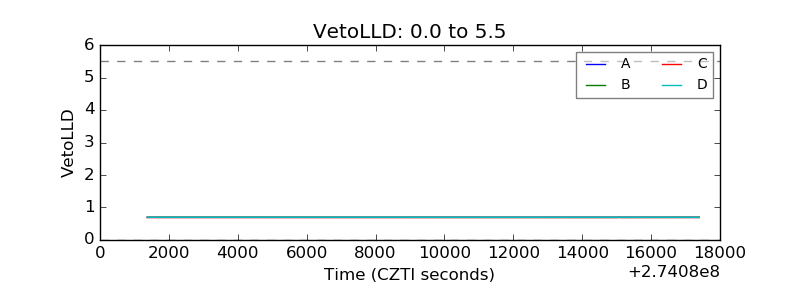 |
| Alpha Counter | 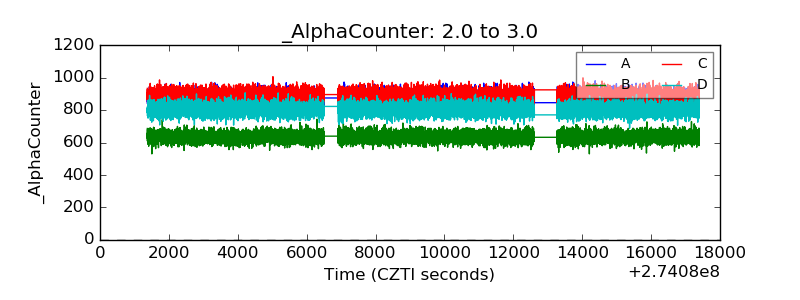 |
| _CPM_Rate | 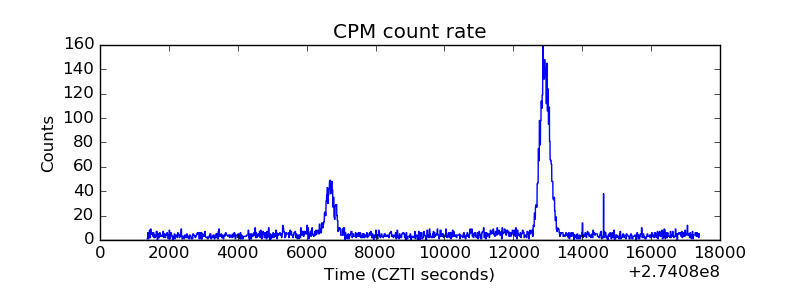 |
| CZT Counter | 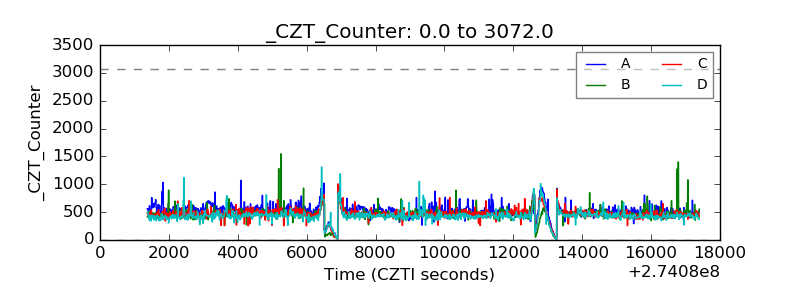 |
| +2.5 Volts monitor | 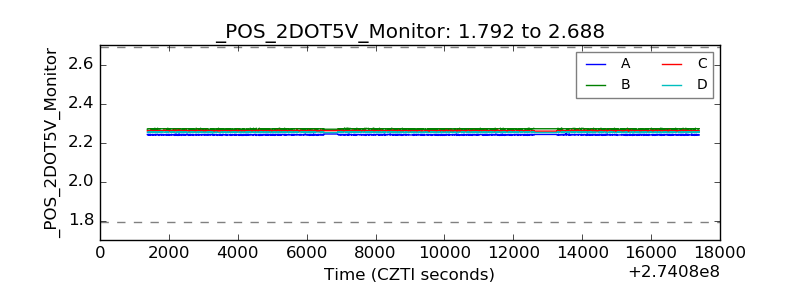 |
| +5 Volts monitor | 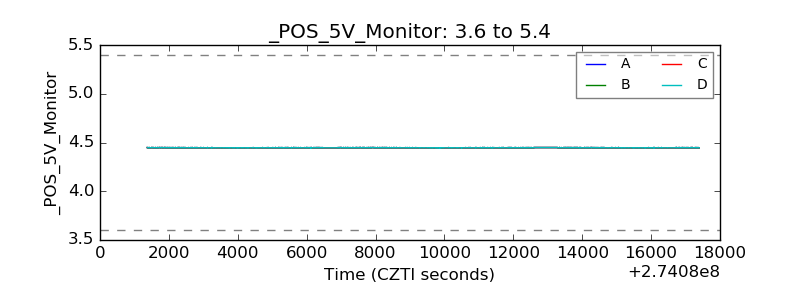 |
| _ROLL_ROT | 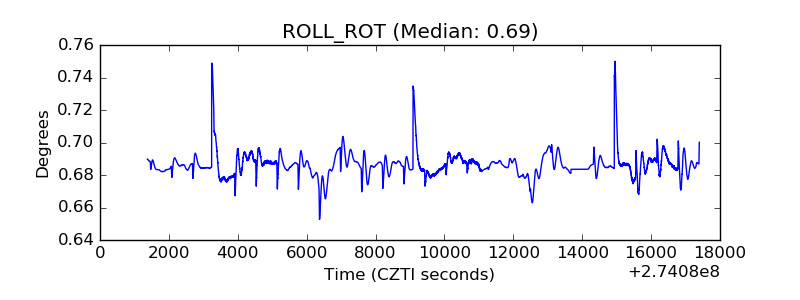 |
| _Roll_DEC | 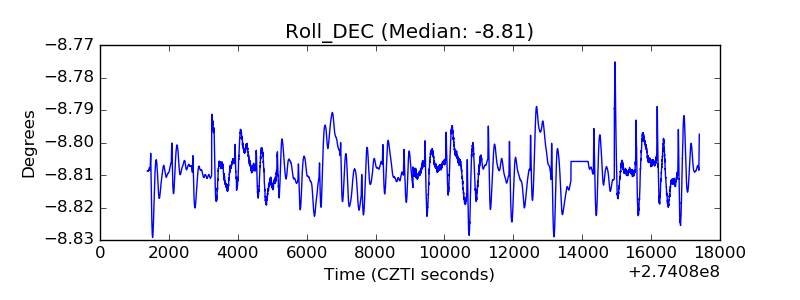 |
| _Roll_RA | 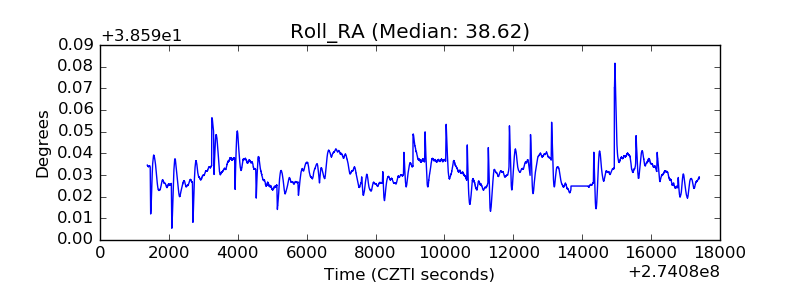 |
| Veto Counter | 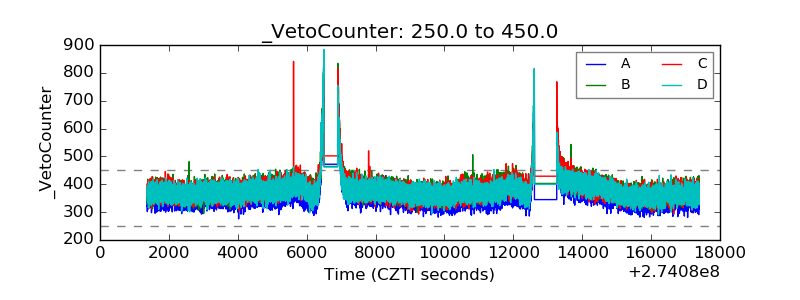 |