| Param | Original file | Final file |
|---|---|---|
| Filename | modeM0/AS1G08_081T01_9000002350cztM0_level2.fits | modeM0/AS1G08_081T01_9000002350cztM0_level2_quad_clean.evt |
| Size (bytes) | 626,109,120 | 501,782,400 |
| Size | 597.1 MB | 478.5 MB |
| Events in quadrant A | 3,835,540 | 2,805,756 |
| Events in quadrant B | 3,672,092 | 2,814,214 |
| Events in quadrant C | 3,748,924 | 2,678,493 |
| Events in quadrant D | 3,300,234 | 2,491,314 |
| Mode SS | |||
|---|---|---|---|
| Quadrant | BADHDUFLAG | Total packets | Discarded packets |
| A | 0 | 1306 | 0 |
| B | 0 | 1306 | 0 |
| C | 0 | 1306 | 0 |
| D | 0 | 1306 | 0 |
| Mode M0 | |||
|---|---|---|---|
| Quadrant | BADHDUFLAG | Total packets | Discarded packets |
| A | 0 | 136486 | 0 |
| B | 0 | 137922 | 0 |
| C | 0 | 134838 | 0 |
| D | 0 | 135629 | 0 |
| Mode M9 | |||
|---|---|---|---|
| Quadrant | BADHDUFLAG | Total packets | Discarded packets |
| A | 0 | 113 | 0 |
| B | 0 | 113 | 0 |
| C | 0 | 113 | 0 |
| D | 0 | 113 | 0 |
| Quadrant | Total seconds | Saturated seconds | Saturation percentage |
|---|---|---|---|
| A | 64238 | 803 | 1.250039% |
| B | 64238 | 983 | 1.530247% |
| C | 64238 | 1052 | 1.637660% |
| D | 64238 | 586 | 0.912233% |
Noise dominated data is calculated using 1-second bins in cleaned event files. If a bin has >2000 counts, and if more than 50% of those come from <1% of pixels, then it is considered to be noise-dominated and hence unusable.
| Quadrant | # 1 sec bins | Bins with >0 counts | Bins with >2000 counts | High rate bins dominated by noise | Noise dominated (total time) | Noise dominated (detector-on time) | Marked lightcurve |
|---|---|---|---|---|---|---|---|
| A | 75448 | 64234 | 0 | 0 | 0.00% | 0.00% |  |
| B | 75448 | 64230 | 0 | 0 | 0.00% | 0.00% |  |
| C | 75448 | 64231 | 0 | 0 | 0.00% | 0.00% |  |
| D | 75448 | 64232 | 0 | 0 | 0.00% | 0.00% |  |
Top three noisy pixels from each quadrant. If the there are fewer than three noisy pixels in the level2.evt file, extra rows are filled as -1
| Pixel properties | Quadrant properties | ||||||
|---|---|---|---|---|---|---|---|
| Quadrant | DetID | PixID | Counts | Sigma | Mean | Median | Sigma |
| A | 0 | 29 | 3722 | 11.26 | 997 | 935 | 247.5 |
| A | 7 | 110 | 3041 | 8.51 | 997 | 935 | 247.5 |
| A | 0 | 30 | 2863 | 7.79 | 997 | 935 | 247.5 |
| B | 2 | 9 | 2958 | 10.57 | 971 | 927 | 192.1 |
| B | 2 | 8 | 2493 | 8.15 | 971 | 927 | 192.1 |
| B | 3 | 17 | 2445 | 7.9 | 971 | 927 | 192.1 |
| C | 1 | 80 | 2842 | 7.52 | 990 | 925 | 254.7 |
| C | 1 | 81 | 2834 | 7.49 | 990 | 925 | 254.7 |
| C | 12 | 241 | 2538 | 6.33 | 990 | 925 | 254.7 |
| D | 3 | 14 | 2399 | 6.17 | 940 | 856 | 250.0 |
| D | 6 | 231 | 2395 | 6.16 | 940 | 856 | 250.0 |
| D | 3 | 31 | 2300 | 5.78 | 940 | 856 | 250.0 |
Histogram calculated using DETX and DETY for each event in the final _common_clean file
| Quadrant A | 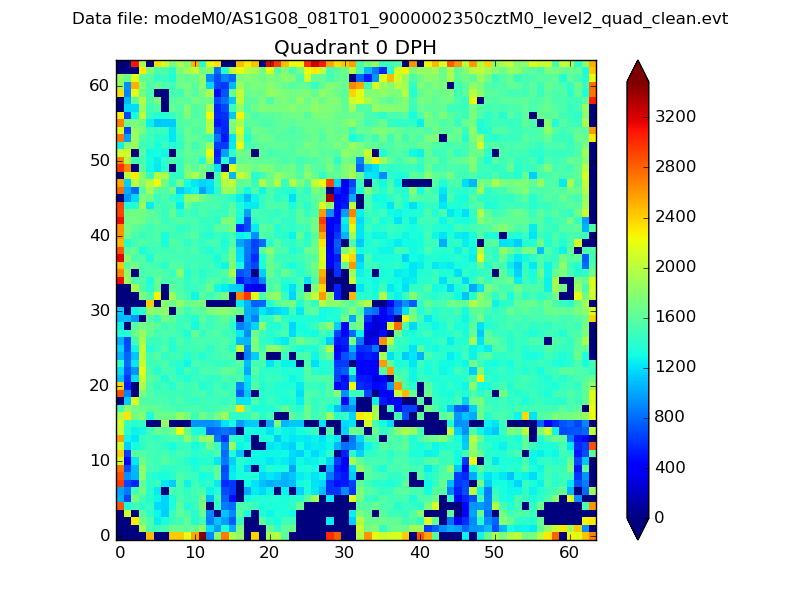 |
 |
Quadrant B |
|---|---|---|---|
| Quadrant D | 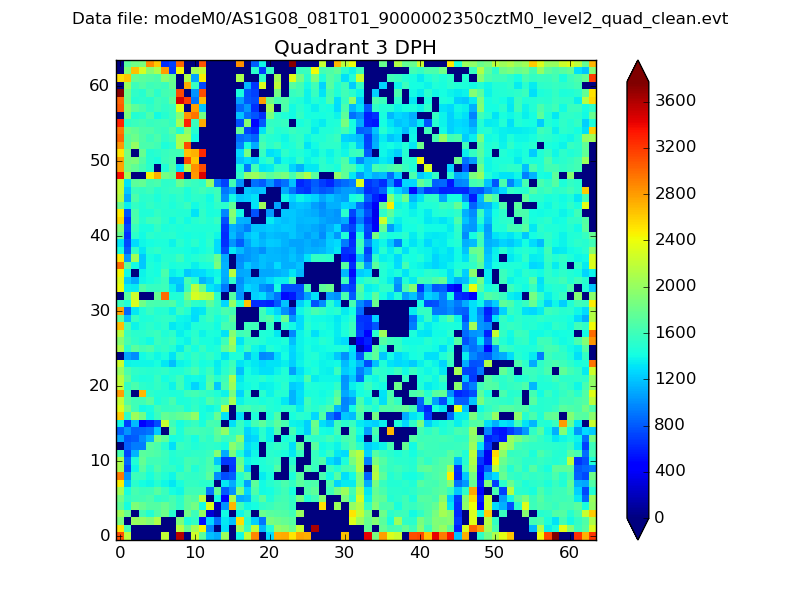 |
 |
Quadrant C |
| Plot type | Count rate plots | Images |
|---|---|---|
| Comparison with Poisson distribution Blue bars denote a histogram of data divided into 1 sec bins. Red curve is a Poisson curve with rate = median count rate of data. |
 |
 |
| Quadrant-wise count rates Data is divided into 100 sec bins |
 |
|
| Module-wise count rates for Quadrant A Data is divided into 100 sec bins |
 |
 |
| Module-wise count rates for Quadrant B Data is divided into 100 sec bins |
 |
 |
| Module-wise count rates for Quadrant C Data is divided into 100 sec bins |
 |
 |
| Module-wise count rates for Quadrant D Data is divided into 100 sec bins |
 |
 |
| Parameter | Plot |
|---|---|
| CZT HV Monitor |  |
| D_VDD |  |
| Temperature 1 |  |
| Veto HV Monitor |  |
| Veto LLD |  |
| Alpha Counter |  |
| _CPM_Rate |  |
| CZT Counter |  |
| +2.5 Volts monitor |  |
| +5 Volts monitor |  |
| _ROLL_ROT |  |
| _Roll_DEC |  |
| _Roll_RA |  |
| Veto Counter |  |