| Param | Original file | Final file |
|---|---|---|
| Filename | modeM0/AS1G08_081T01_9000002350_15945cztM0_level2.evt | modeM0/AS1G08_081T01_9000002350_15945cztM0_level2_quad_clean.evt |
| Size (bytes) | 457,418,880 | 83,943,360 |
| Size | 436.2 MB | 80.1 MB |
| Events in quadrant A | 3,325,131 | 523,532 |
| Events in quadrant B | 3,598,846 | 532,839 |
| Events in quadrant C | 3,331,419 | 506,707 |
| Events in quadrant D | 3,127,630 | 497,344 |
| Mode SS | |||
|---|---|---|---|
| Quadrant | BADHDUFLAG | Total packets | Discarded packets |
| A | 0 | 140 | 0 |
| B | 0 | 140 | 0 |
| C | 0 | 140 | 0 |
| D | 0 | 140 | 0 |
| Mode M0 | |||
|---|---|---|---|
| Quadrant | BADHDUFLAG | Total packets | Discarded packets |
| A | 0 | 14307 | 3 |
| B | 0 | 14969 | 2 |
| C | 0 | 14118 | 2 |
| D | 0 | 14096 | 2 |
| Mode M9 | |||
|---|---|---|---|
| Quadrant | BADHDUFLAG | Total packets | Discarded packets |
| A | 0 | 14 | 0 |
| B | 0 | 14 | 0 |
| C | 0 | 14 | 0 |
| D | 0 | 15 | 0 |
| Quadrant | Total seconds | Saturated seconds | Saturation percentage |
|---|---|---|---|
| A | 6912 | 87 | 1.258681% |
| B | 6912 | 183 | 2.647569% |
| C | 6912 | 112 | 1.620370% |
| D | 6912 | 66 | 0.954861% |
Noise dominated data is calculated using 1-second bins in cleaned event files. If a bin has >2000 counts, and if more than 50% of those come from <1% of pixels, then it is considered to be noise-dominated and hence unusable.
| Quadrant | # 1 sec bins | Bins with >0 counts | Bins with >2000 counts | High rate bins dominated by noise | Noise dominated (total time) | Noise dominated (detector-on time) | Marked lightcurve |
|---|---|---|---|---|---|---|---|
| A | 7793 | 6913 | 7 | 7 | 0.09% | 0.10% | 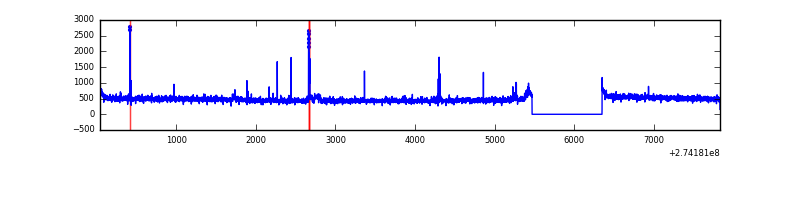 |
| B | 7793 | 6913 | 36 | 36 | 0.46% | 0.52% | 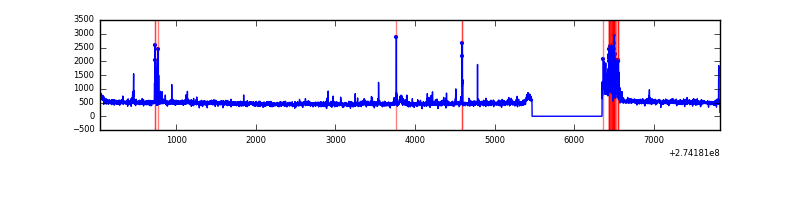 |
| C | 7793 | 6913 | 0 | 0 | 0.00% | 0.00% | 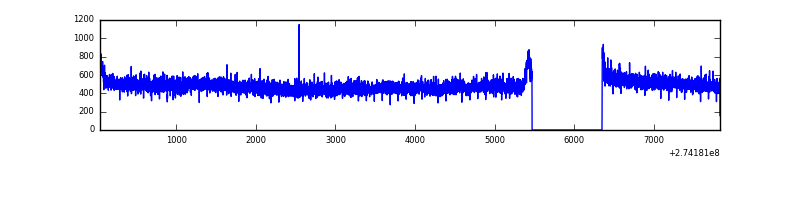 |
| D | 7793 | 6913 | 2 | 2 | 0.03% | 0.03% | 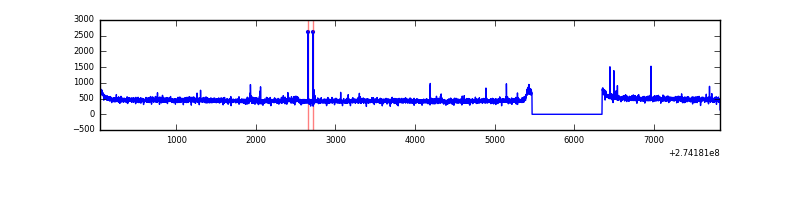 |
Top three noisy pixels from each quadrant. If the there are fewer than three noisy pixels in the level2.evt file, extra rows are filled as -1
| Pixel properties | Quadrant properties | ||||||
|---|---|---|---|---|---|---|---|
| Quadrant | DetID | PixID | Counts | Sigma | Mean | Median | Sigma |
| A | 15 | 239 | 78523 | 455.7 | 841 | 821 | 170.5 |
| A | 9 | 143 | 7728 | 40.51 | 841 | 821 | 170.5 |
| A | 0 | 226 | 7574 | 39.6 | 841 | 821 | 170.5 |
| B | 4 | 173 | 239498 | 1477.67 | 838 | 815 | 161.5 |
| B | 0 | 189 | 28653 | 172.34 | 838 | 815 | 161.5 |
| B | 12 | 111 | 19137 | 113.43 | 838 | 815 | 161.5 |
| C | 14 | 238 | 124796 | 658.33 | 803 | 807 | 188.3 |
| C | 3 | 233 | 74020 | 388.73 | 803 | 807 | 188.3 |
| C | 13 | 61 | 5762 | 26.31 | 803 | 807 | 188.3 |
| D | 2 | 234 | 26877 | 131.87 | 815 | 791 | 197.8 |
| D | 2 | 152 | 19806 | 96.13 | 815 | 791 | 197.8 |
| D | 14 | 226 | 8135 | 37.13 | 815 | 791 | 197.8 |
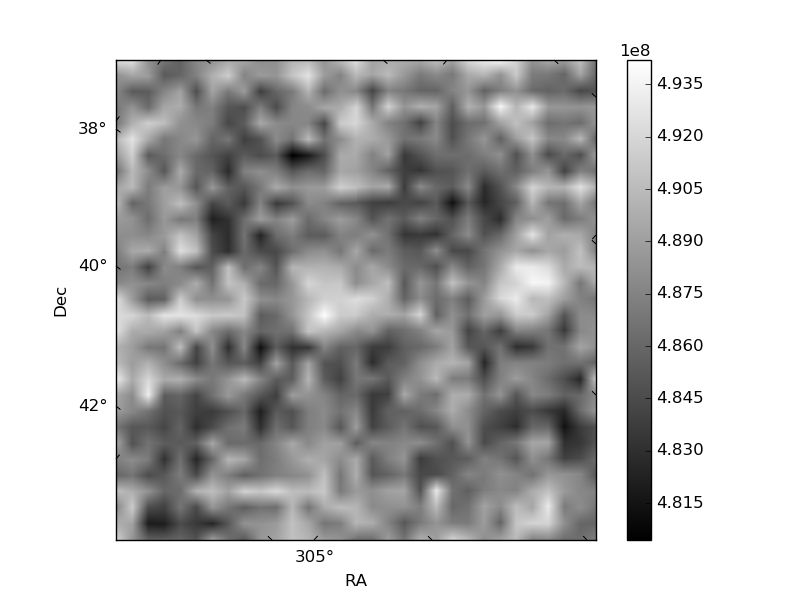
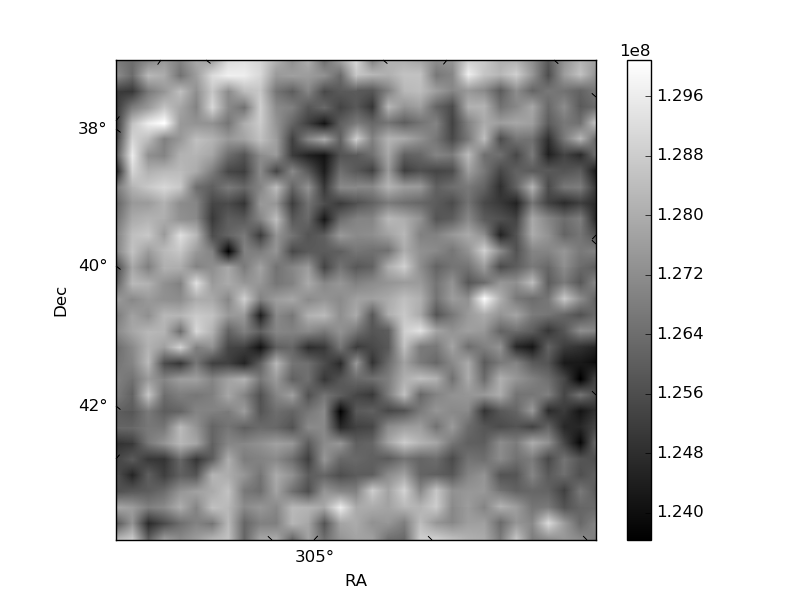
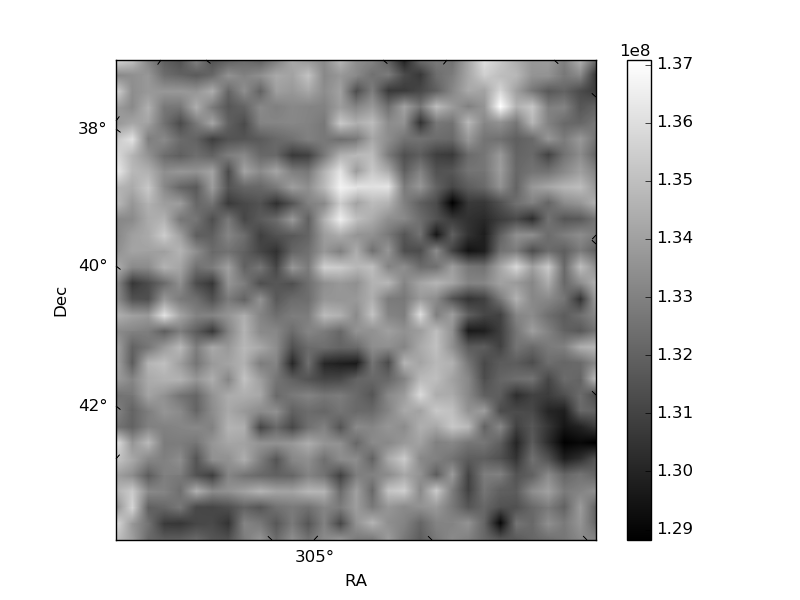
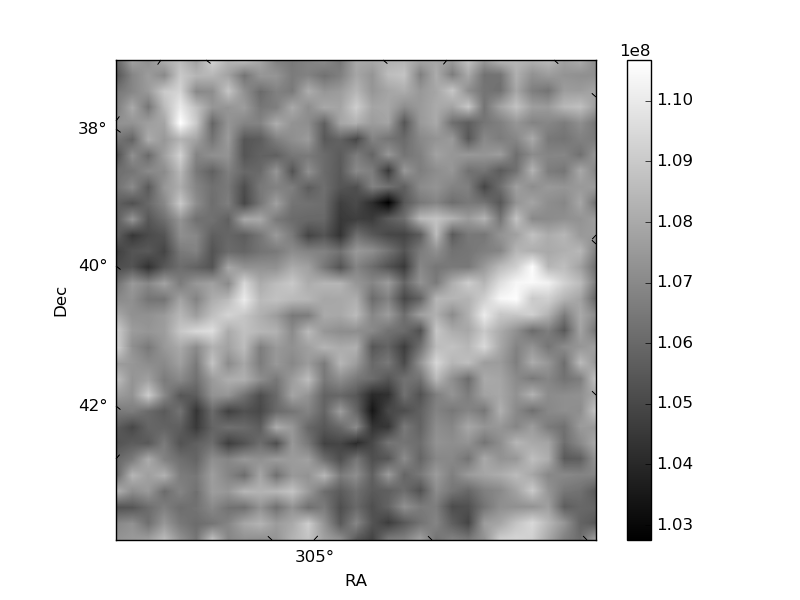
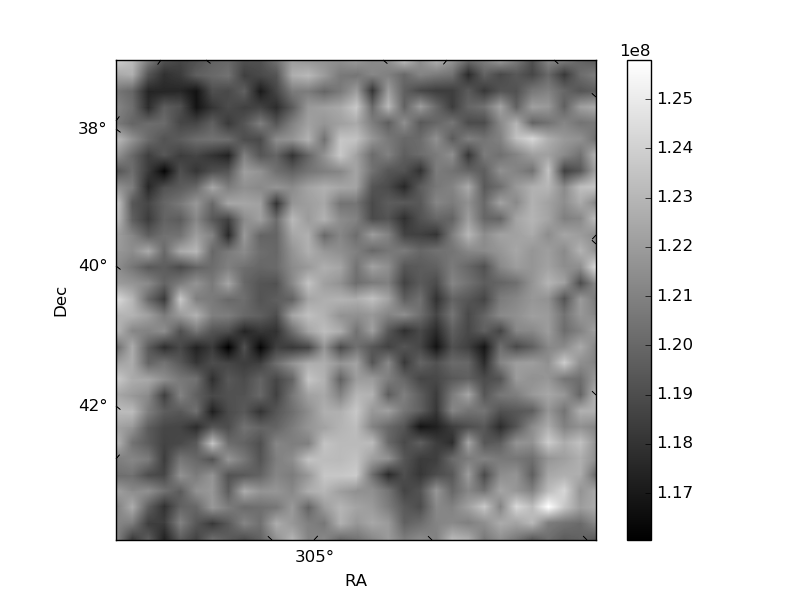
Histogram calculated using DETX and DETY for each event in the final _common_clean file
| Quadrant A | 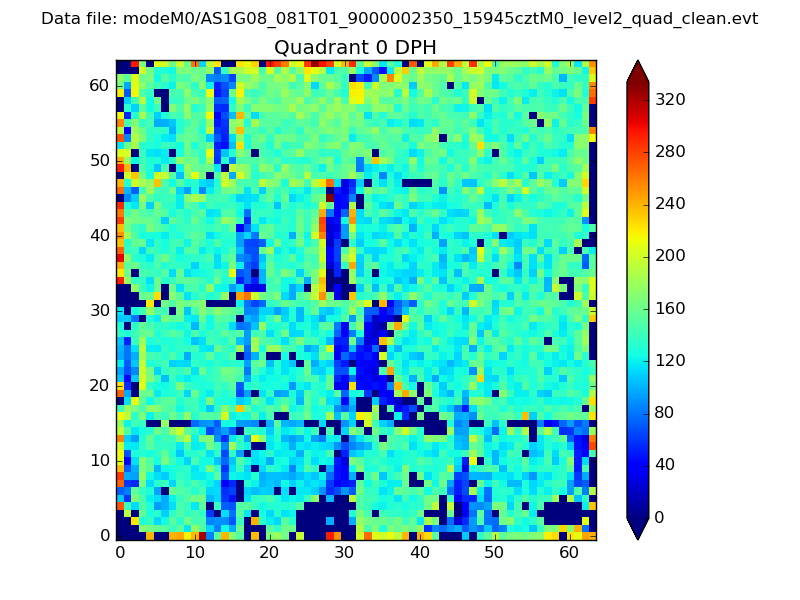 |
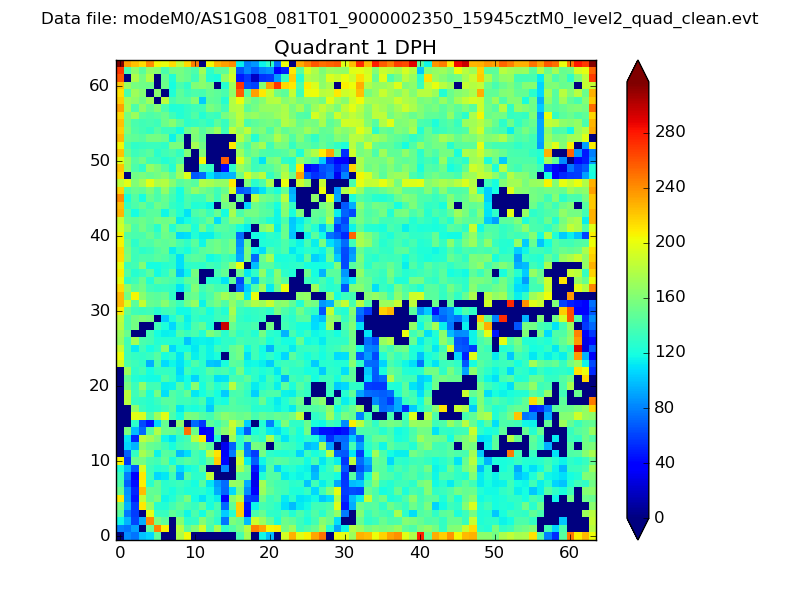 |
Quadrant B |
|---|---|---|---|
| Quadrant D | 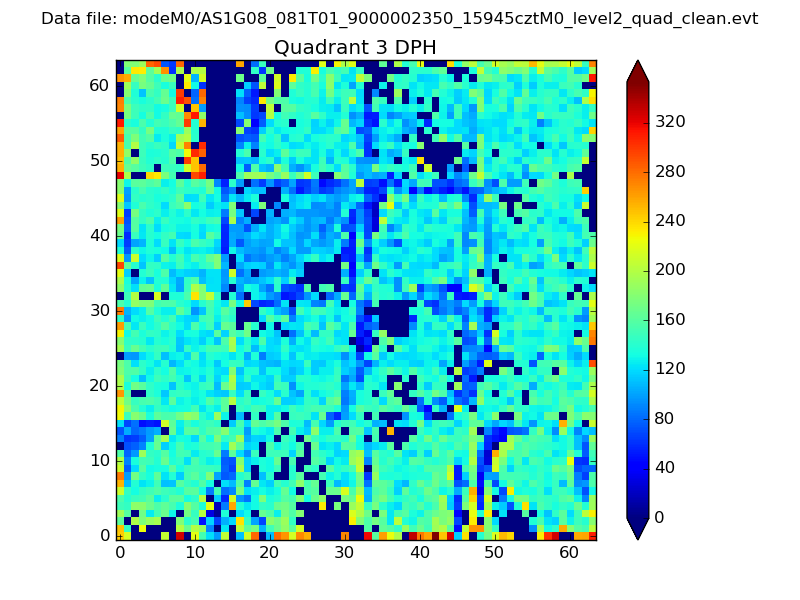 |
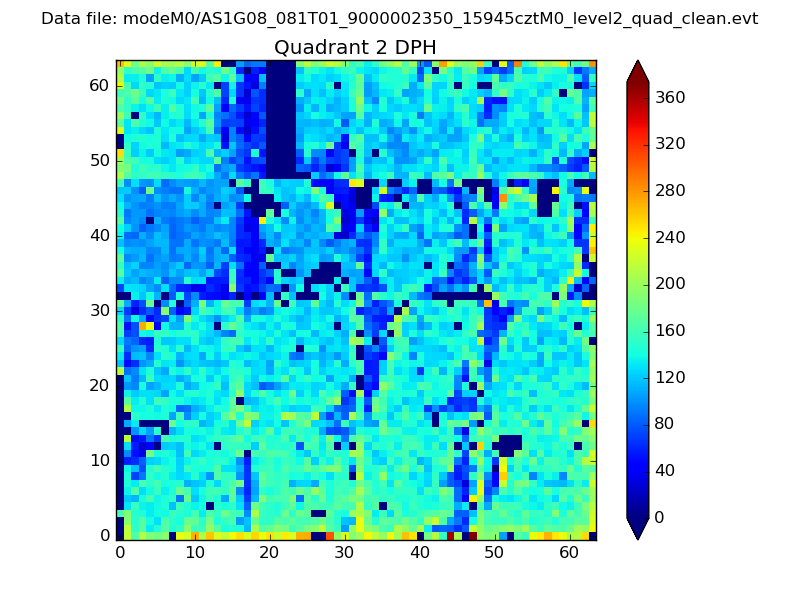 |
Quadrant C |
| Plot type | Count rate plots | Images |
|---|---|---|
| Comparison with Poisson distribution Blue bars denote a histogram of data divided into 1 sec bins. Red curve is a Poisson curve with rate = median count rate of data. |
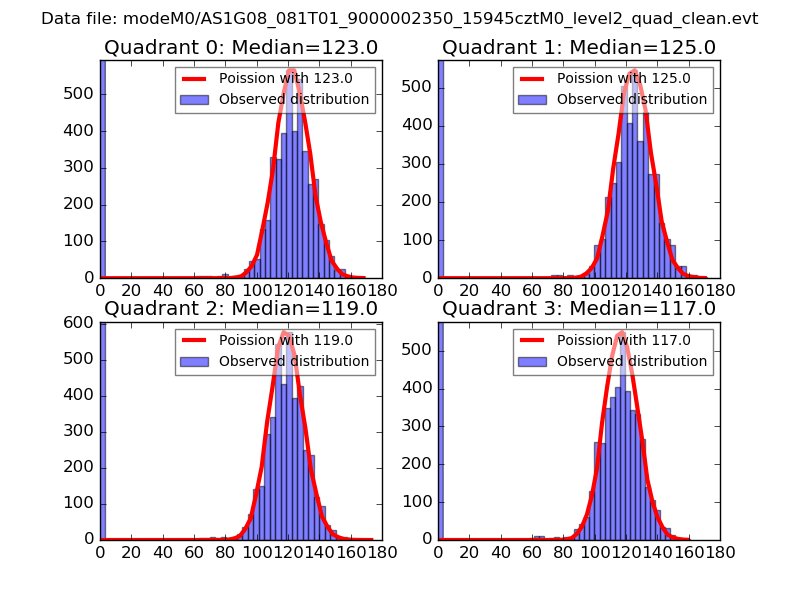 |
 |
| Quadrant-wise count rates Data is divided into 100 sec bins |
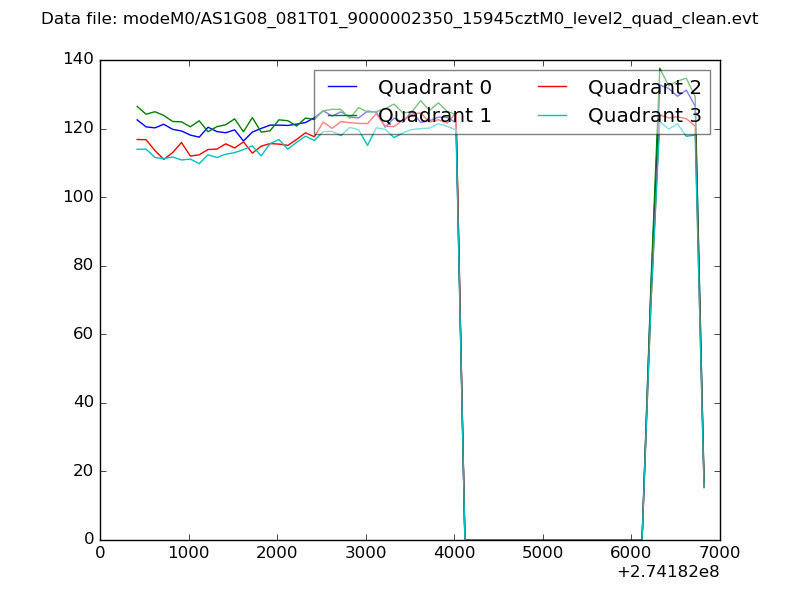 |
|
| Module-wise count rates for Quadrant A Data is divided into 100 sec bins |
 |
 |
| Module-wise count rates for Quadrant B Data is divided into 100 sec bins |
 |
 |
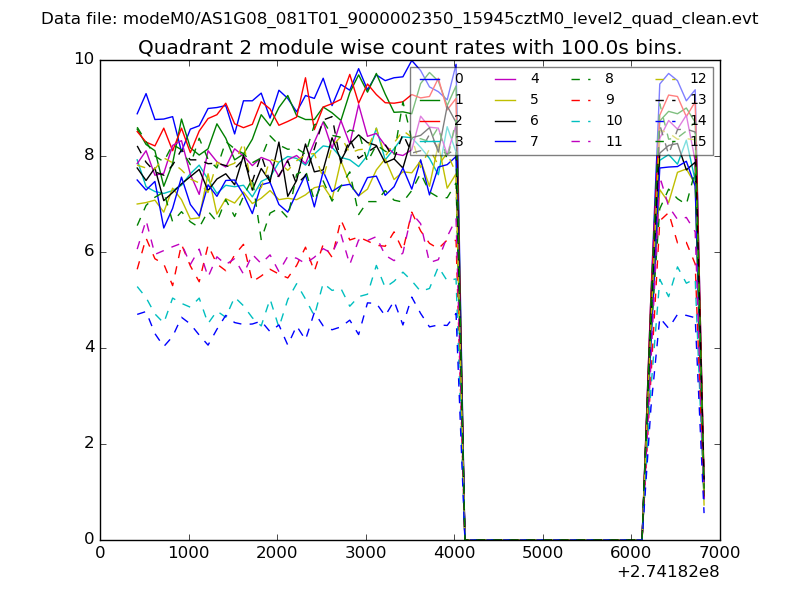
| Module-wise count rates for Quadrant C Data is divided into 100 sec bins |
 |
 |
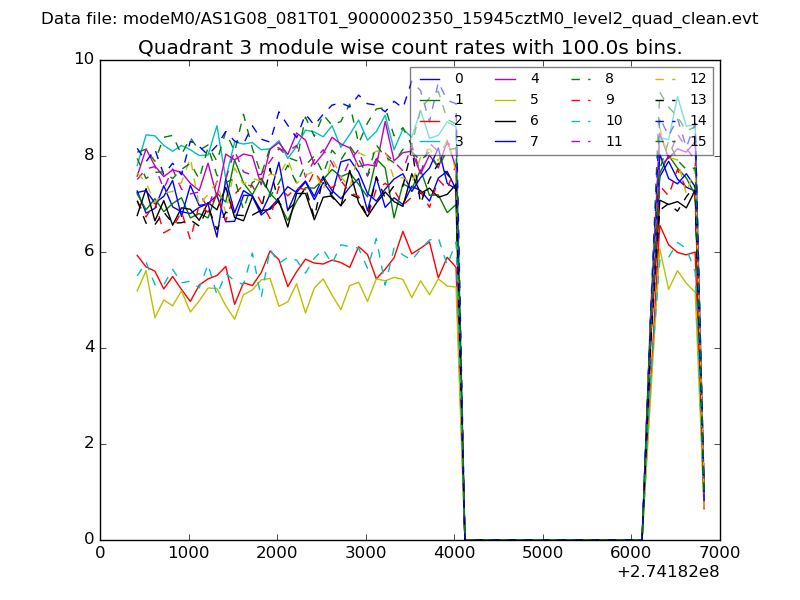
| Module-wise count rates for Quadrant D Data is divided into 100 sec bins |
 |
 |
| Parameter | Plot |
|---|---|
| CZT HV Monitor |  |
| D_VDD | 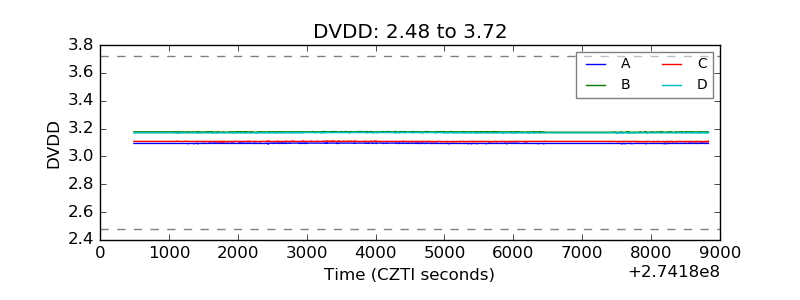 |
| Temperature 1 | 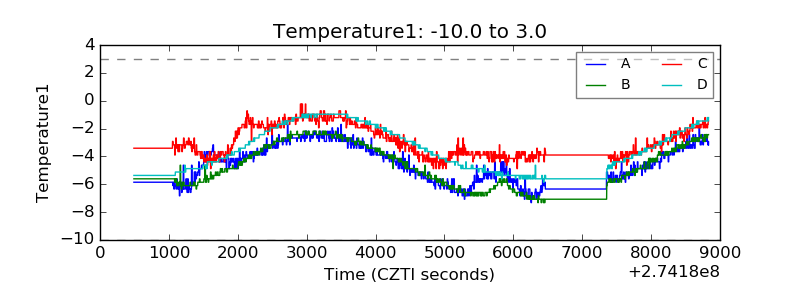 |
| Veto HV Monitor | 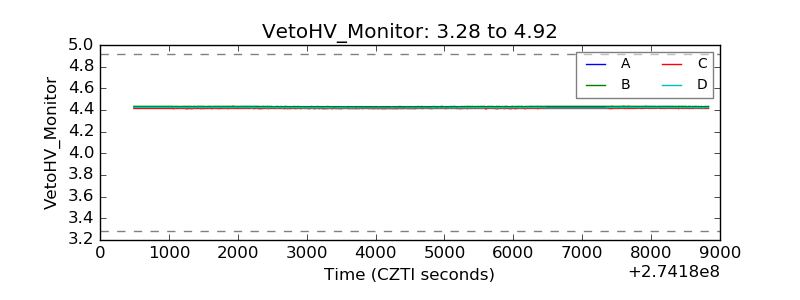 |
| Veto LLD | 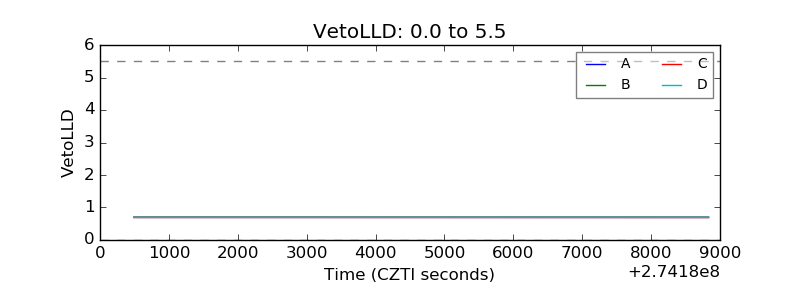 |
| Alpha Counter | 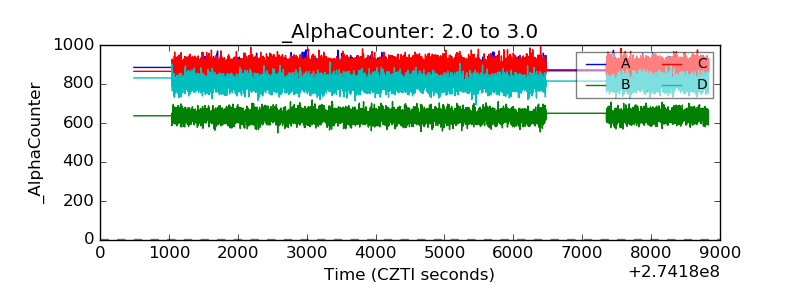 |
| _CPM_Rate | 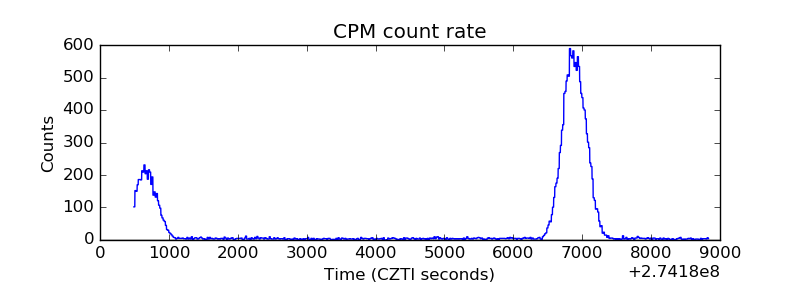 |
| CZT Counter | 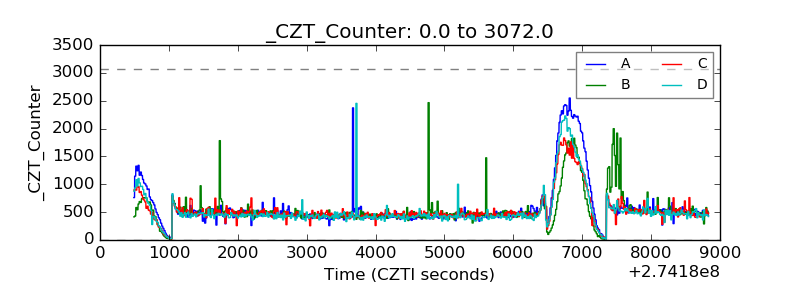 |
| +2.5 Volts monitor |  |
| +5 Volts monitor | 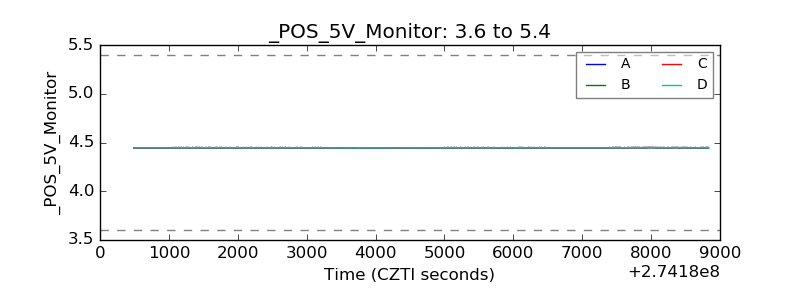 |
| _ROLL_ROT | 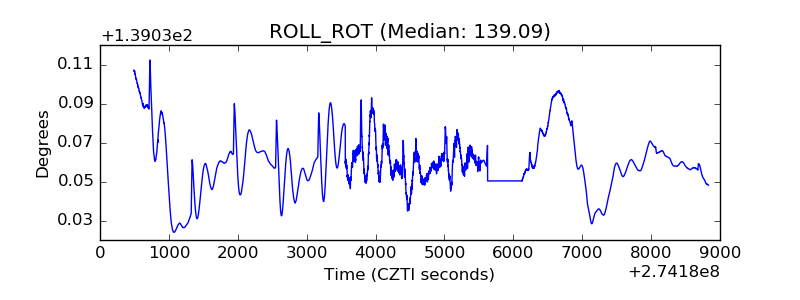 |
| _Roll_DEC | 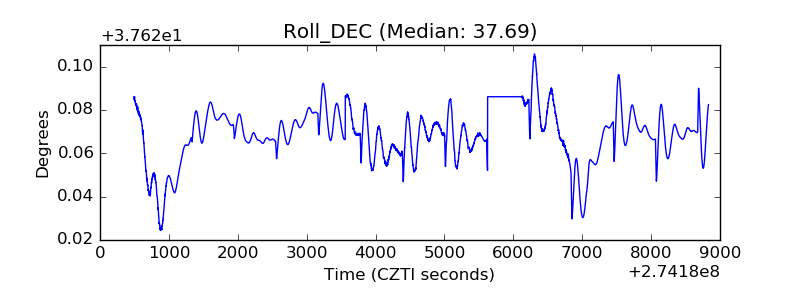 |
| _Roll_RA | 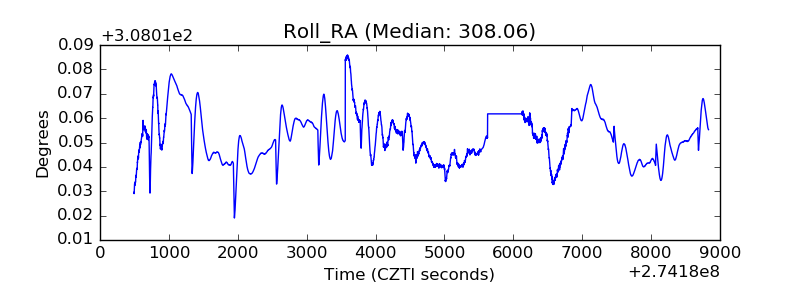 |
| Veto Counter | 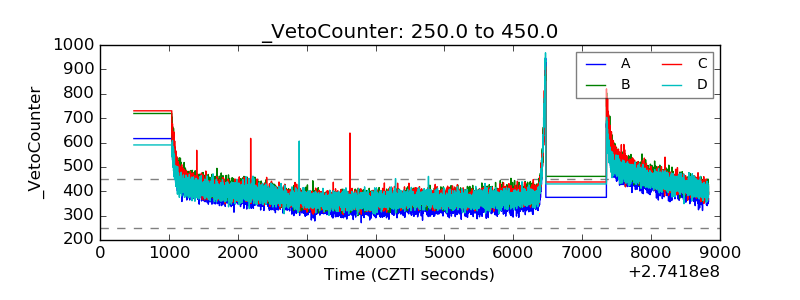 |