| Param | Original file | Final file |
|---|---|---|
| Filename | modeM0/AS1G08_081T01_9000002350_15948cztM0_level2.evt | modeM0/AS1G08_081T01_9000002350_15948cztM0_level2_quad_clean.evt |
| Size (bytes) | 415,912,320 | 104,797,440 |
| Size | 396.6 MB | 99.9 MB |
| Events in quadrant A | 3,052,209 | 701,556 |
| Events in quadrant B | 3,138,681 | 708,296 |
| Events in quadrant C | 3,039,446 | 673,552 |
| Events in quadrant D | 2,950,651 | 664,561 |
| Mode SS | |||
|---|---|---|---|
| Quadrant | BADHDUFLAG | Total packets | Discarded packets |
| A | 0 | 124 | 0 |
| B | 0 | 124 | 0 |
| C | 0 | 124 | 0 |
| D | 0 | 124 | 0 |
| Mode M0 | |||
|---|---|---|---|
| Quadrant | BADHDUFLAG | Total packets | Discarded packets |
| A | 0 | 13111 | 2 |
| B | 0 | 13209 | 1 |
| C | 0 | 12937 | 1 |
| D | 0 | 12880 | 1 |
| Mode M9 | |||
|---|---|---|---|
| Quadrant | BADHDUFLAG | Total packets | Discarded packets |
| A | 0 | 12 | 0 |
| B | 0 | 12 | 0 |
| C | 0 | 12 | 0 |
| D | 0 | 12 | 0 |
| Quadrant | Total seconds | Saturated seconds | Saturation percentage |
|---|---|---|---|
| A | 6102 | 53 | 0.868568% |
| B | 6102 | 59 | 0.966896% |
| C | 6102 | 76 | 1.245493% |
| D | 6102 | 41 | 0.671911% |
Noise dominated data is calculated using 1-second bins in cleaned event files. If a bin has >2000 counts, and if more than 50% of those come from <1% of pixels, then it is considered to be noise-dominated and hence unusable.
| Quadrant | # 1 sec bins | Bins with >0 counts | Bins with >2000 counts | High rate bins dominated by noise | Noise dominated (total time) | Noise dominated (detector-on time) | Marked lightcurve |
|---|---|---|---|---|---|---|---|
| A | 7303 | 6103 | 2 | 2 | 0.03% | 0.03% | 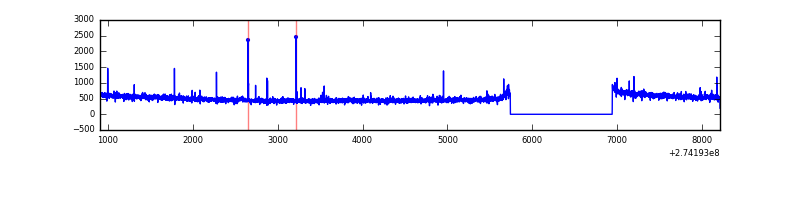 |
| B | 7303 | 6103 | 5 | 5 | 0.07% | 0.08% | 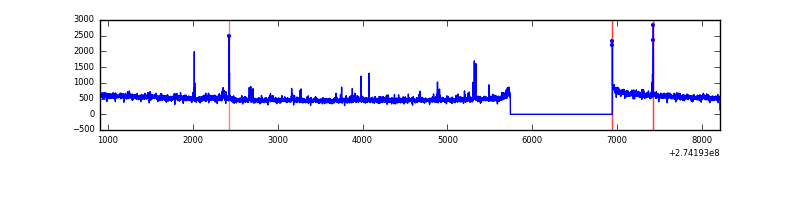 |
| C | 7303 | 6103 | 0 | 0 | 0.00% | 0.00% | 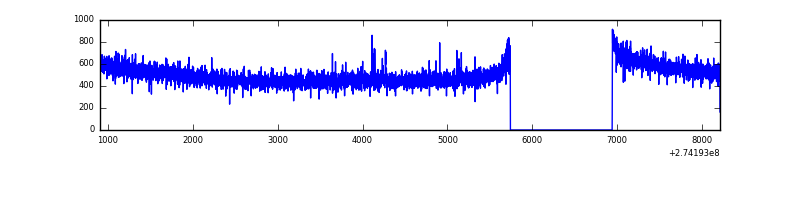 |
| D | 7303 | 6103 | 4 | 4 | 0.05% | 0.07% | 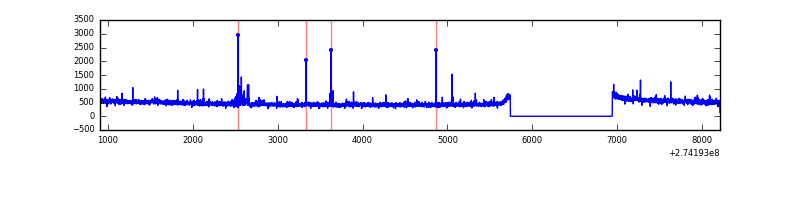 |
Top three noisy pixels from each quadrant. If the there are fewer than three noisy pixels in the level2.evt file, extra rows are filled as -1
| Pixel properties | Quadrant properties | ||||||
|---|---|---|---|---|---|---|---|
| Quadrant | DetID | PixID | Counts | Sigma | Mean | Median | Sigma |
| A | 15 | 239 | 34613 | 215.58 | 777 | 760 | 157.0 |
| A | 13 | 210 | 25877 | 159.95 | 777 | 760 | 157.0 |
| A | 0 | 226 | 6837 | 38.7 | 777 | 760 | 157.0 |
| B | 0 | 189 | 55646 | 379.2 | 768 | 750 | 144.8 |
| B | 4 | 173 | 22969 | 153.48 | 768 | 750 | 144.8 |
| B | 12 | 111 | 16702 | 110.19 | 768 | 750 | 144.8 |
| C | 14 | 238 | 115210 | 666.21 | 743 | 748 | 171.8 |
| C | 0 | 207 | 15328 | 84.86 | 743 | 748 | 171.8 |
| C | 3 | 233 | 11721 | 63.87 | 743 | 748 | 171.8 |
| D | 2 | 234 | 30603 | 162.19 | 758 | 739 | 184.1 |
| D | 2 | 152 | 26910 | 142.13 | 758 | 739 | 184.1 |
| D | 4 | 239 | 22735 | 119.46 | 758 | 739 | 184.1 |
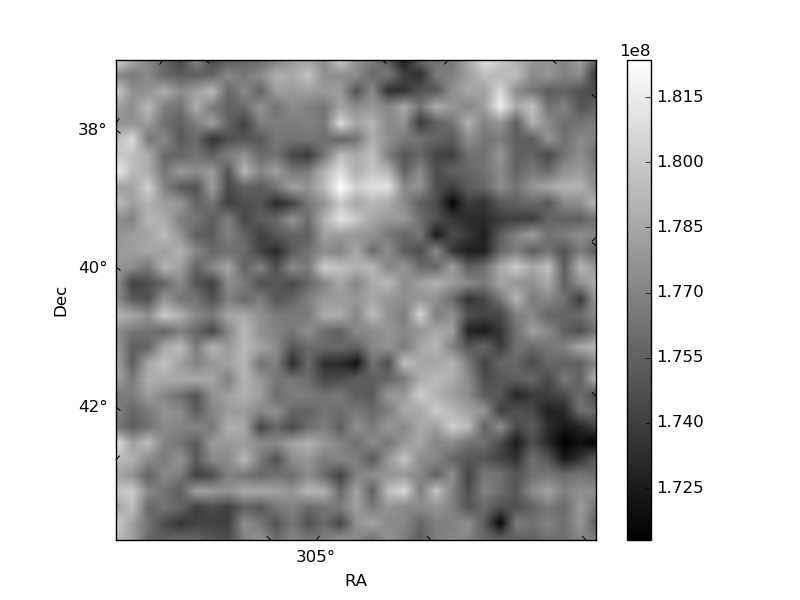
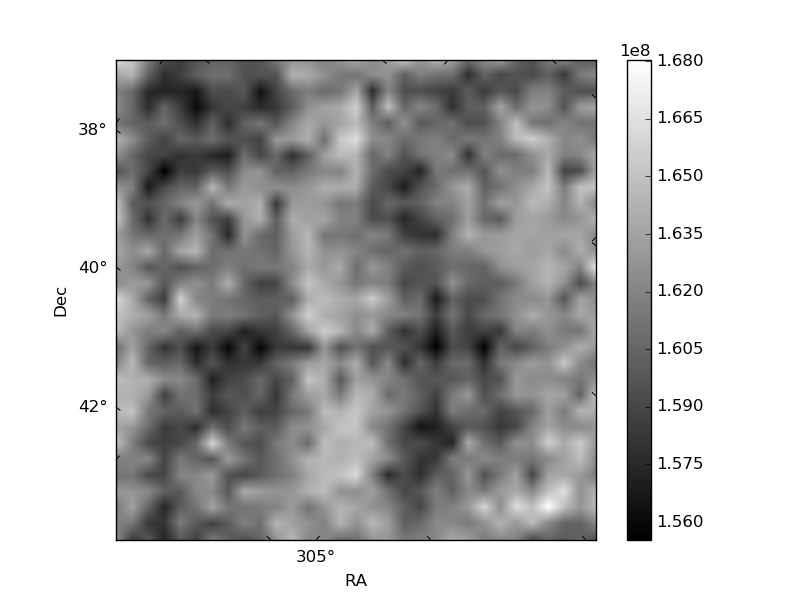
Histogram calculated using DETX and DETY for each event in the final _common_clean file
| Quadrant A | 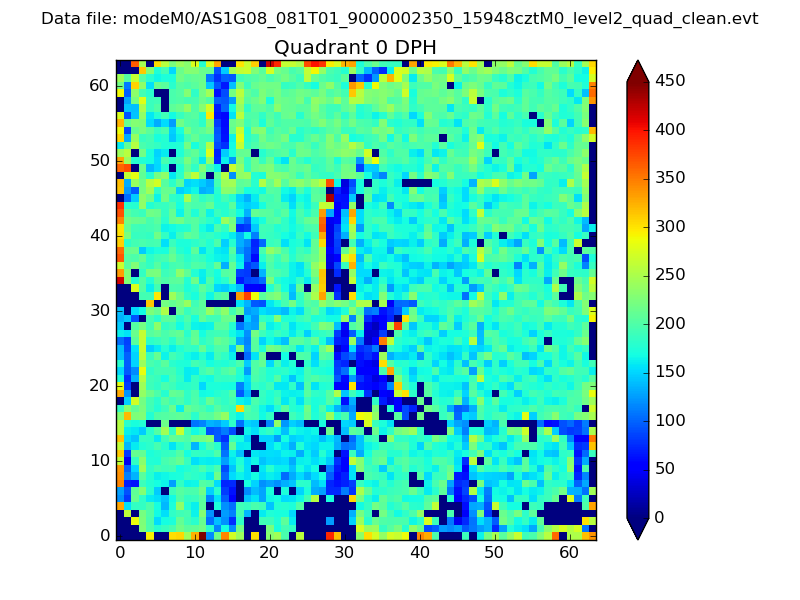 |
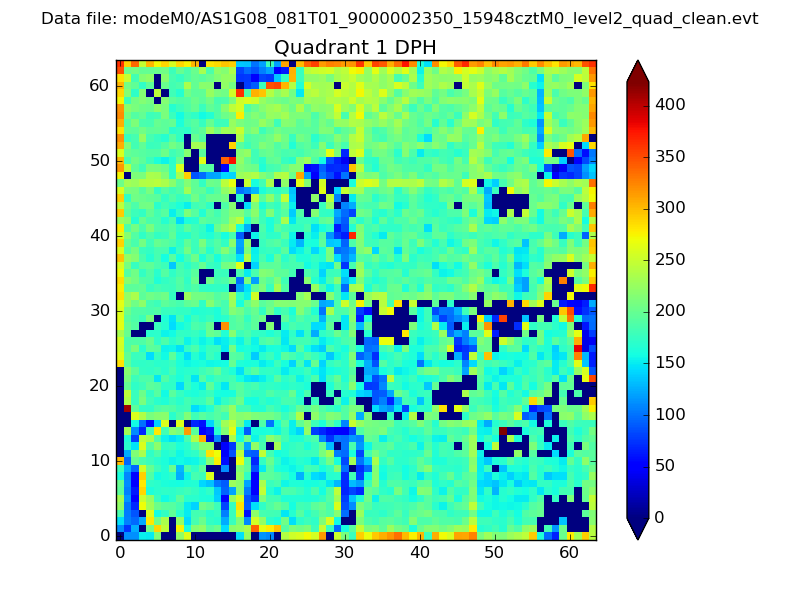 |
Quadrant B |
|---|---|---|---|
| Quadrant D | 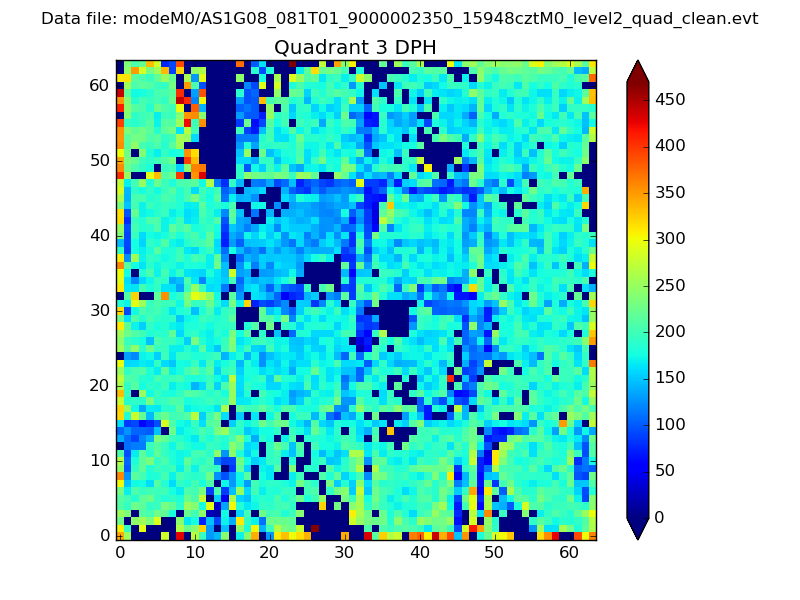 |
 |
Quadrant C |
| Plot type | Count rate plots | Images |
|---|---|---|
| Comparison with Poisson distribution Blue bars denote a histogram of data divided into 1 sec bins. Red curve is a Poisson curve with rate = median count rate of data. |
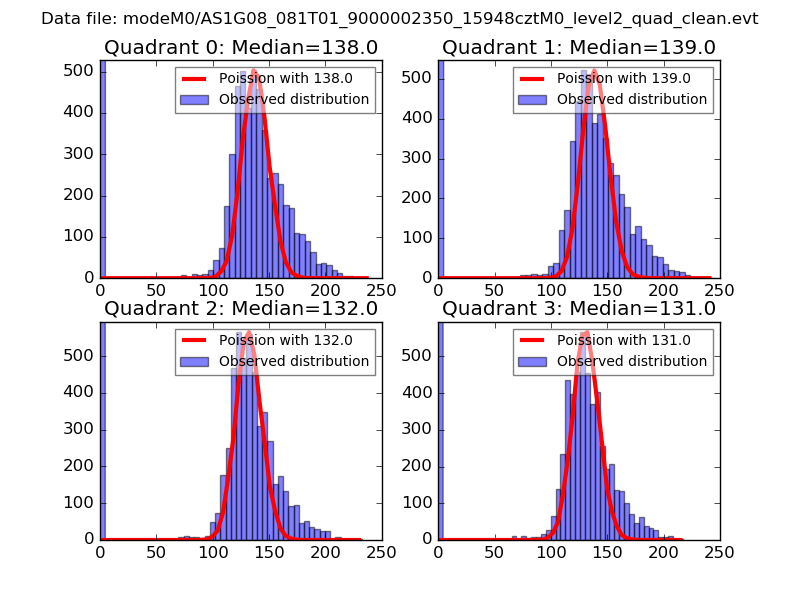 |
 |
| Quadrant-wise count rates Data is divided into 100 sec bins |
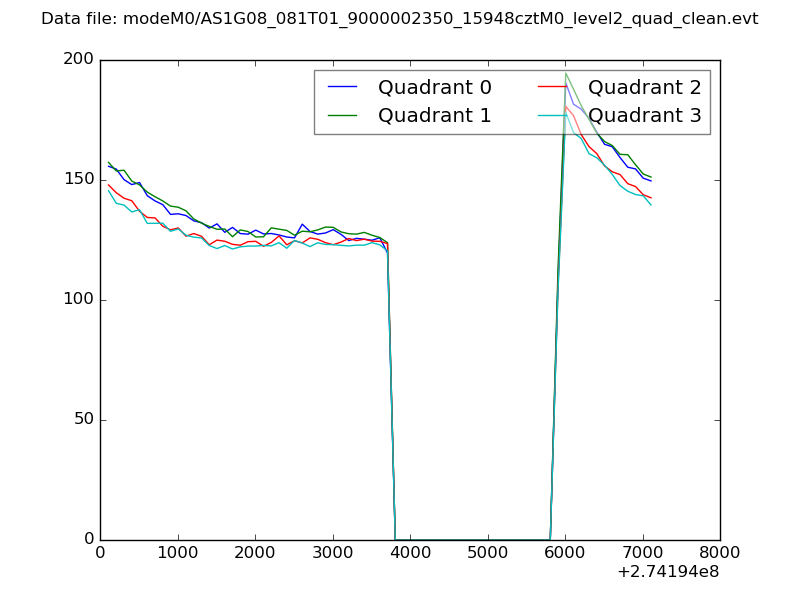 |
|
| Module-wise count rates for Quadrant A Data is divided into 100 sec bins |
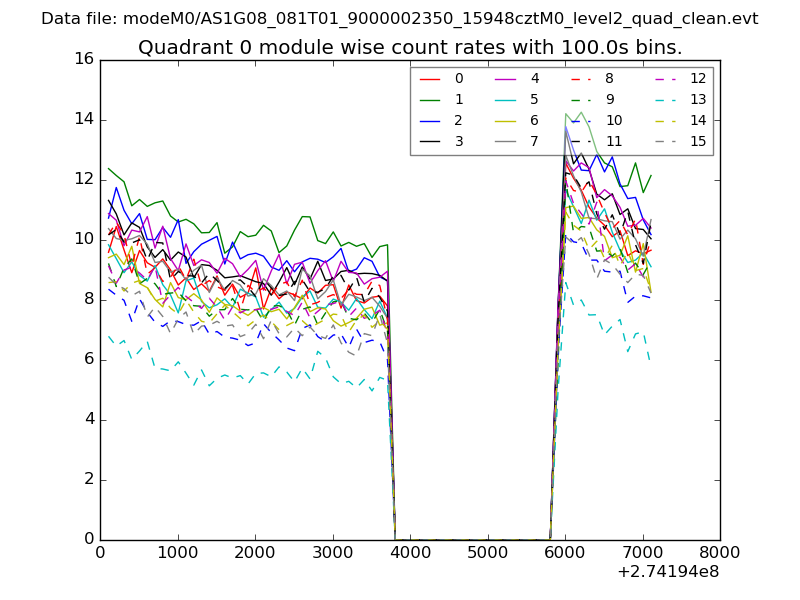 |
 |
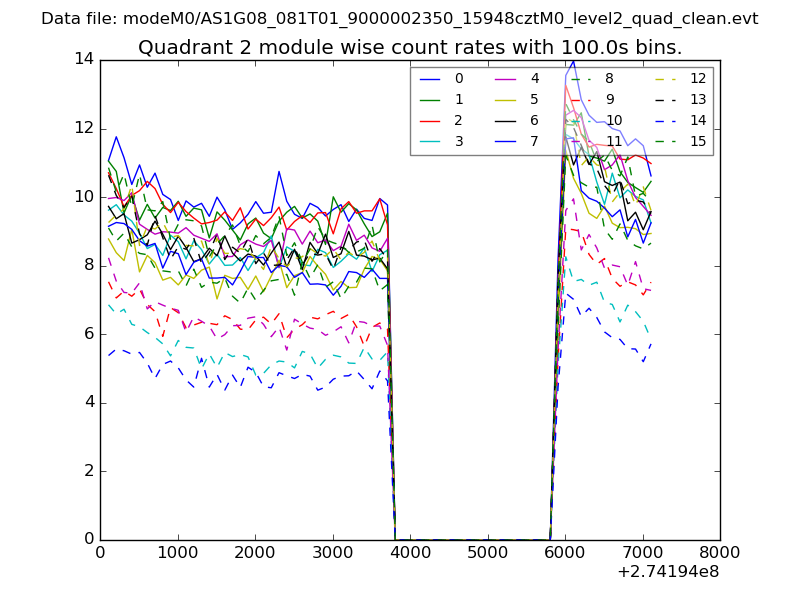
| Module-wise count rates for Quadrant B Data is divided into 100 sec bins |
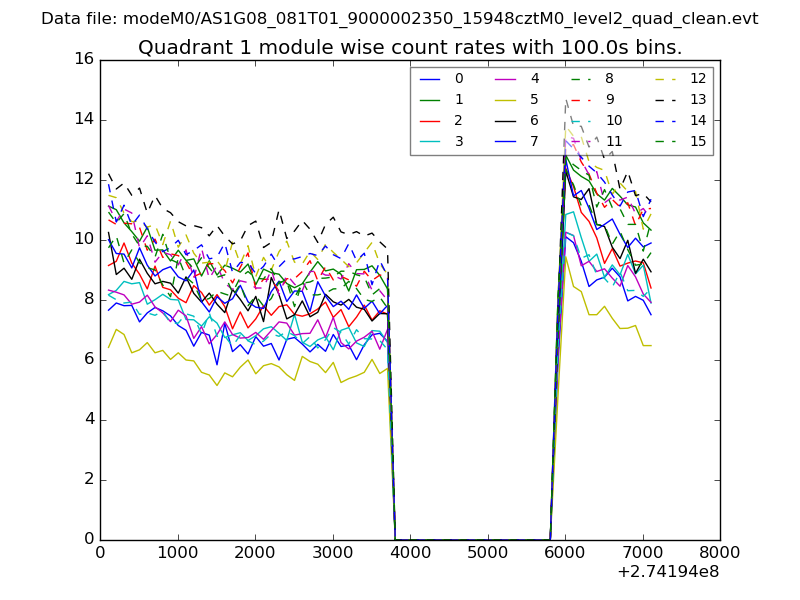 |
 |
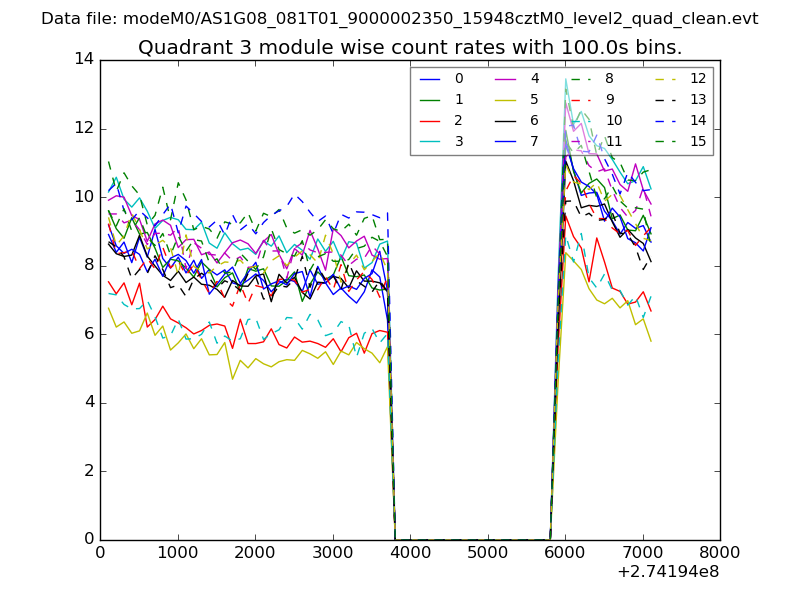
| Module-wise count rates for Quadrant C Data is divided into 100 sec bins |
 |
 |
| Module-wise count rates for Quadrant D Data is divided into 100 sec bins |
 |
 |
| Parameter | Plot |
|---|---|
| CZT HV Monitor | 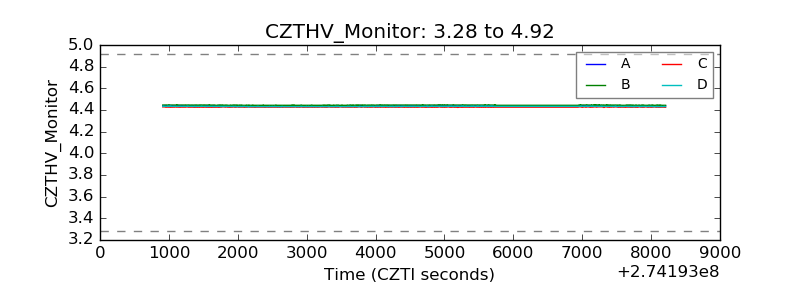 |
| D_VDD | 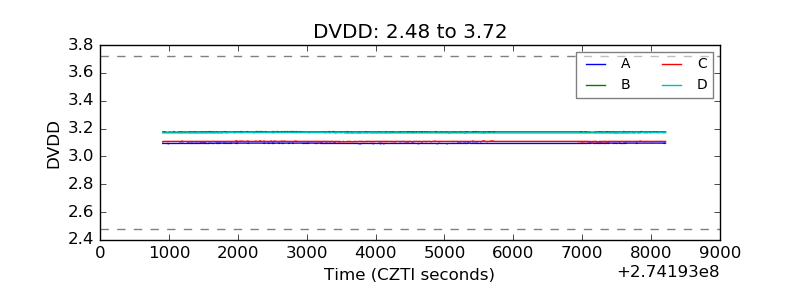 |
| Temperature 1 | 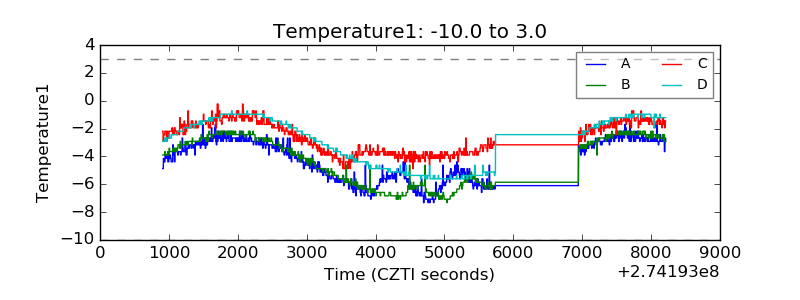 |
| Veto HV Monitor | 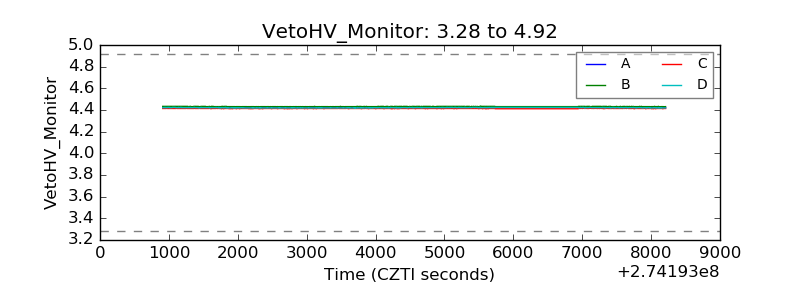 |
| Veto LLD | 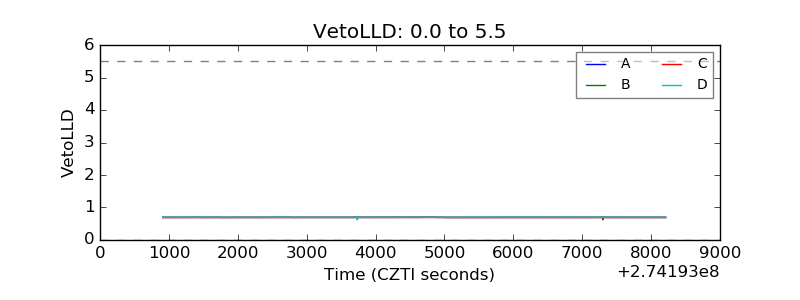 |
| Alpha Counter | 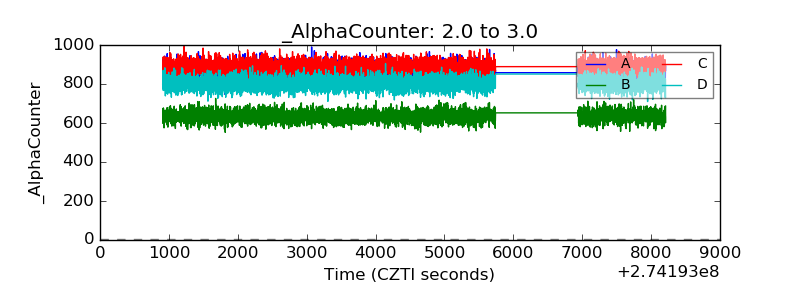 |
| _CPM_Rate | 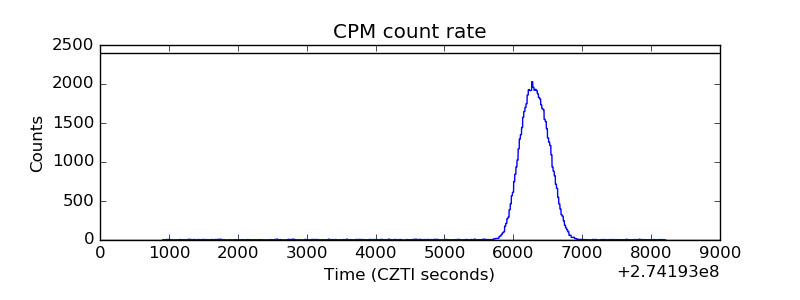 |
| CZT Counter |  |
| +2.5 Volts monitor |  |
| +5 Volts monitor |  |
| _ROLL_ROT | 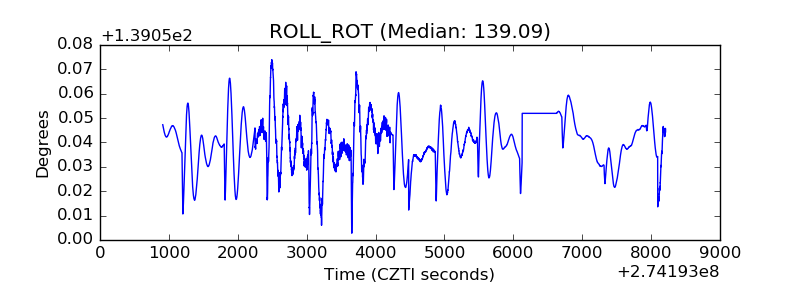 |
| _Roll_DEC | 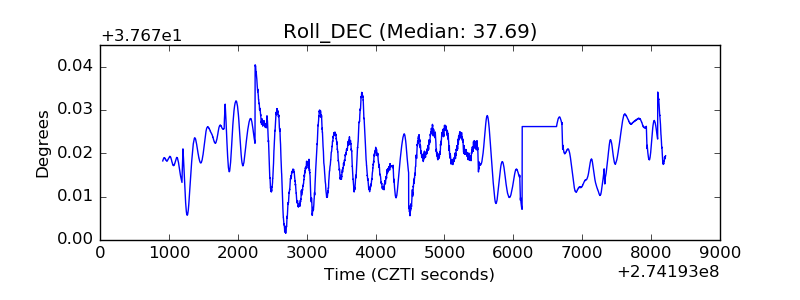 |
| _Roll_RA | 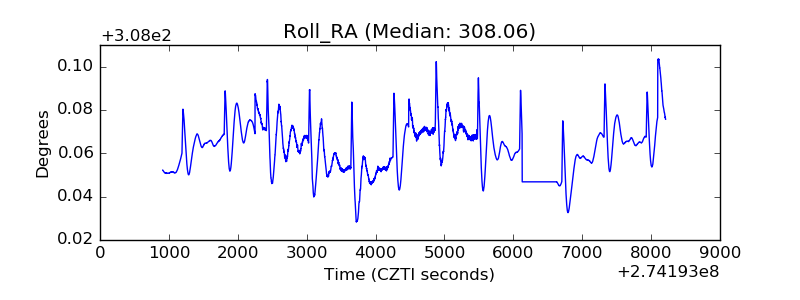 |
| Veto Counter | 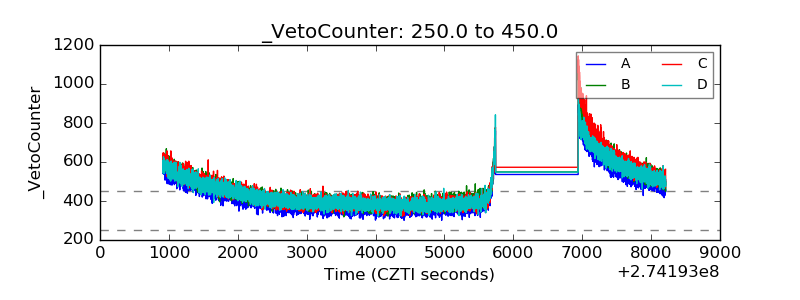 |