| Param | Original file | Final file |
|---|---|---|
| Filename | modeM0/AS1G08_081T01_9000002350_15951cztM0_level2.evt | modeM0/AS1G08_081T01_9000002350_15951cztM0_level2_quad_clean.evt |
| Size (bytes) | 436,098,240 | 97,516,800 |
| Size | 415.9 MB | 93.0 MB |
| Events in quadrant A | 3,085,229 | 640,148 |
| Events in quadrant B | 3,417,001 | 651,090 |
| Events in quadrant C | 3,189,751 | 625,734 |
| Events in quadrant D | 3,098,800 | 608,490 |
| Mode SS | |||
|---|---|---|---|
| Quadrant | BADHDUFLAG | Total packets | Discarded packets |
| A | 0 | 124 | 0 |
| B | 0 | 124 | 0 |
| C | 0 | 124 | 0 |
| D | 0 | 124 | 0 |
| Mode M0 | |||
|---|---|---|---|
| Quadrant | BADHDUFLAG | Total packets | Discarded packets |
| A | 0 | 13113 | 3 |
| B | 0 | 14041 | 2 |
| C | 0 | 13278 | 2 |
| D | 0 | 13348 | 2 |
| Mode M9 | |||
|---|---|---|---|
| Quadrant | BADHDUFLAG | Total packets | Discarded packets |
| A | 0 | 14 | 0 |
| B | 0 | 14 | 0 |
| C | 0 | 14 | 0 |
| D | 0 | 15 | 0 |
| Quadrant | Total seconds | Saturated seconds | Saturation percentage |
|---|---|---|---|
| A | 6130 | 41 | 0.668842% |
| B | 6130 | 73 | 1.190865% |
| C | 6130 | 75 | 1.223491% |
| D | 6130 | 42 | 0.685155% |
Noise dominated data is calculated using 1-second bins in cleaned event files. If a bin has >2000 counts, and if more than 50% of those come from <1% of pixels, then it is considered to be noise-dominated and hence unusable.
| Quadrant | # 1 sec bins | Bins with >0 counts | Bins with >2000 counts | High rate bins dominated by noise | Noise dominated (total time) | Noise dominated (detector-on time) | Marked lightcurve |
|---|---|---|---|---|---|---|---|
| A | 7511 | 6132 | 0 | 0 | 0.00% | 0.00% | 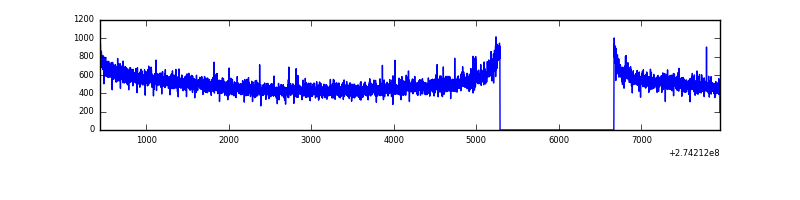 |
| B | 7511 | 6132 | 15 | 15 | 0.20% | 0.24% | 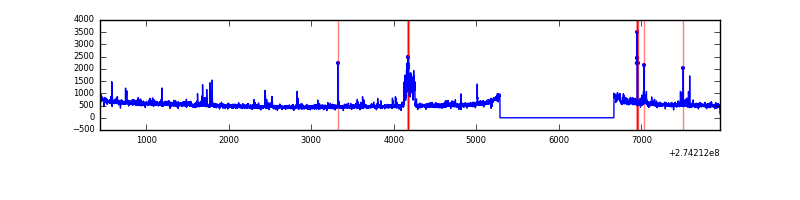 |
| C | 7511 | 6132 | 0 | 0 | 0.00% | 0.00% | 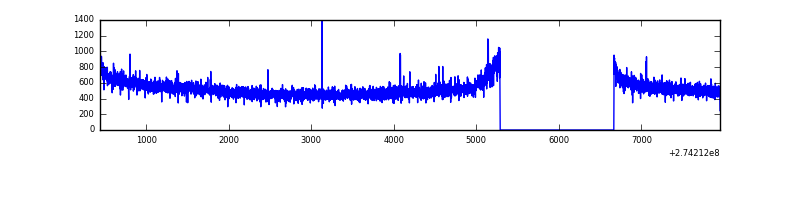 |
| D | 7511 | 6132 | 13 | 13 | 0.17% | 0.21% | 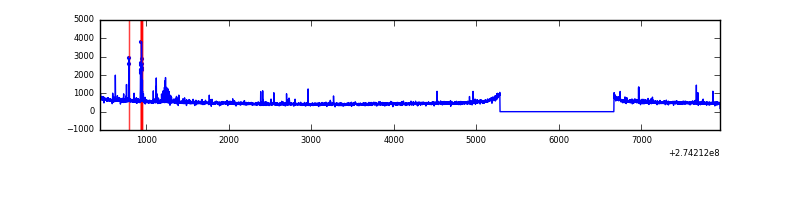 |
Top three noisy pixels from each quadrant. If the there are fewer than three noisy pixels in the level2.evt file, extra rows are filled as -1
| Pixel properties | Quadrant properties | ||||||
|---|---|---|---|---|---|---|---|
| Quadrant | DetID | PixID | Counts | Sigma | Mean | Median | Sigma |
| A | 15 | 239 | 8752 | 50.29 | 795 | 781 | 158.5 |
| A | 13 | 210 | 8511 | 48.77 | 795 | 781 | 158.5 |
| A | 0 | 226 | 7000 | 39.24 | 795 | 781 | 158.5 |
| B | 5 | 65 | 164978 | 1113.12 | 795 | 776 | 147.5 |
| B | 0 | 189 | 28919 | 190.78 | 795 | 776 | 147.5 |
| B | 4 | 216 | 27592 | 181.78 | 795 | 776 | 147.5 |
| C | 14 | 238 | 118348 | 654.09 | 774 | 782 | 179.7 |
| C | 3 | 233 | 45824 | 250.59 | 774 | 782 | 179.7 |
| C | 0 | 207 | 8862 | 44.95 | 774 | 782 | 179.7 |
| D | 4 | 239 | 54296 | 286.04 | 777 | 756 | 187.2 |
| D | 10 | 70 | 38790 | 203.2 | 777 | 756 | 187.2 |
| D | 2 | 234 | 32708 | 170.7 | 777 | 756 | 187.2 |
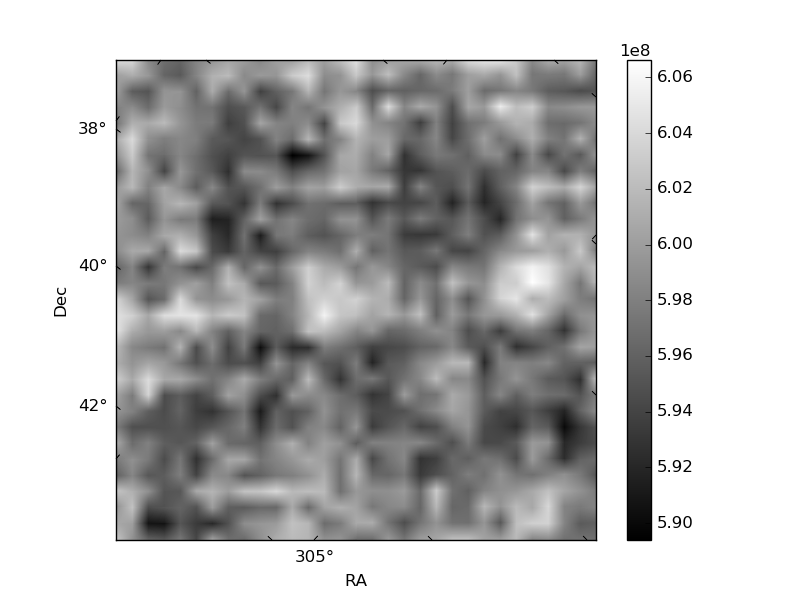
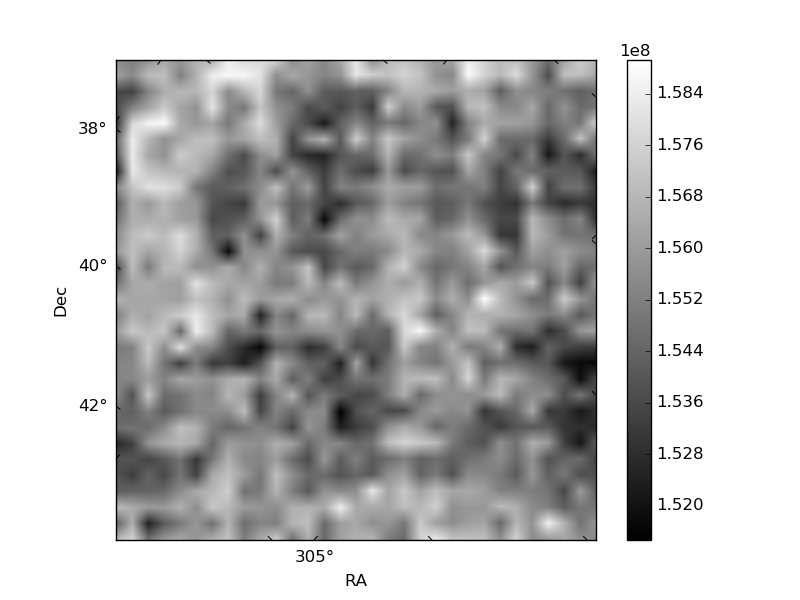
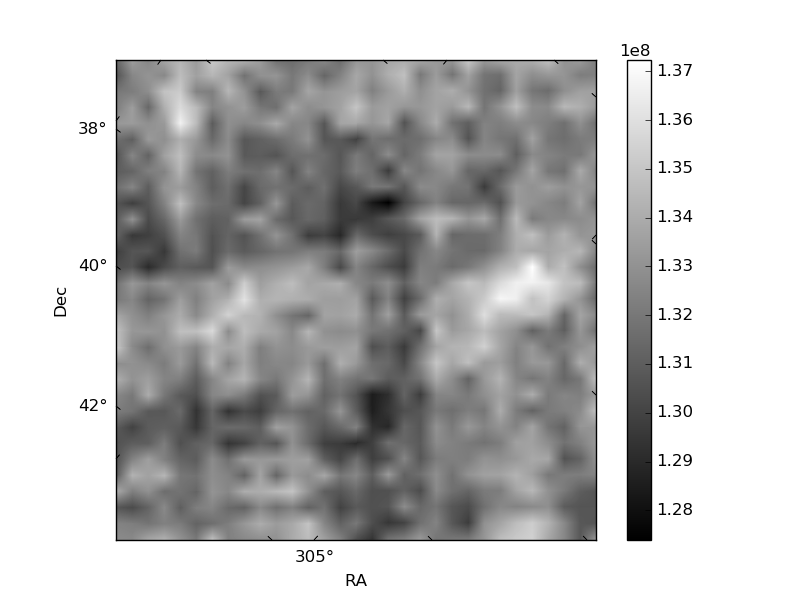
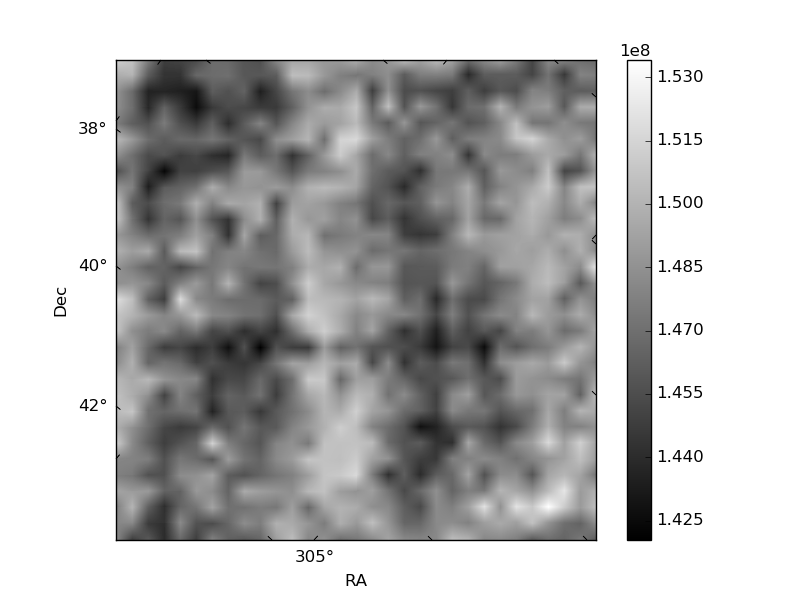
Histogram calculated using DETX and DETY for each event in the final _common_clean file
| Quadrant A | 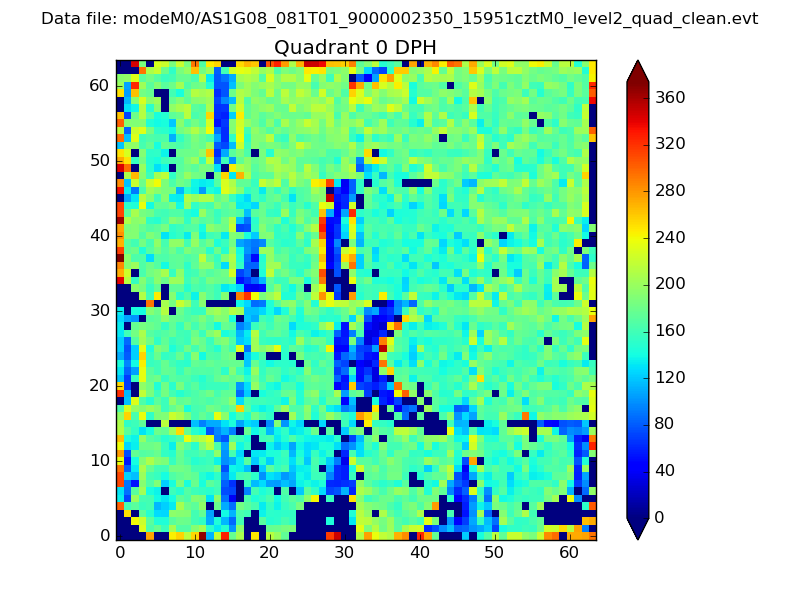 |
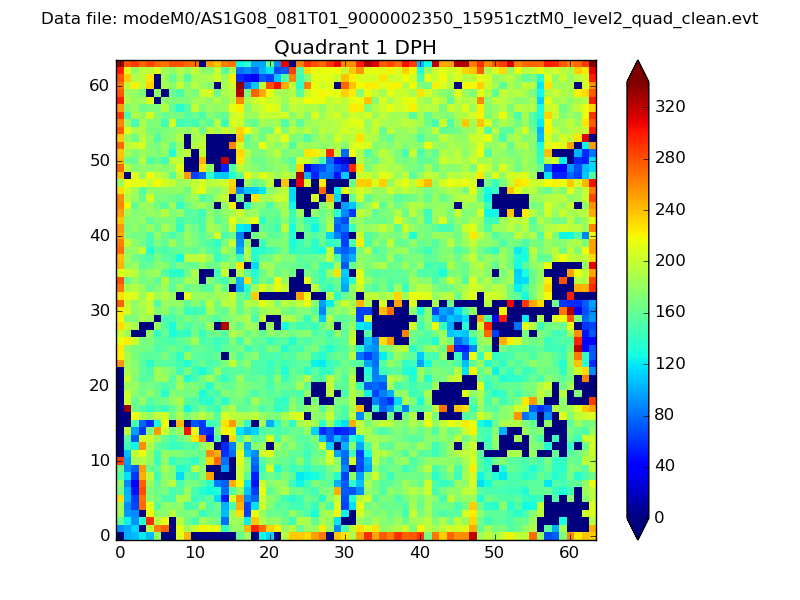 |
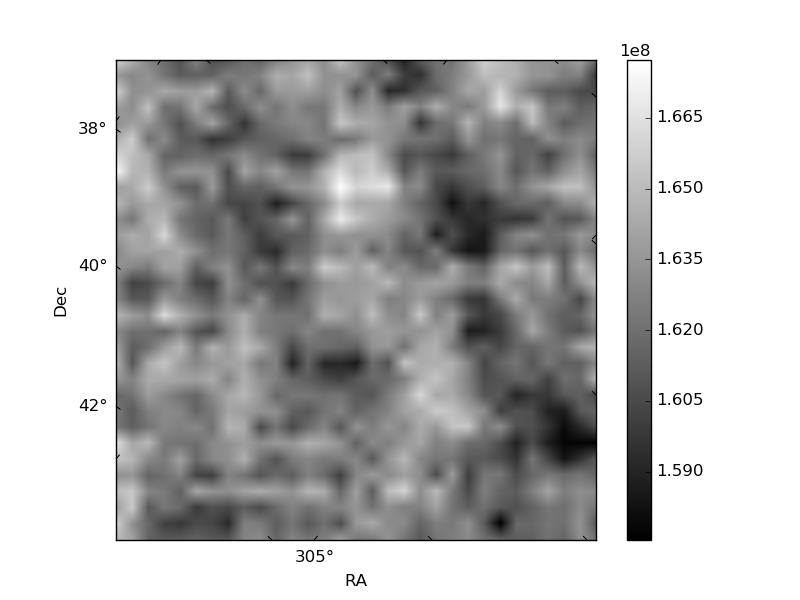
Quadrant B |
|---|---|---|---|
| Quadrant D | 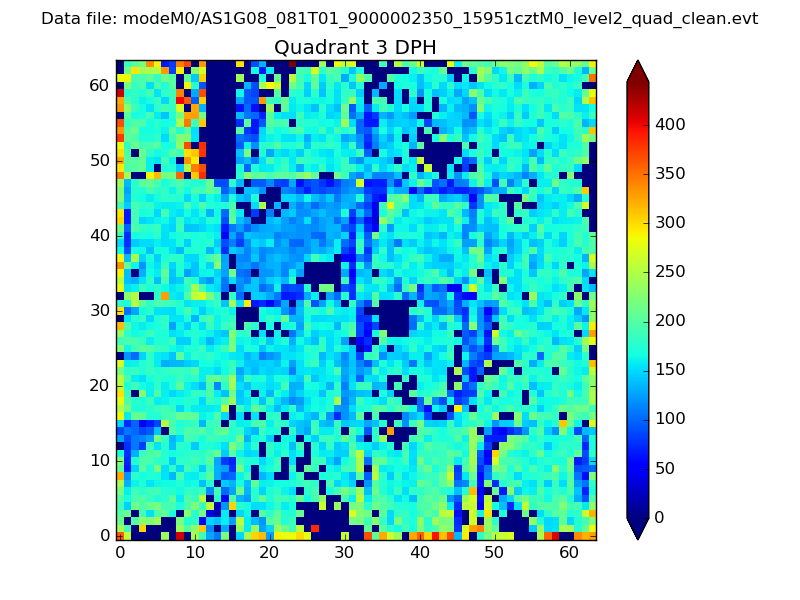 |
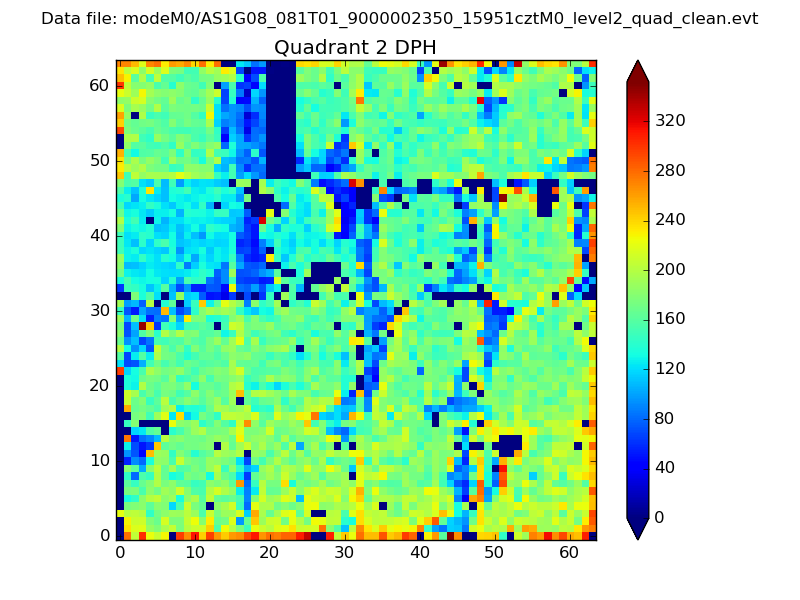 |
Quadrant C |
| Plot type | Count rate plots | Images |
|---|---|---|
| Comparison with Poisson distribution Blue bars denote a histogram of data divided into 1 sec bins. Red curve is a Poisson curve with rate = median count rate of data. |
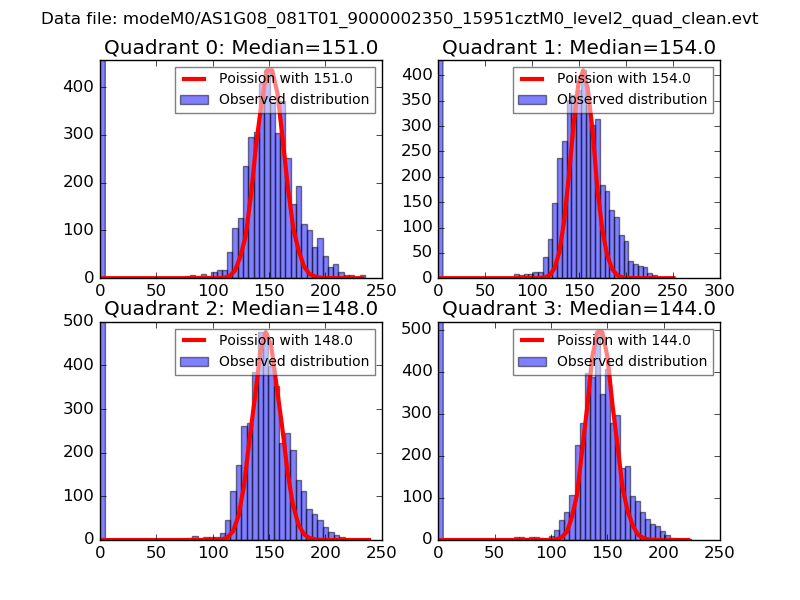 |
 |
| Quadrant-wise count rates Data is divided into 100 sec bins |
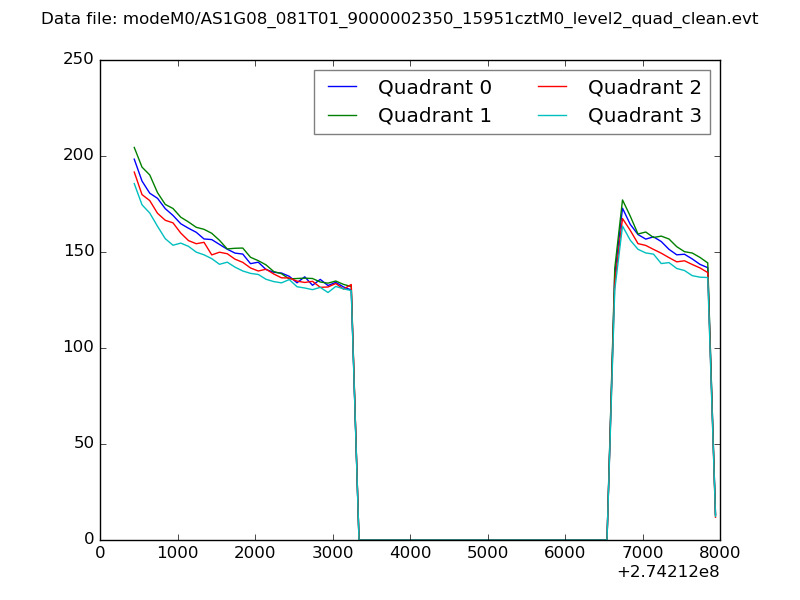 |
|
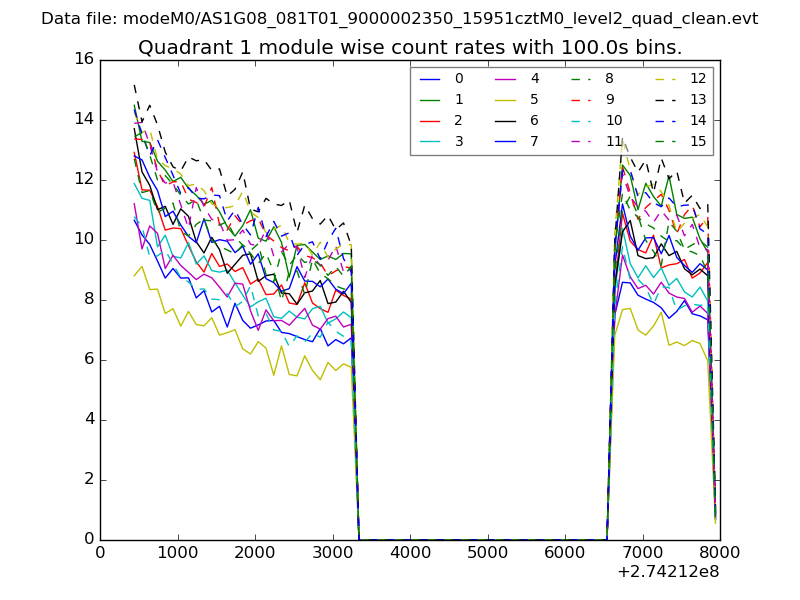
| Module-wise count rates for Quadrant A Data is divided into 100 sec bins |
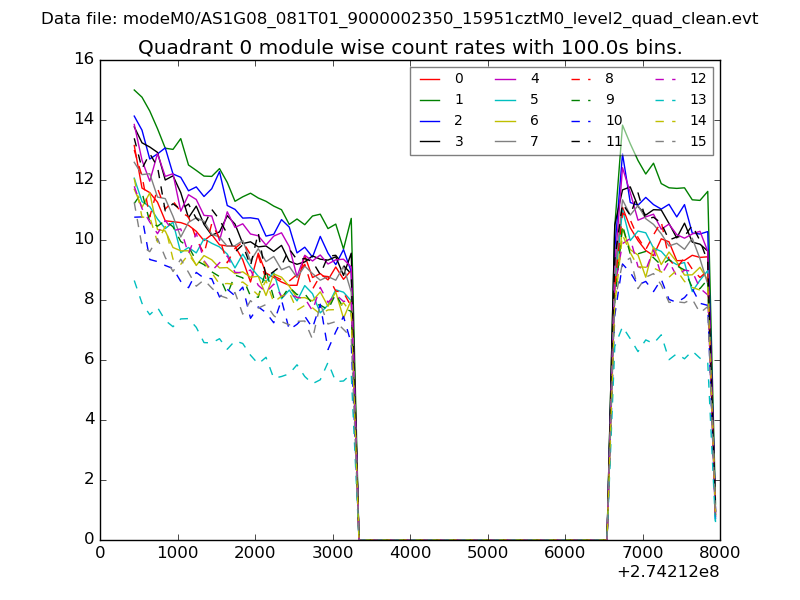 |
 |
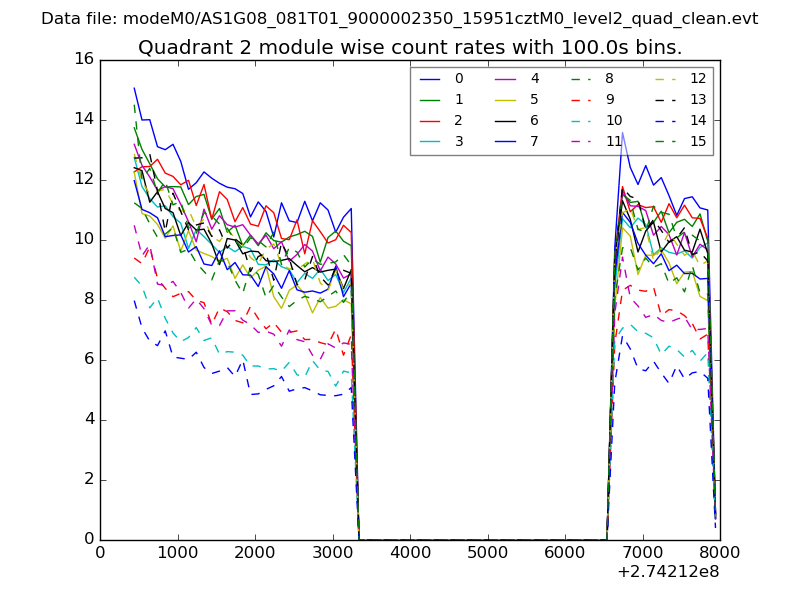
| Module-wise count rates for Quadrant B Data is divided into 100 sec bins |
 |
 |
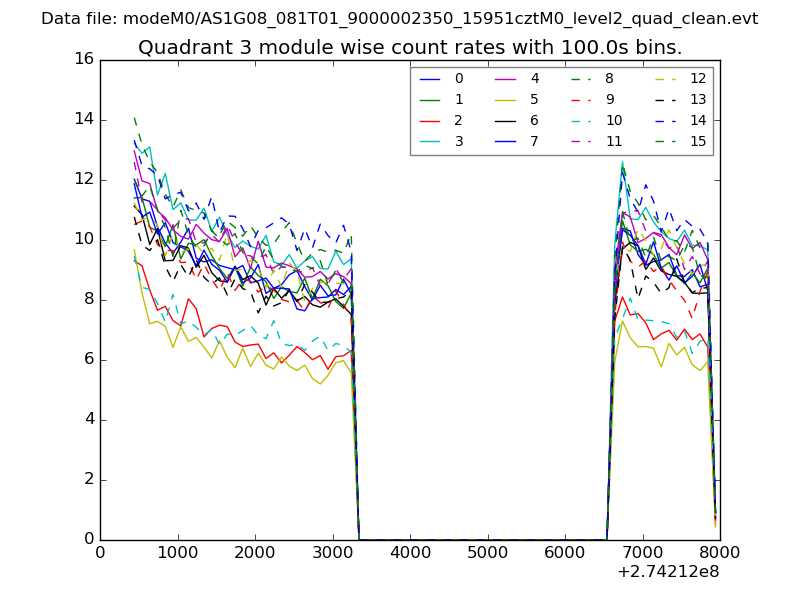
| Module-wise count rates for Quadrant C Data is divided into 100 sec bins |
 |
 |
| Module-wise count rates for Quadrant D Data is divided into 100 sec bins |
 |
 |
| Parameter | Plot |
|---|---|
| CZT HV Monitor | 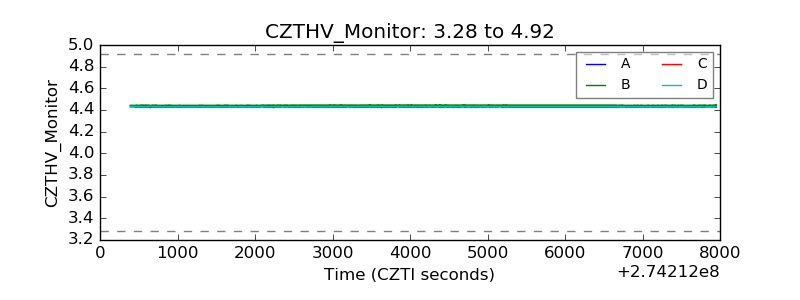 |
| D_VDD | 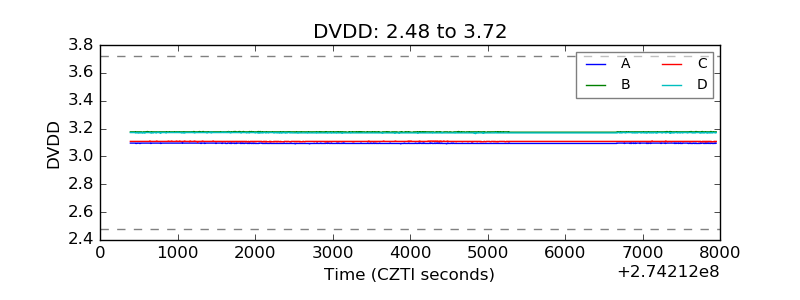 |
| Temperature 1 | 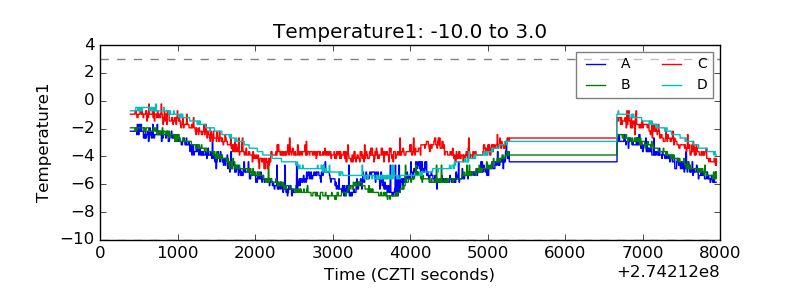 |
| Veto HV Monitor | 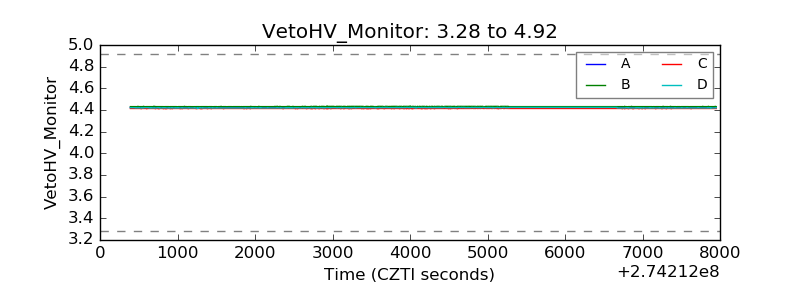 |
| Veto LLD | 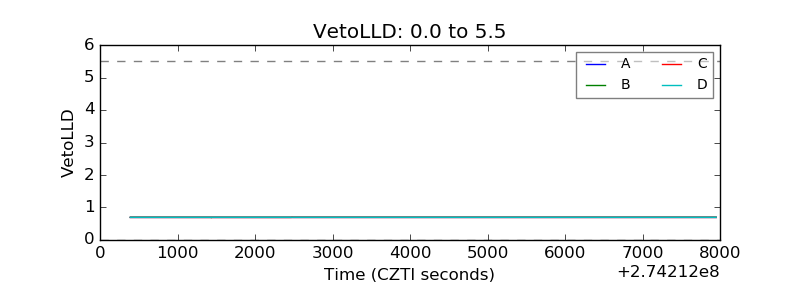 |
| Alpha Counter | 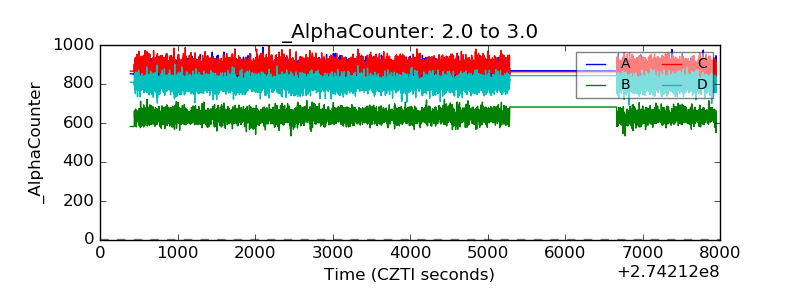 |
| _CPM_Rate | 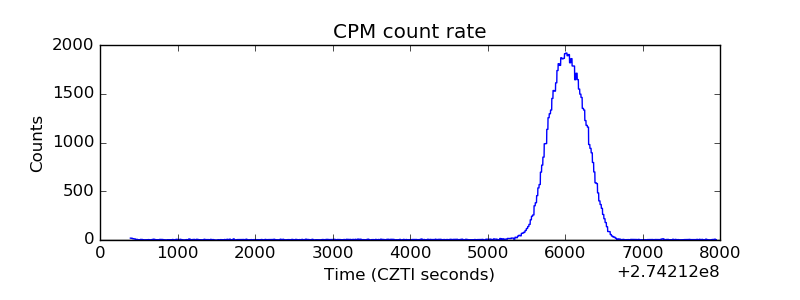 |
| CZT Counter |  |
| +2.5 Volts monitor |  |
| +5 Volts monitor | 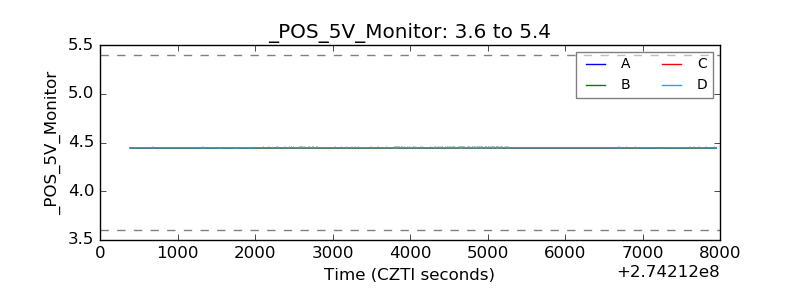 |
| _ROLL_ROT | 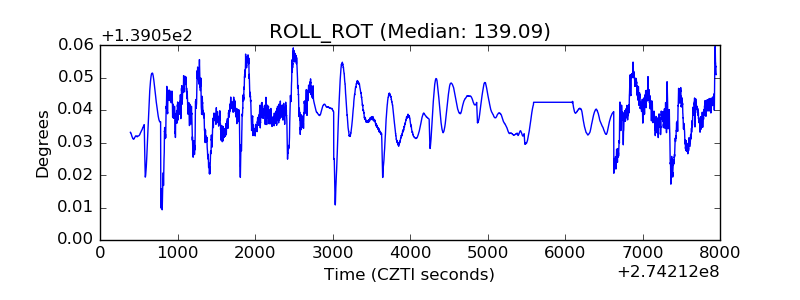 |
| _Roll_DEC | 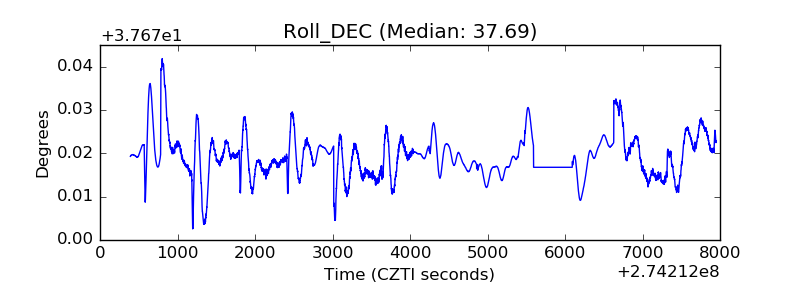 |
| _Roll_RA | 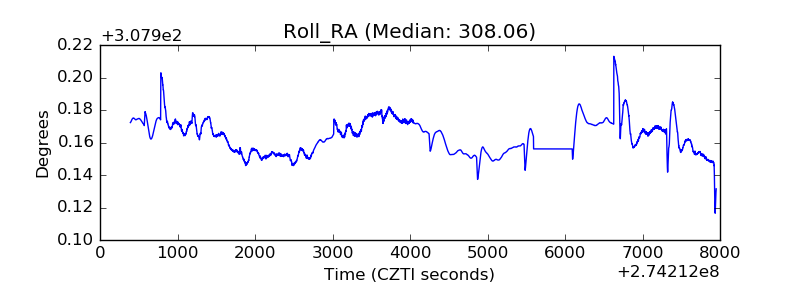 |
| Veto Counter | 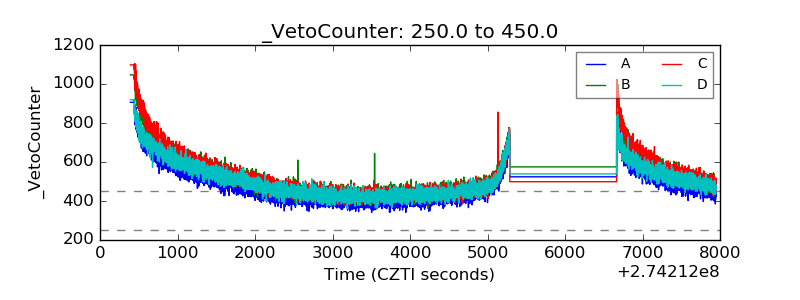 |