| Param | Original file | Final file |
|---|---|---|
| Filename | modeM0/AS1G08_081T01_9000002350_15952cztM0_level2.evt | modeM0/AS1G08_081T01_9000002350_15952cztM0_level2_quad_clean.evt |
| Size (bytes) | 421,902,720 | 88,994,880 |
| Size | 402.4 MB | 84.9 MB |
| Events in quadrant A | 3,144,523 | 570,480 |
| Events in quadrant B | 3,228,398 | 586,888 |
| Events in quadrant C | 3,093,042 | 561,713 |
| Events in quadrant D | 2,893,476 | 546,944 |
| Mode SS | |||
|---|---|---|---|
| Quadrant | BADHDUFLAG | Total packets | Discarded packets |
| A | 0 | 124 | 0 |
| B | 0 | 124 | 0 |
| C | 0 | 124 | 0 |
| D | 0 | 124 | 0 |
| Mode M0 | |||
|---|---|---|---|
| Quadrant | BADHDUFLAG | Total packets | Discarded packets |
| A | 0 | 13405 | 3 |
| B | 0 | 13518 | 2 |
| C | 0 | 13009 | 2 |
| D | 0 | 12849 | 2 |
| Mode M9 | |||
|---|---|---|---|
| Quadrant | BADHDUFLAG | Total packets | Discarded packets |
| A | 0 | 17 | 0 |
| B | 0 | 17 | 0 |
| C | 0 | 17 | 0 |
| D | 0 | 18 | 0 |
| Quadrant | Total seconds | Saturated seconds | Saturation percentage |
|---|---|---|---|
| A | 6148 | 72 | 1.171113% |
| B | 6148 | 58 | 0.943396% |
| C | 6148 | 68 | 1.106051% |
| D | 6148 | 19 | 0.309044% |
Noise dominated data is calculated using 1-second bins in cleaned event files. If a bin has >2000 counts, and if more than 50% of those come from <1% of pixels, then it is considered to be noise-dominated and hence unusable.
| Quadrant | # 1 sec bins | Bins with >0 counts | Bins with >2000 counts | High rate bins dominated by noise | Noise dominated (total time) | Noise dominated (detector-on time) | Marked lightcurve |
|---|---|---|---|---|---|---|---|
| A | 7414 | 6150 | 22 | 22 | 0.30% | 0.36% | 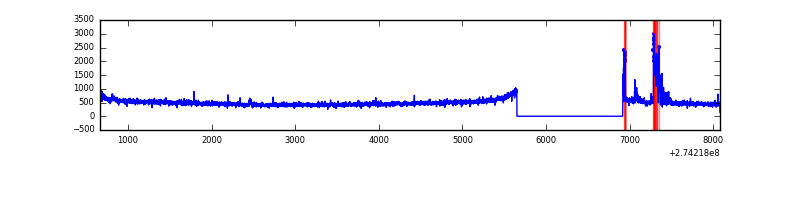 |
| B | 7414 | 6150 | 13 | 13 | 0.18% | 0.21% | 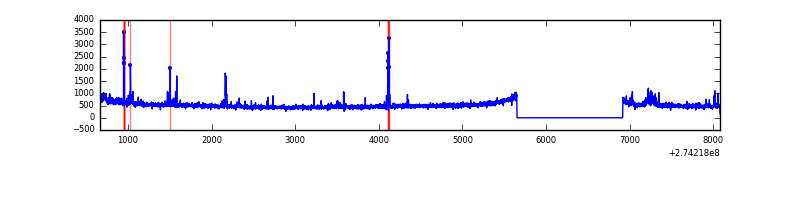 |
| C | 7414 | 6150 | 0 | 0 | 0.00% | 0.00% | 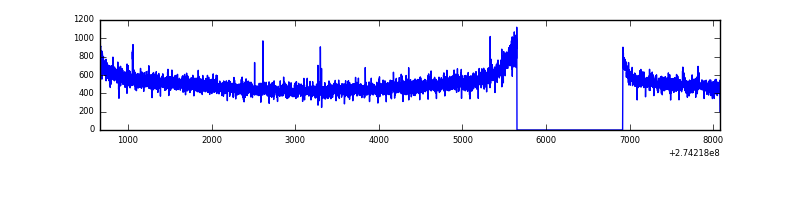 |
| D | 7414 | 6150 | 1 | 1 | 0.01% | 0.02% | 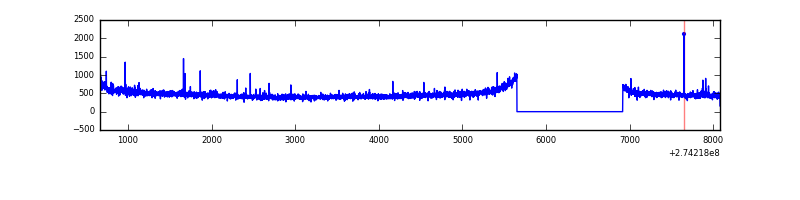 |
Top three noisy pixels from each quadrant. If the there are fewer than three noisy pixels in the level2.evt file, extra rows are filled as -1
| Pixel properties | Quadrant properties | ||||||
|---|---|---|---|---|---|---|---|
| Quadrant | DetID | PixID | Counts | Sigma | Mean | Median | Sigma |
| A | 15 | 239 | 179944 | 1171.2 | 768 | 755 | 153.0 |
| A | 0 | 226 | 6738 | 39.11 | 768 | 755 | 153.0 |
| A | 12 | 194 | 5769 | 32.77 | 768 | 755 | 153.0 |
| B | 4 | 216 | 51105 | 346.23 | 772 | 753 | 145.4 |
| B | 5 | 65 | 32139 | 215.82 | 772 | 753 | 145.4 |
| B | 0 | 244 | 26460 | 176.77 | 772 | 753 | 145.4 |
| C | 14 | 238 | 114797 | 654.0 | 750 | 758 | 174.4 |
| C | 3 | 233 | 50426 | 284.84 | 750 | 758 | 174.4 |
| C | 13 | 61 | 5140 | 25.13 | 750 | 758 | 174.4 |
| D | 2 | 234 | 28816 | 155.16 | 752 | 730 | 181.0 |
| D | 13 | 104 | 14772 | 77.57 | 752 | 730 | 181.0 |
| D | 2 | 152 | 9129 | 46.4 | 752 | 730 | 181.0 |
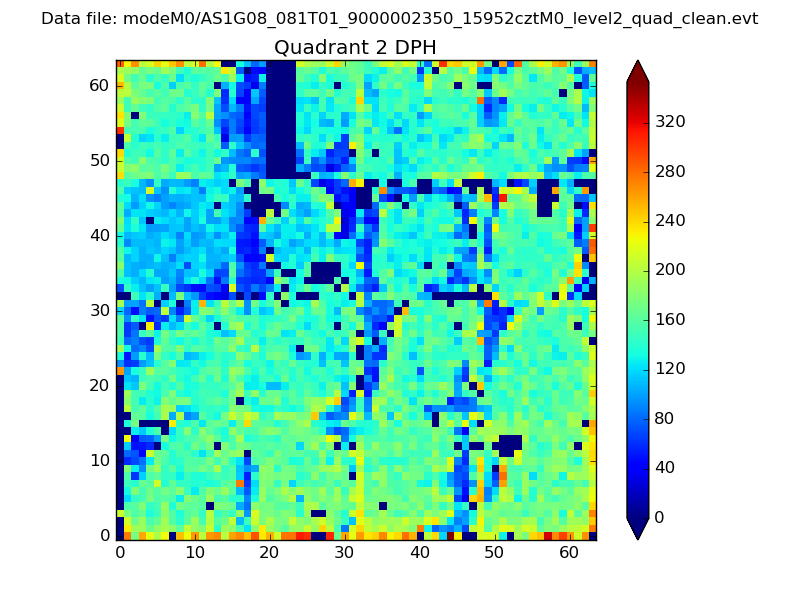
Histogram calculated using DETX and DETY for each event in the final _common_clean file
| Quadrant A | 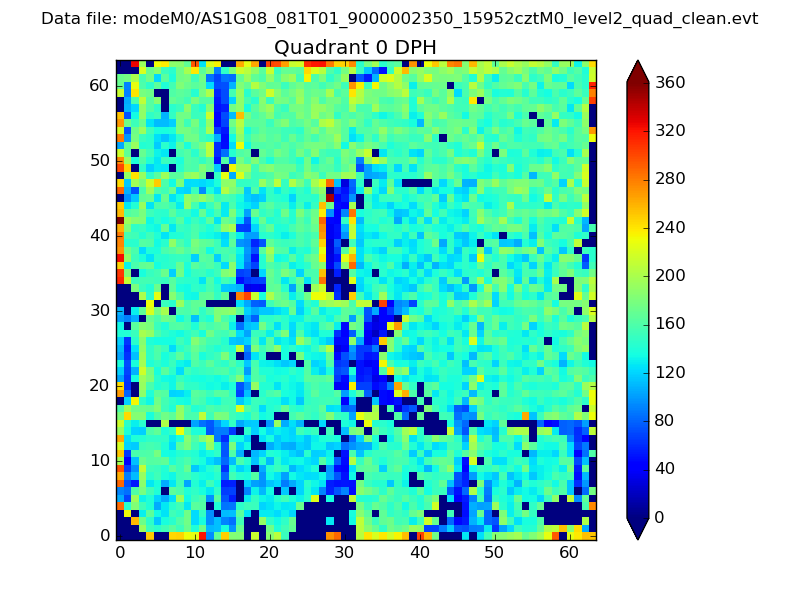 |
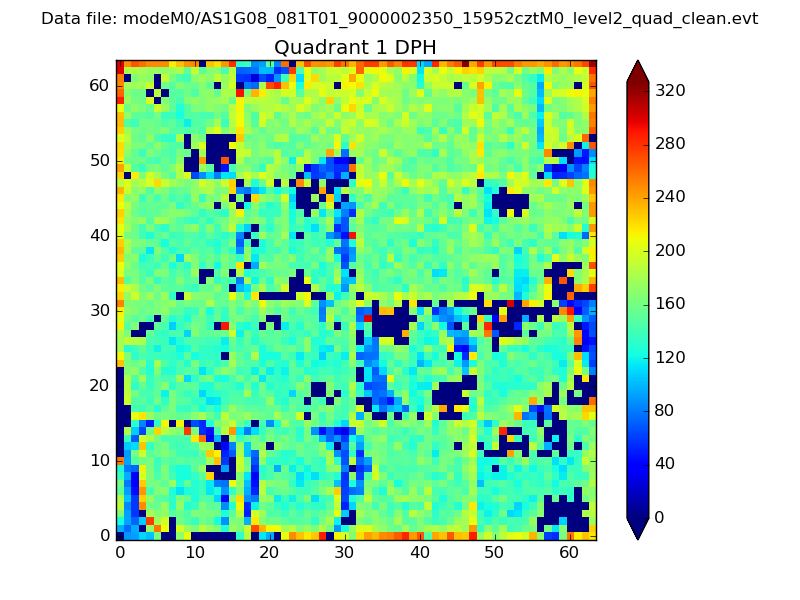 |
Quadrant B |
|---|---|---|---|
| Quadrant D | 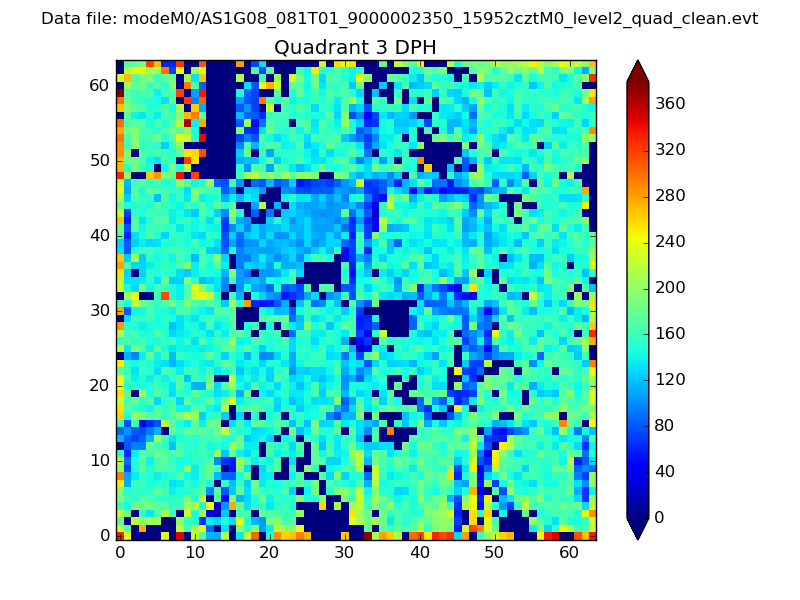 |
 |
Quadrant C |
| Plot type | Count rate plots | Images |
|---|---|---|
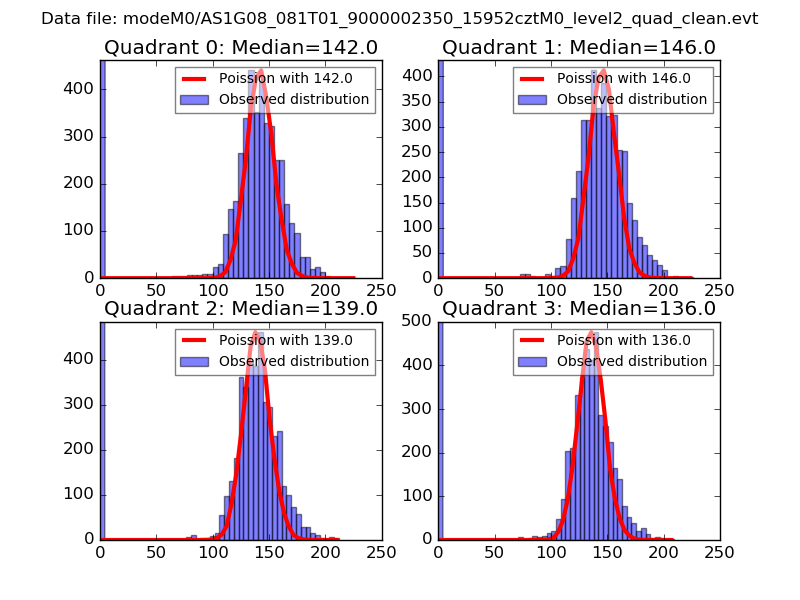
| Comparison with Poisson distribution Blue bars denote a histogram of data divided into 1 sec bins. Red curve is a Poisson curve with rate = median count rate of data. |
 |
 |
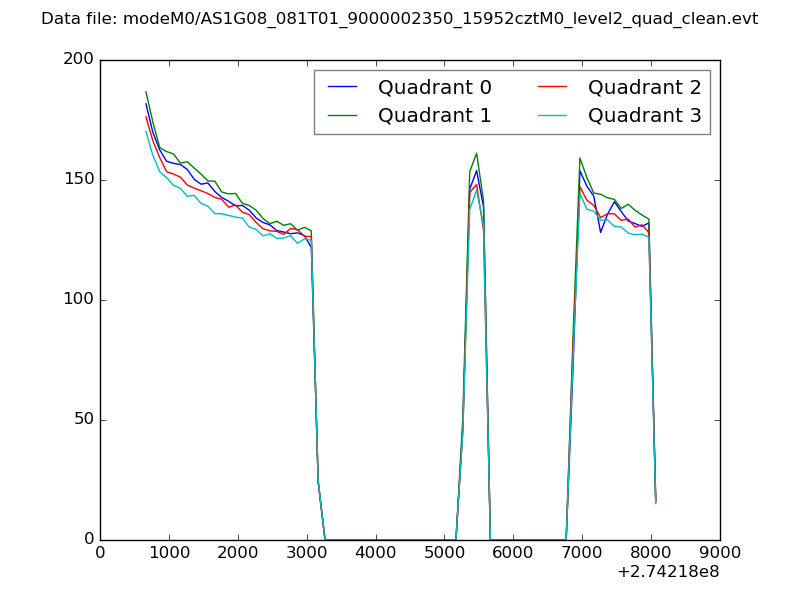
| Quadrant-wise count rates Data is divided into 100 sec bins |
 |
|
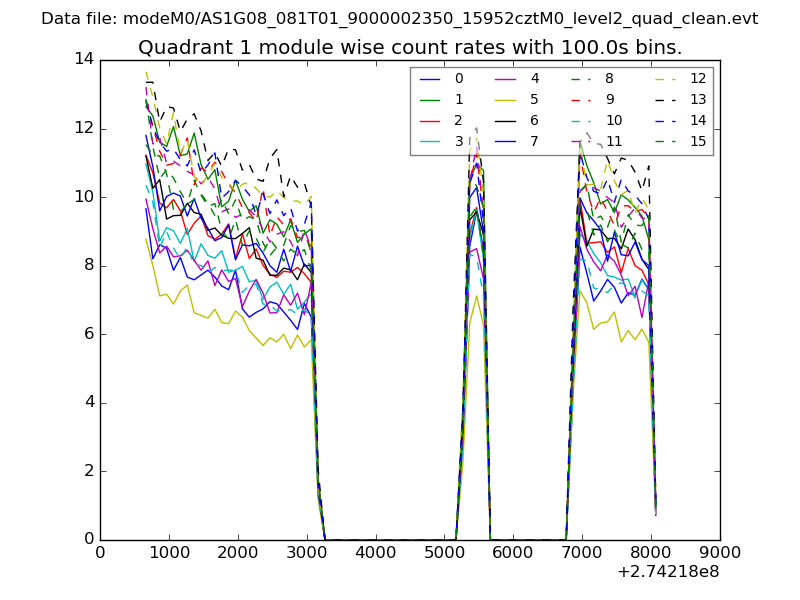
| Module-wise count rates for Quadrant A Data is divided into 100 sec bins |
 |
 |
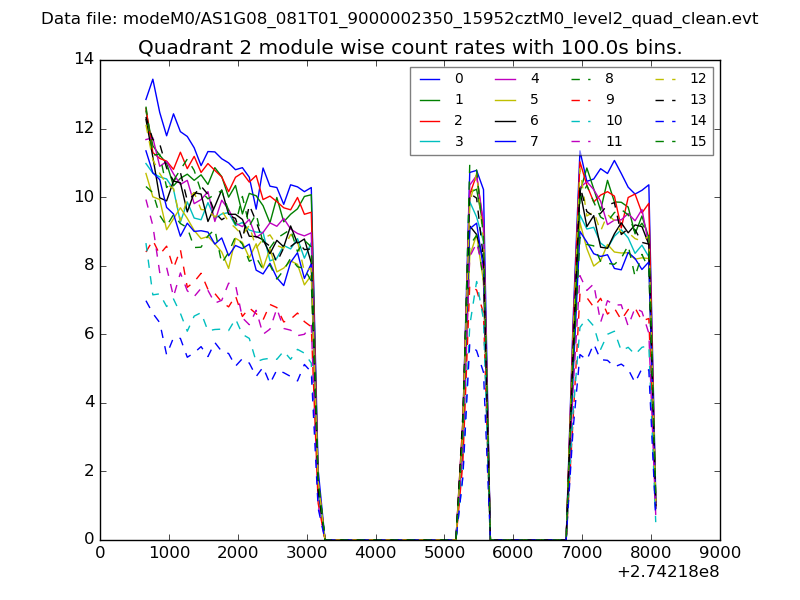
| Module-wise count rates for Quadrant B Data is divided into 100 sec bins |
 |
 |
| Module-wise count rates for Quadrant C Data is divided into 100 sec bins |
 |
 |
| Module-wise count rates for Quadrant D Data is divided into 100 sec bins |
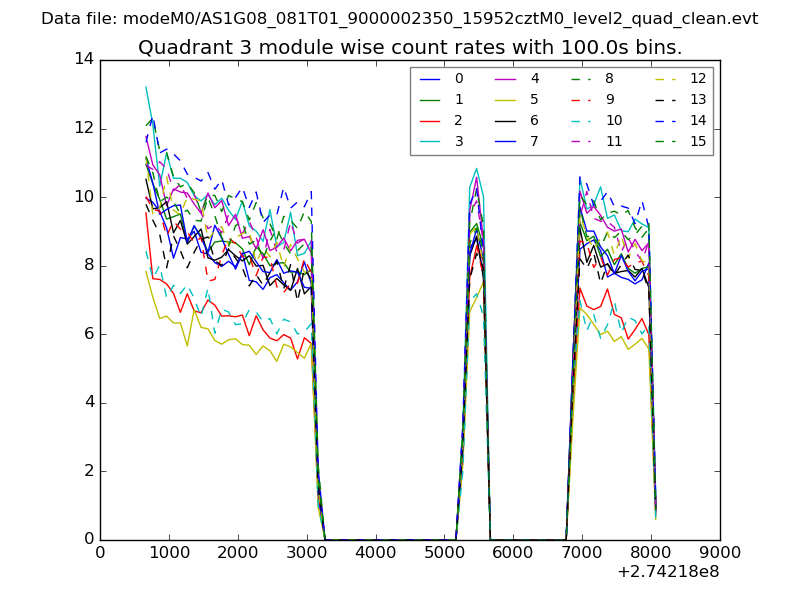 |
 |
| Parameter | Plot |
|---|---|
| CZT HV Monitor | 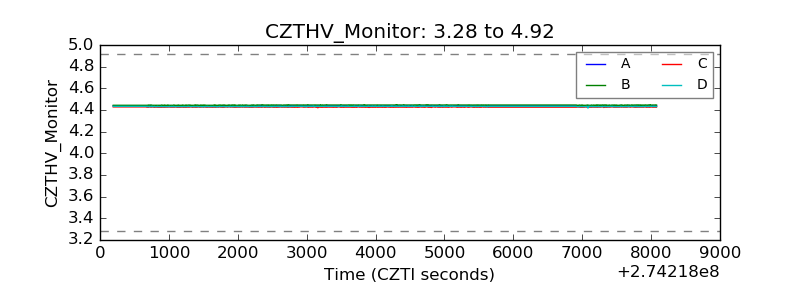 |
| D_VDD | 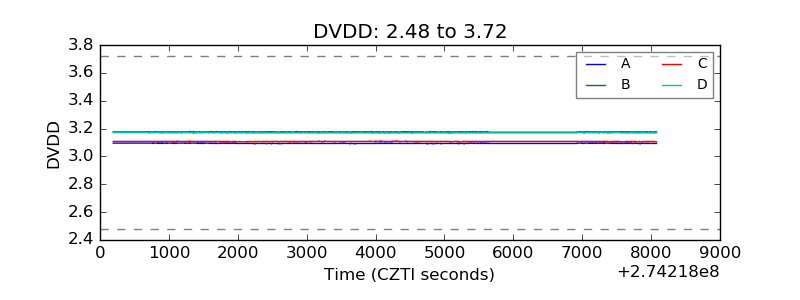 |
| Temperature 1 | 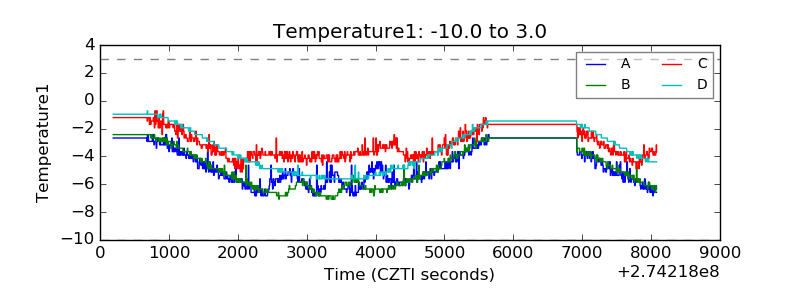 |
| Veto HV Monitor | 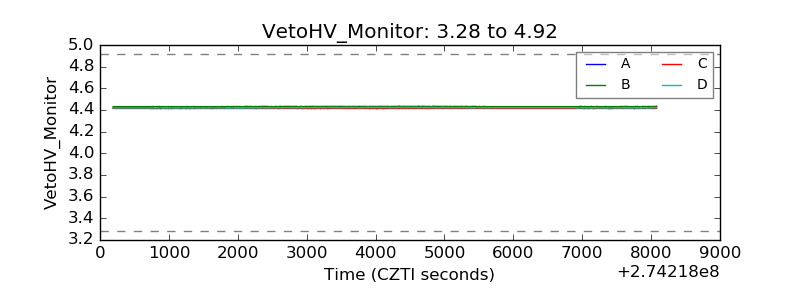 |
| Veto LLD | 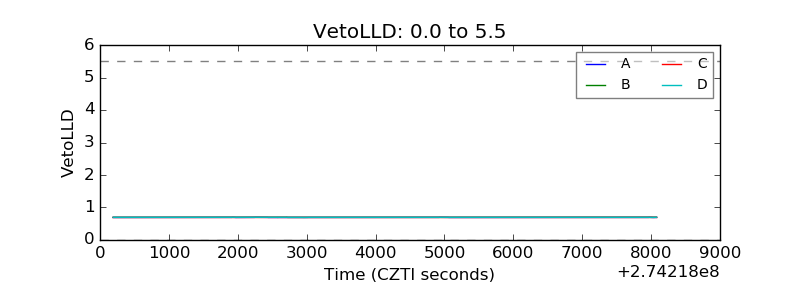 |
| Alpha Counter | 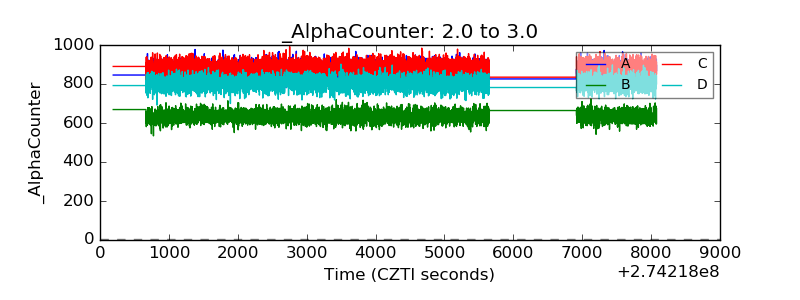 |
| _CPM_Rate | 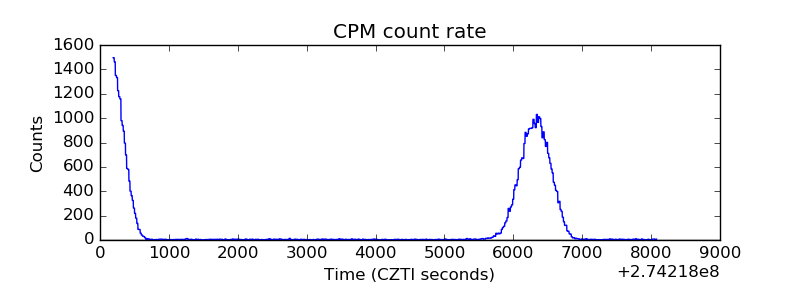 |
| CZT Counter | 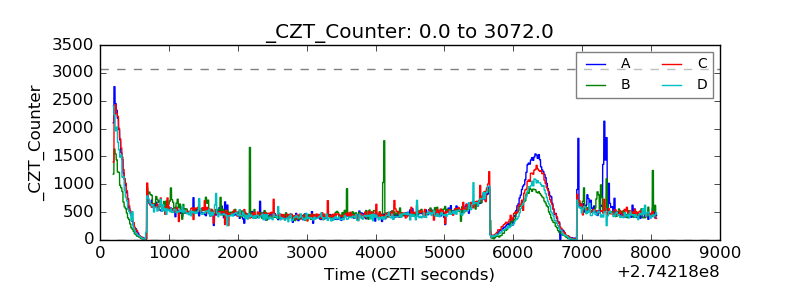 |
| +2.5 Volts monitor |  |
| +5 Volts monitor |  |
| _ROLL_ROT |  |
| _Roll_DEC | 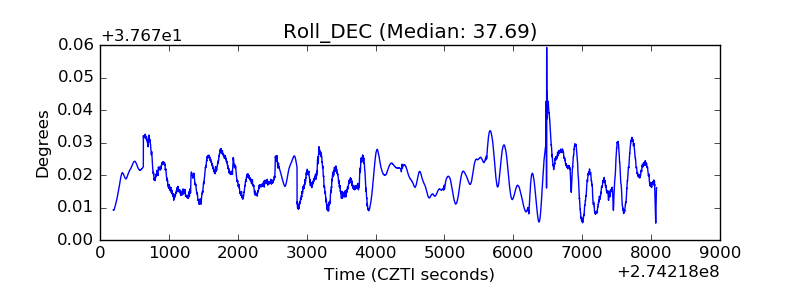 |
| _Roll_RA | 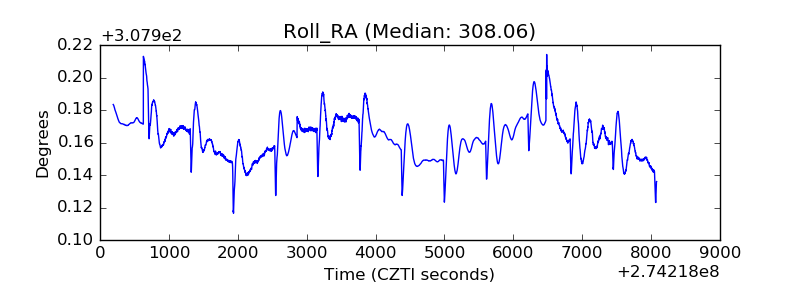 |
| Veto Counter | 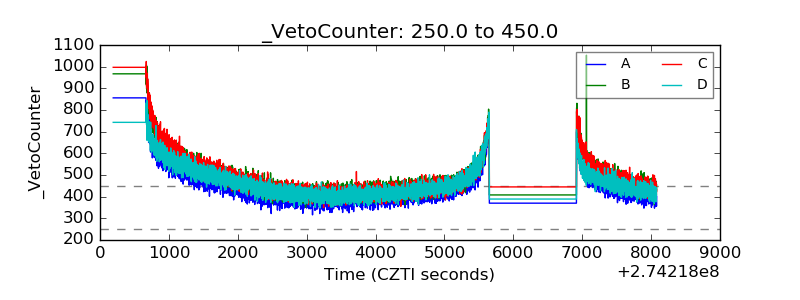 |