| Param | Original file | Final file |
|---|---|---|
| Filename | modeM0/AS1G08_081T01_9000002350_15953cztM0_level2.evt | modeM0/AS1G08_081T01_9000002350_15953cztM0_level2_quad_clean.evt |
| Size (bytes) | 427,495,680 | 91,048,320 |
| Size | 407.7 MB | 86.8 MB |
| Events in quadrant A | 3,190,562 | 580,627 |
| Events in quadrant B | 3,273,341 | 595,890 |
| Events in quadrant C | 3,096,863 | 569,246 |
| Events in quadrant D | 2,943,073 | 557,289 |
| Mode SS | |||
|---|---|---|---|
| Quadrant | BADHDUFLAG | Total packets | Discarded packets |
| A | 0 | 132 | 0 |
| B | 0 | 132 | 0 |
| C | 0 | 132 | 0 |
| D | 0 | 132 | 0 |
| Mode M0 | |||
|---|---|---|---|
| Quadrant | BADHDUFLAG | Total packets | Discarded packets |
| A | 0 | 13898 | 3 |
| B | 0 | 14011 | 2 |
| C | 0 | 13421 | 2 |
| D | 0 | 13424 | 2 |
| Mode M9 | |||
|---|---|---|---|
| Quadrant | BADHDUFLAG | Total packets | Discarded packets |
| A | 0 | 20 | 0 |
| B | 0 | 20 | 0 |
| C | 0 | 20 | 0 |
| D | 0 | 21 | 0 |
| Quadrant | Total seconds | Saturated seconds | Saturation percentage |
|---|---|---|---|
| A | 6514 | 55 | 0.844335% |
| B | 6514 | 24 | 0.368437% |
| C | 6514 | 37 | 0.568007% |
| D | 6514 | 14 | 0.214922% |
Noise dominated data is calculated using 1-second bins in cleaned event files. If a bin has >2000 counts, and if more than 50% of those come from <1% of pixels, then it is considered to be noise-dominated and hence unusable.
| Quadrant | # 1 sec bins | Bins with >0 counts | Bins with >2000 counts | High rate bins dominated by noise | Noise dominated (total time) | Noise dominated (detector-on time) | Marked lightcurve |
|---|---|---|---|---|---|---|---|
| A | 7500 | 6516 | 22 | 22 | 0.29% | 0.34% | 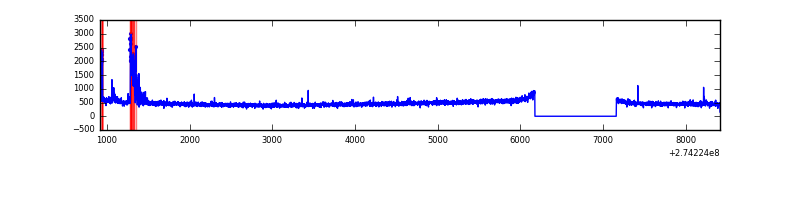 |
| B | 7500 | 6516 | 3 | 3 | 0.04% | 0.05% | 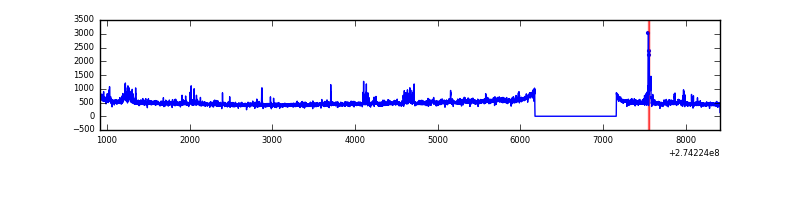 |
| C | 7500 | 6516 | 0 | 0 | 0.00% | 0.00% | 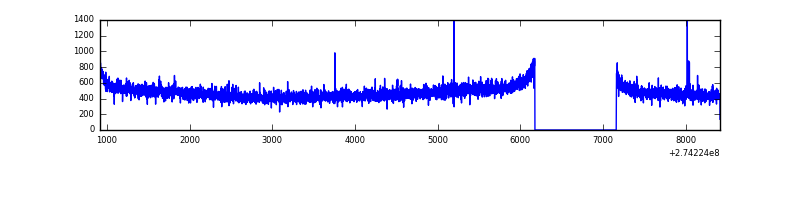 |
| D | 7500 | 6516 | 10 | 10 | 0.13% | 0.15% | 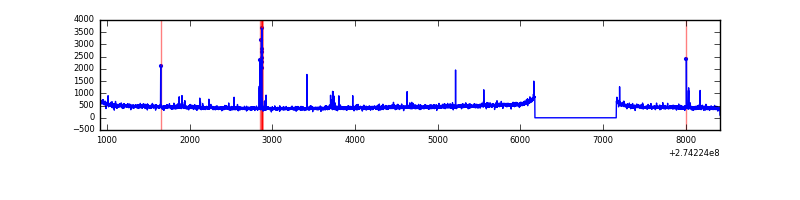 |
Top three noisy pixels from each quadrant. If the there are fewer than three noisy pixels in the level2.evt file, extra rows are filled as -1
| Pixel properties | Quadrant properties | ||||||
|---|---|---|---|---|---|---|---|
| Quadrant | DetID | PixID | Counts | Sigma | Mean | Median | Sigma |
| A | 15 | 239 | 171056 | 1090.32 | 779 | 760 | 156.2 |
| A | 13 | 210 | 21703 | 134.08 | 779 | 760 | 156.2 |
| A | 0 | 226 | 6845 | 38.96 | 779 | 760 | 156.2 |
| B | 15 | 222 | 68771 | 457.47 | 784 | 765 | 148.7 |
| B | 4 | 216 | 41757 | 275.75 | 784 | 765 | 148.7 |
| B | 4 | 173 | 41376 | 273.19 | 784 | 765 | 148.7 |
| C | 14 | 238 | 115510 | 646.33 | 757 | 763 | 177.5 |
| C | 3 | 233 | 22404 | 121.9 | 757 | 763 | 177.5 |
| C | 13 | 61 | 5346 | 25.81 | 757 | 763 | 177.5 |
| D | 10 | 70 | 33239 | 177.18 | 758 | 736 | 183.4 |
| D | 2 | 234 | 28701 | 152.45 | 758 | 736 | 183.4 |
| D | 2 | 152 | 12735 | 65.41 | 758 | 736 | 183.4 |
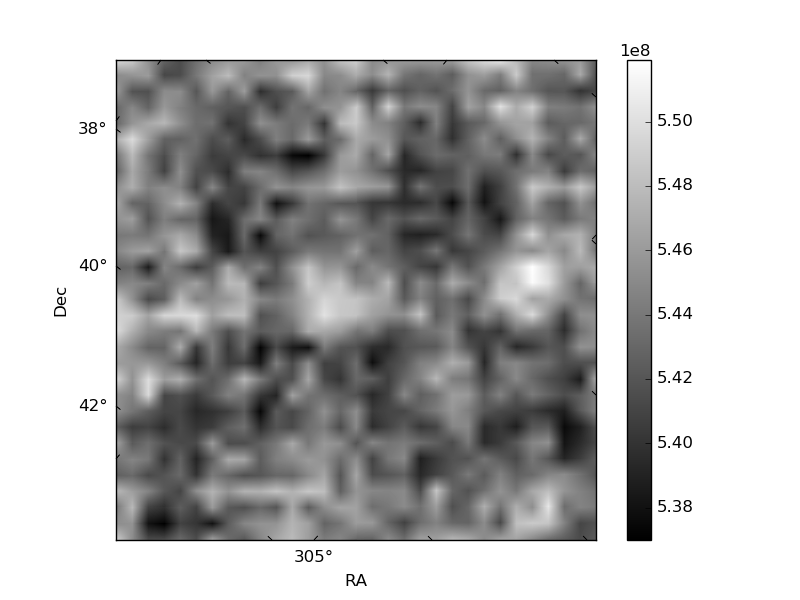
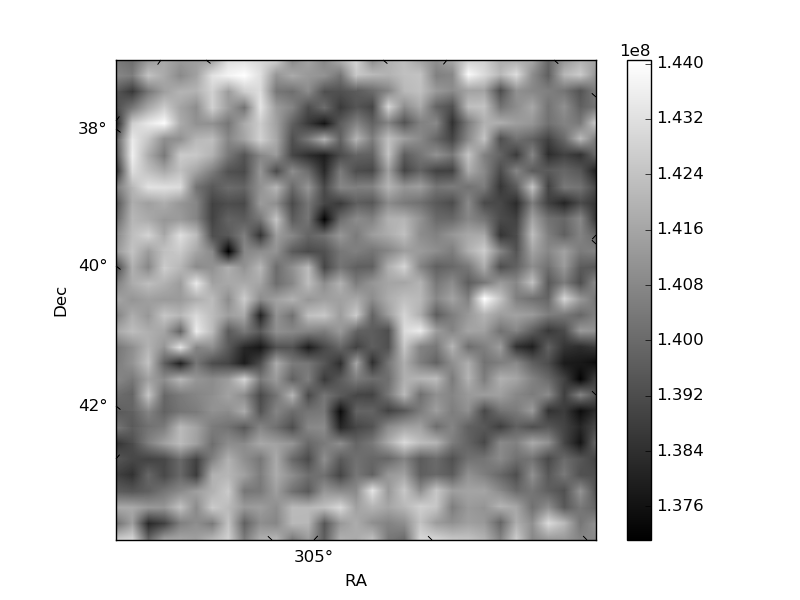
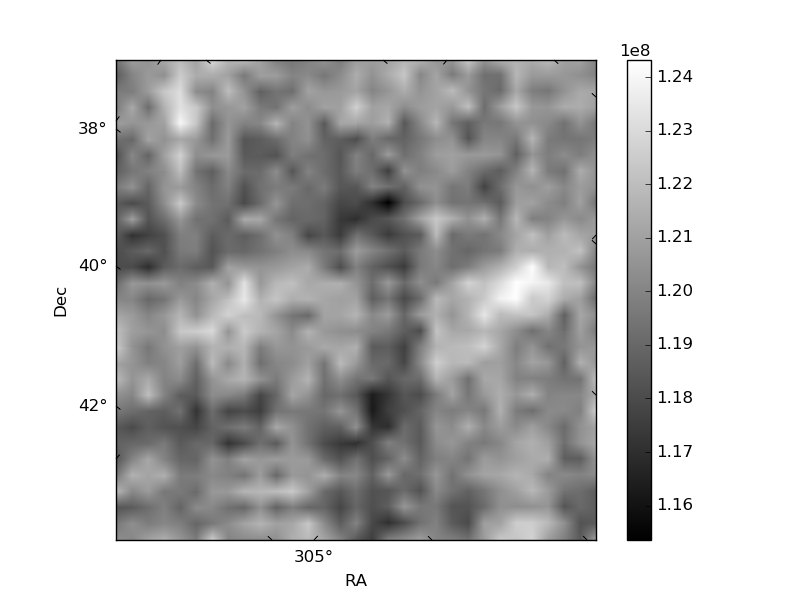
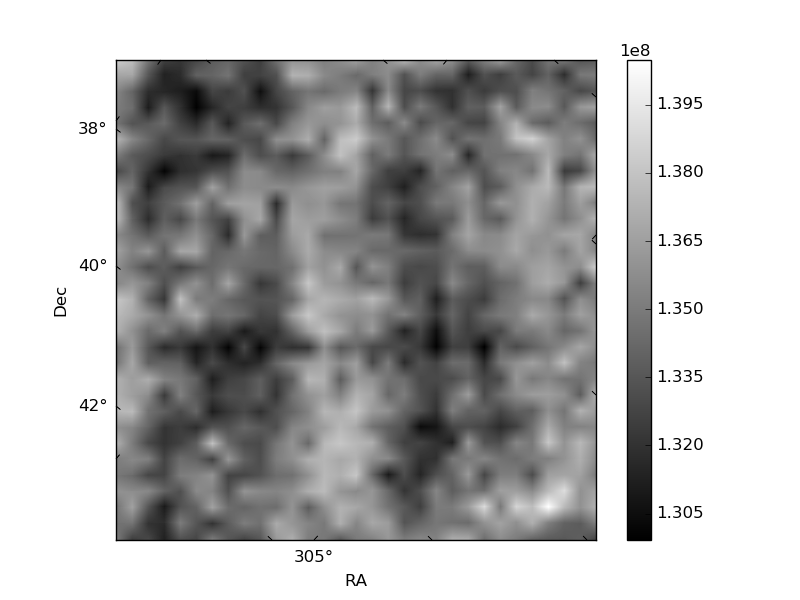
Histogram calculated using DETX and DETY for each event in the final _common_clean file
| Quadrant A | 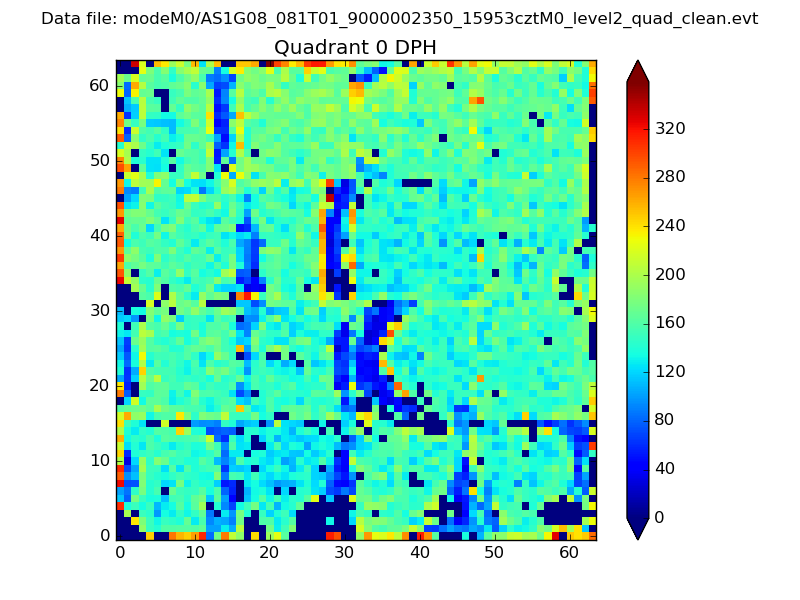 |
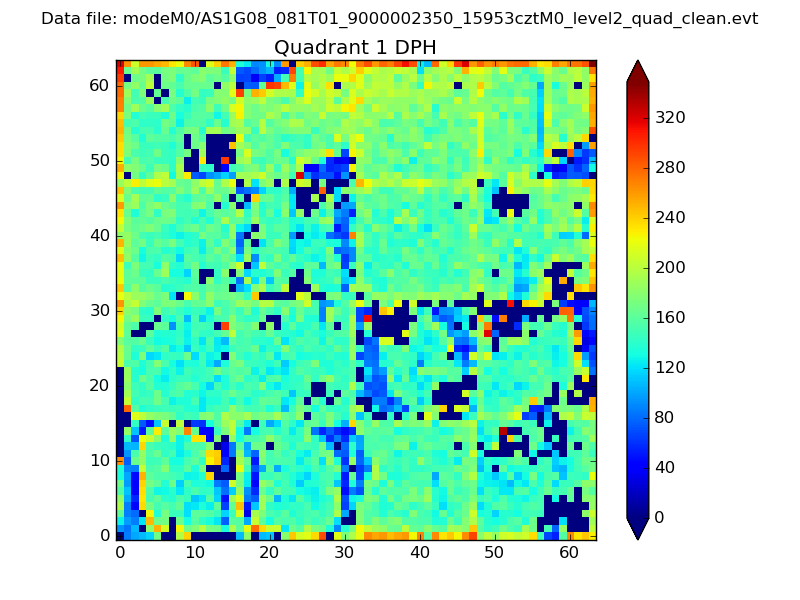 |
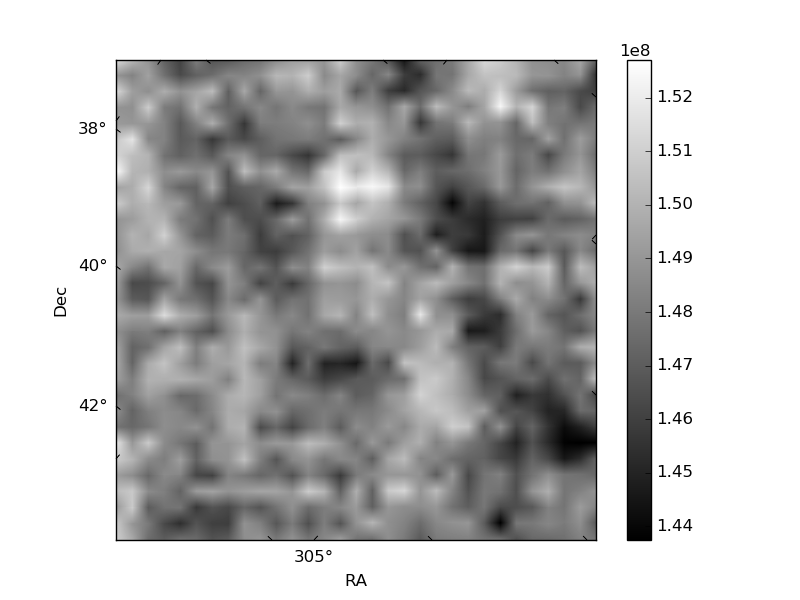
Quadrant B |
|---|---|---|---|
| Quadrant D | 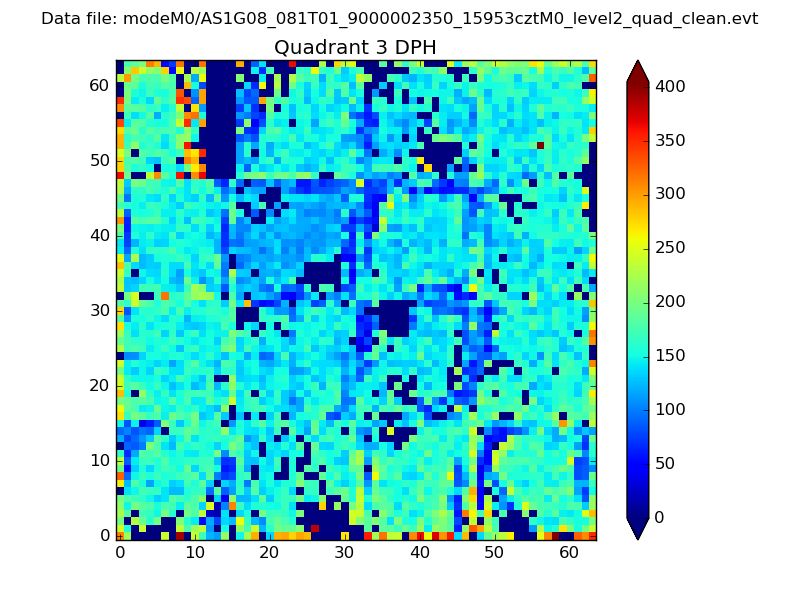 |
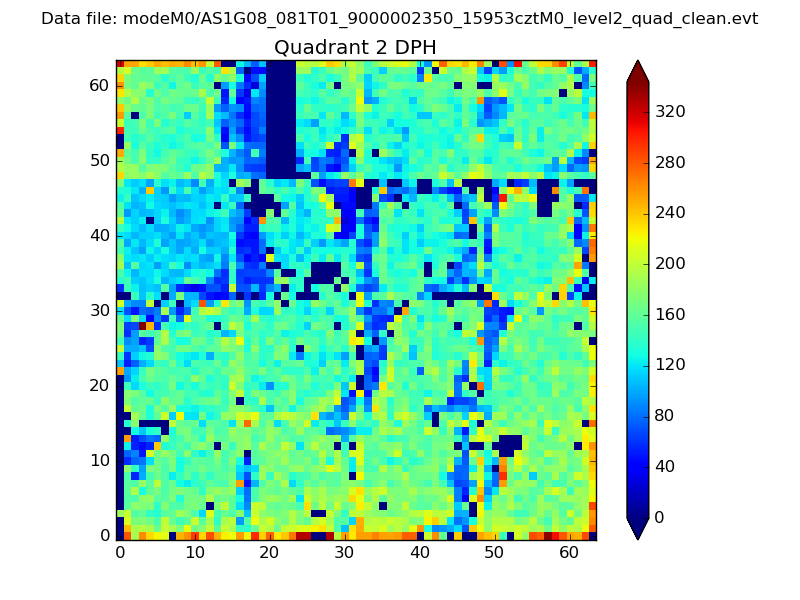 |
Quadrant C |
| Plot type | Count rate plots | Images |
|---|---|---|
| Comparison with Poisson distribution Blue bars denote a histogram of data divided into 1 sec bins. Red curve is a Poisson curve with rate = median count rate of data. |
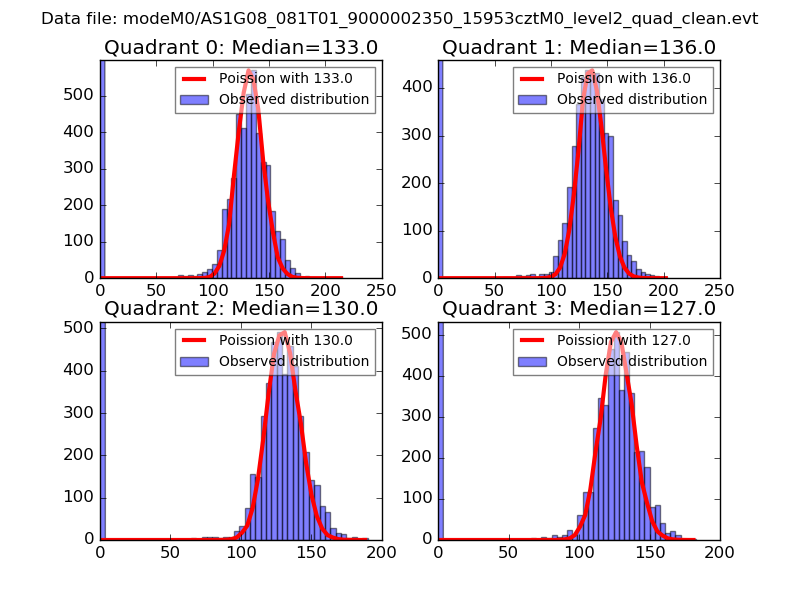 |
 |
| Quadrant-wise count rates Data is divided into 100 sec bins |
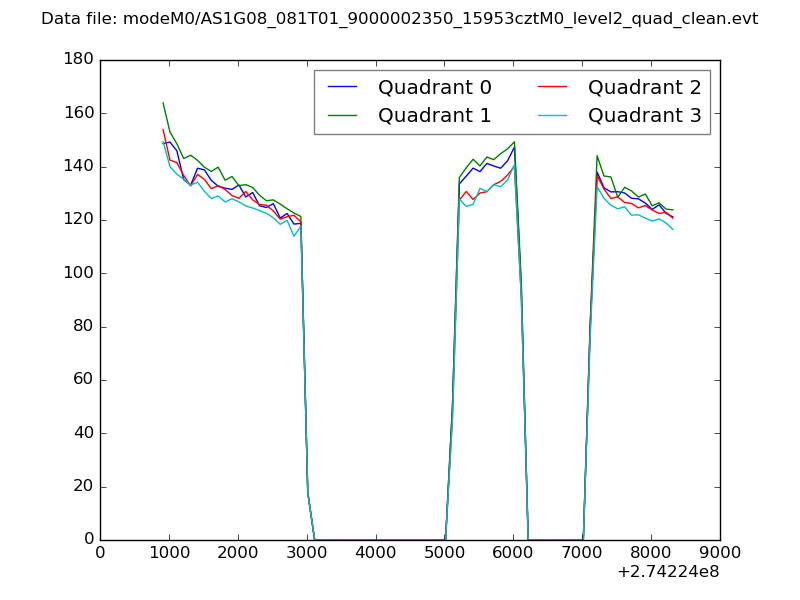 |
|
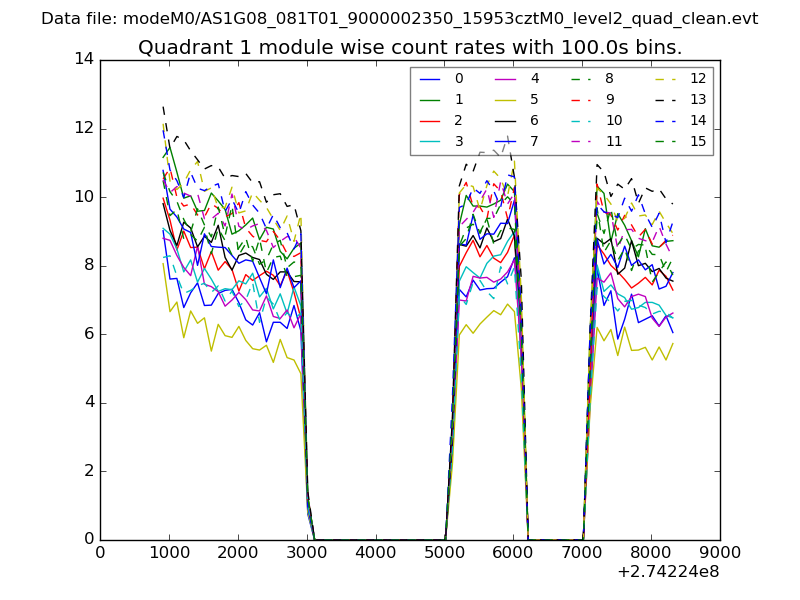
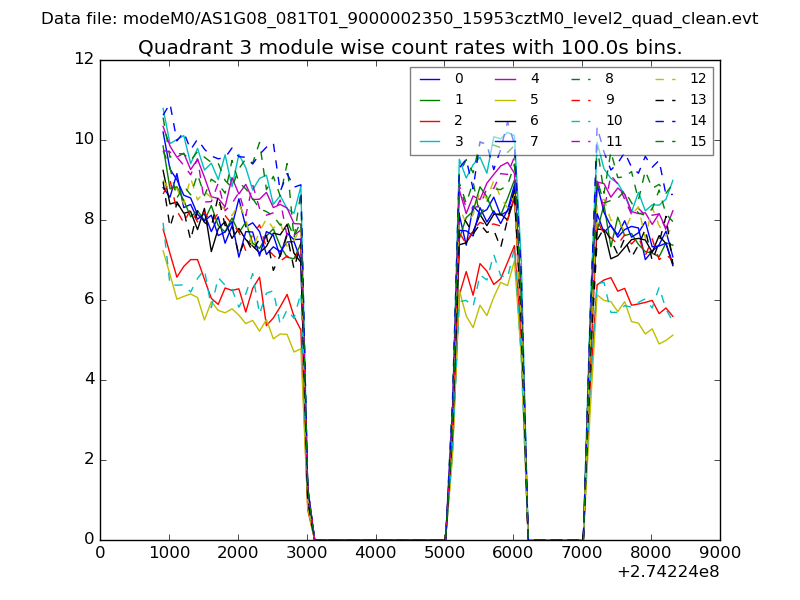
| Module-wise count rates for Quadrant A Data is divided into 100 sec bins |
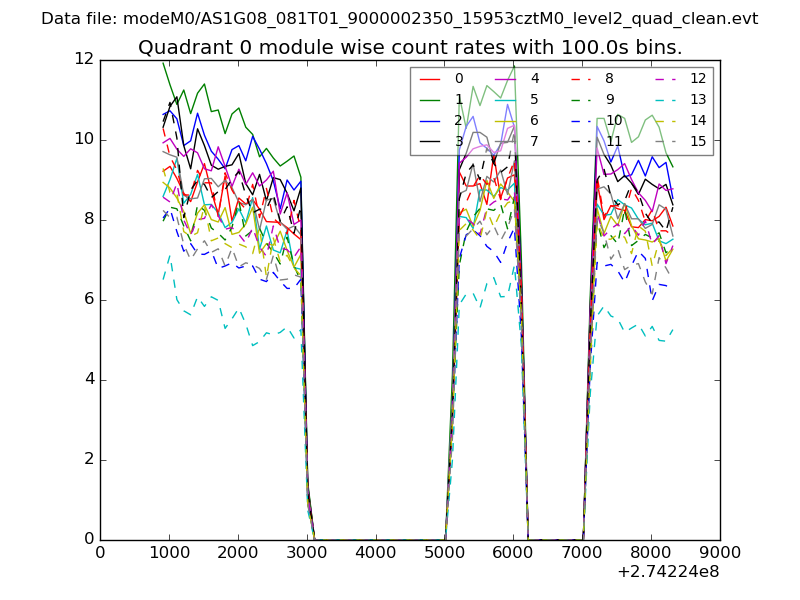 |
 |
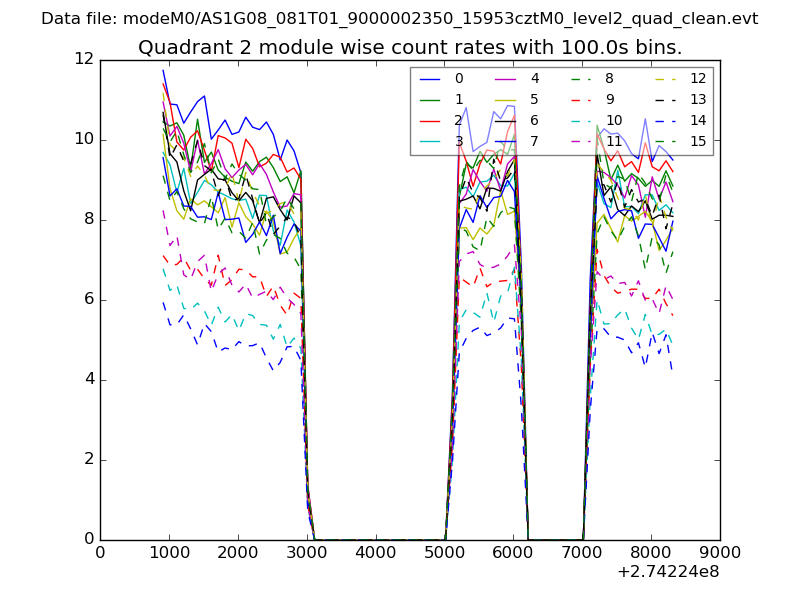
| Module-wise count rates for Quadrant B Data is divided into 100 sec bins |
 |
 |
| Module-wise count rates for Quadrant C Data is divided into 100 sec bins |
 |
 |
| Module-wise count rates for Quadrant D Data is divided into 100 sec bins |
 |
 |
| Parameter | Plot |
|---|---|
| CZT HV Monitor | 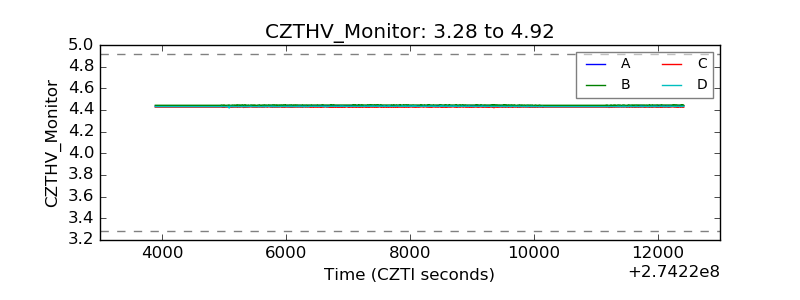 |
| D_VDD | 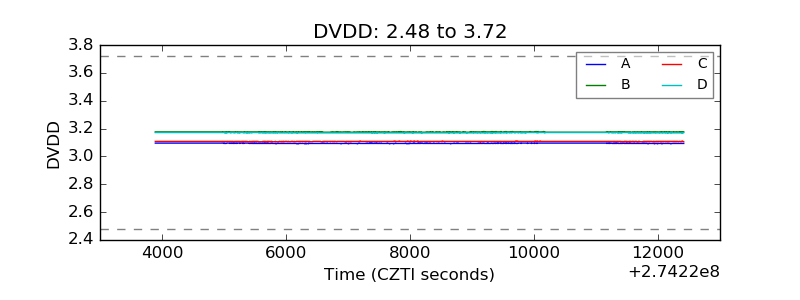 |
| Temperature 1 | 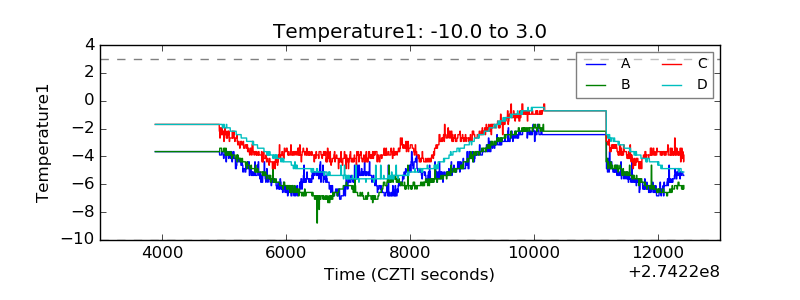 |
| Veto HV Monitor | 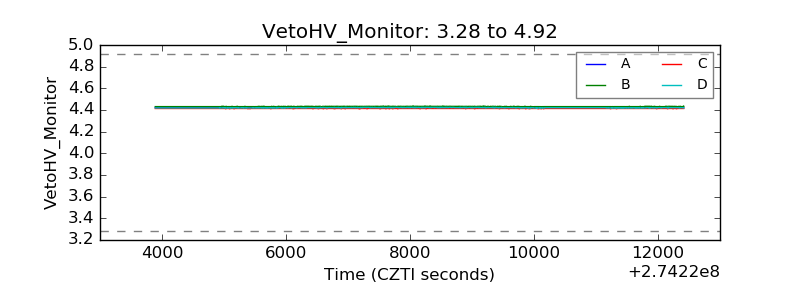 |
| Veto LLD | 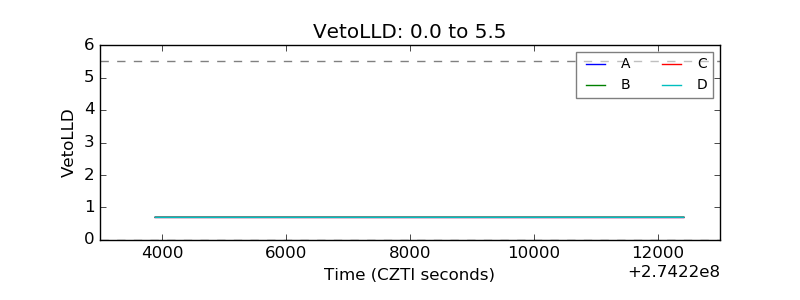 |
| Alpha Counter | 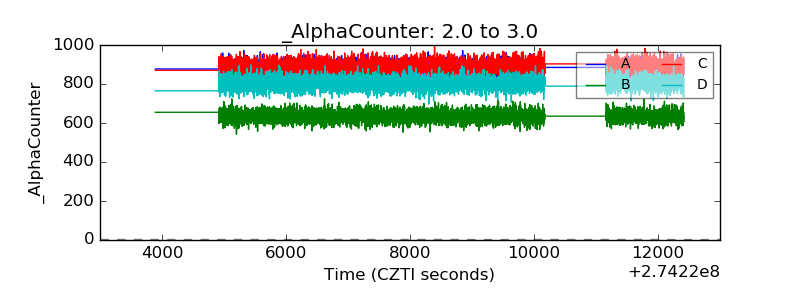 |
| _CPM_Rate | 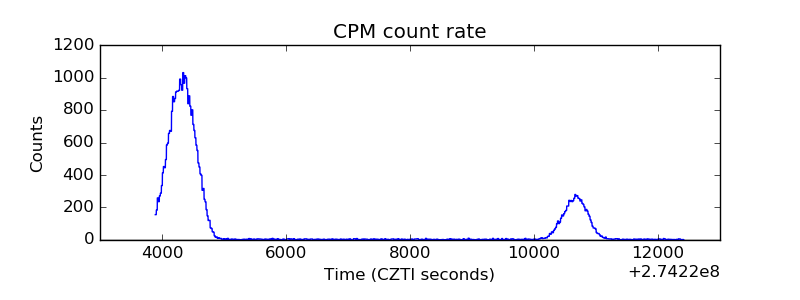 |
| CZT Counter | 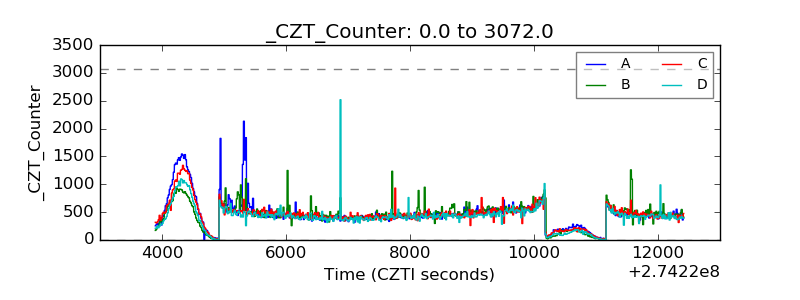 |
| +2.5 Volts monitor |  |
| +5 Volts monitor |  |
| _ROLL_ROT | 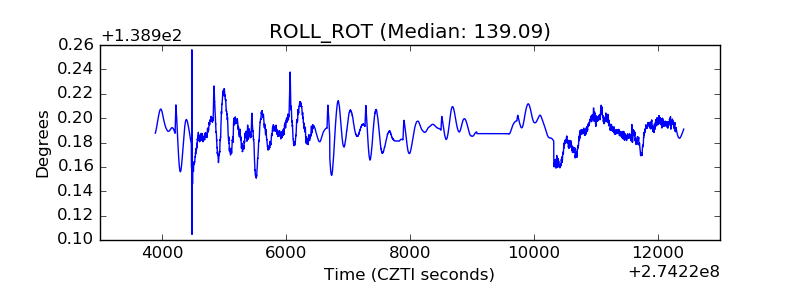 |
| _Roll_DEC | 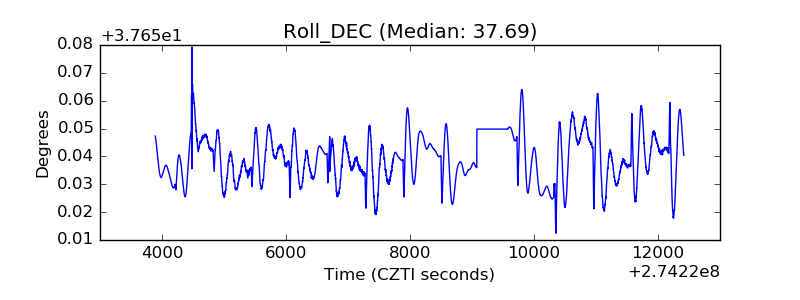 |
| _Roll_RA | 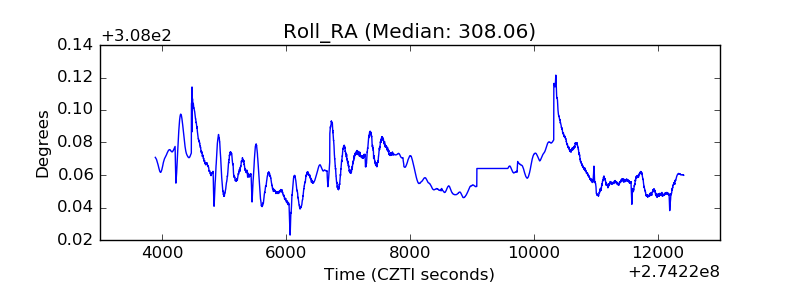 |
| Veto Counter | 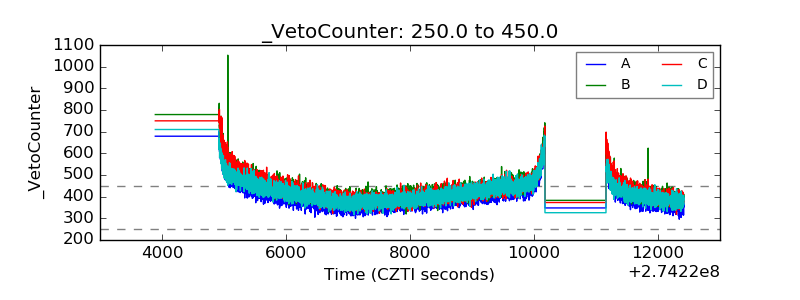 |