| Param | Original file | Final file |
|---|---|---|
| Filename | modeM0/AS1G08_081T01_9000002350_15954cztM0_level2.evt | modeM0/AS1G08_081T01_9000002350_15954cztM0_level2_quad_clean.evt |
| Size (bytes) | 527,523,840 | 111,026,880 |
| Size | 503.1 MB | 105.9 MB |
| Events in quadrant A | 4,025,757 | 711,649 |
| Events in quadrant B | 3,942,845 | 724,631 |
| Events in quadrant C | 3,828,652 | 698,684 |
| Events in quadrant D | 3,650,455 | 686,271 |
| Mode SS | |||
|---|---|---|---|
| Quadrant | BADHDUFLAG | Total packets | Discarded packets |
| A | 0 | 160 | 0 |
| B | 0 | 160 | 0 |
| C | 0 | 160 | 0 |
| D | 0 | 160 | 0 |
| Mode M0 | |||
|---|---|---|---|
| Quadrant | BADHDUFLAG | Total packets | Discarded packets |
| A | 0 | 17174 | 3 |
| B | 0 | 16848 | 2 |
| C | 0 | 16462 | 2 |
| D | 0 | 16412 | 2 |
| Mode M9 | |||
|---|---|---|---|
| Quadrant | BADHDUFLAG | Total packets | Discarded packets |
| A | 0 | 15 | 0 |
| B | 0 | 15 | 0 |
| C | 0 | 15 | 0 |
| D | 0 | 15 | 0 |
| Quadrant | Total seconds | Saturated seconds | Saturation percentage |
|---|---|---|---|
| A | 7783 | 40 | 0.513941% |
| B | 7783 | 78 | 1.002184% |
| C | 7783 | 91 | 1.169215% |
| D | 7783 | 23 | 0.295516% |
Noise dominated data is calculated using 1-second bins in cleaned event files. If a bin has >2000 counts, and if more than 50% of those come from <1% of pixels, then it is considered to be noise-dominated and hence unusable.
| Quadrant | # 1 sec bins | Bins with >0 counts | Bins with >2000 counts | High rate bins dominated by noise | Noise dominated (total time) | Noise dominated (detector-on time) | Marked lightcurve |
|---|---|---|---|---|---|---|---|
| A | 9284 | 7786 | 1 | 1 | 0.01% | 0.01% | 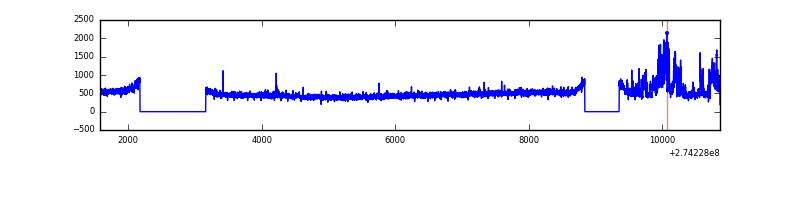 |
| B | 9284 | 7786 | 9 | 9 | 0.10% | 0.12% | 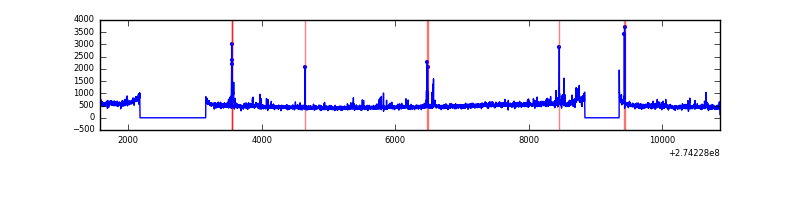 |
| C | 9284 | 7786 | 8 | 8 | 0.09% | 0.10% | 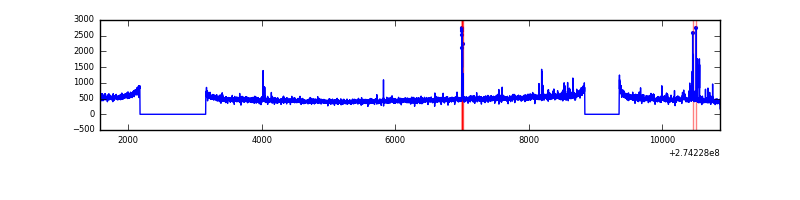 |
| D | 9284 | 7786 | 15 | 15 | 0.16% | 0.19% | 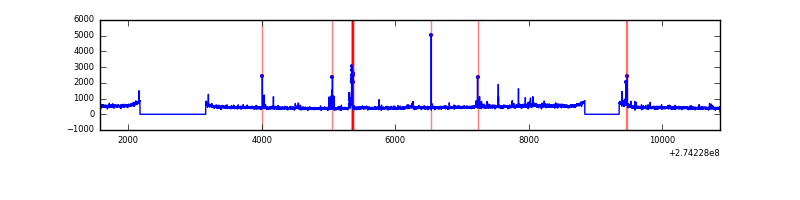 |
Top three noisy pixels from each quadrant. If the there are fewer than three noisy pixels in the level2.evt file, extra rows are filled as -1
| Pixel properties | Quadrant properties | ||||||
|---|---|---|---|---|---|---|---|
| Quadrant | DetID | PixID | Counts | Sigma | Mean | Median | Sigma |
| A | 13 | 210 | 421329 | 2215.09 | 934 | 911 | 189.8 |
| A | 0 | 226 | 8310 | 38.98 | 934 | 911 | 189.8 |
| A | 12 | 194 | 6889 | 31.49 | 934 | 911 | 189.8 |
| B | 15 | 222 | 60933 | 332.99 | 938 | 914 | 180.2 |
| B | 5 | 65 | 55796 | 304.49 | 938 | 914 | 180.2 |
| B | 0 | 189 | 43487 | 236.2 | 938 | 914 | 180.2 |
| C | 14 | 238 | 137170 | 637.88 | 908 | 915 | 213.6 |
| C | 9 | 236 | 75498 | 349.16 | 908 | 915 | 213.6 |
| C | 3 | 233 | 64789 | 299.03 | 908 | 915 | 213.6 |
| D | 2 | 33 | 89597 | 399.71 | 913 | 886 | 221.9 |
| D | 2 | 152 | 38276 | 168.47 | 913 | 886 | 221.9 |
| D | 2 | 234 | 33705 | 147.87 | 913 | 886 | 221.9 |
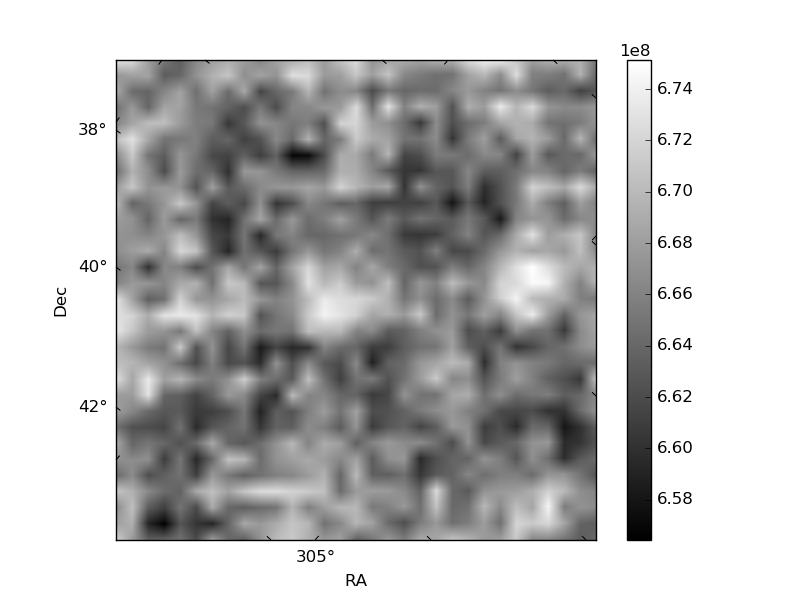
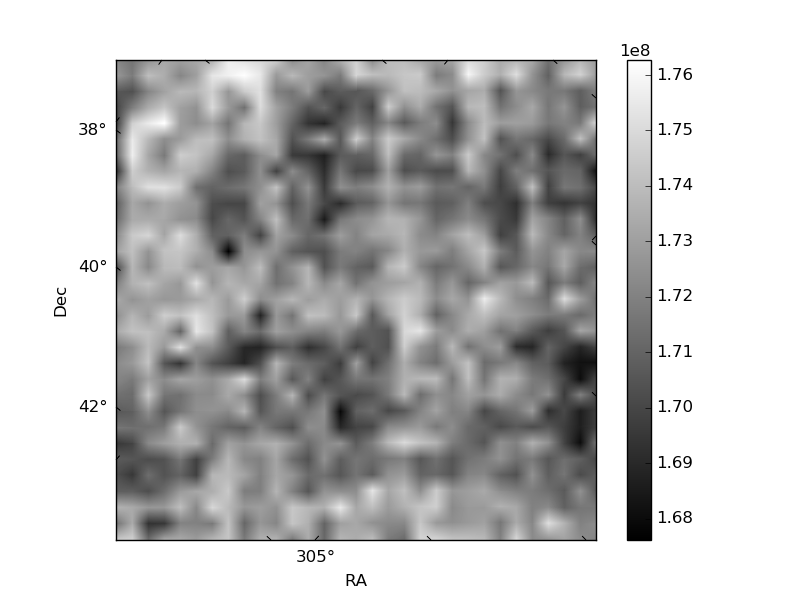
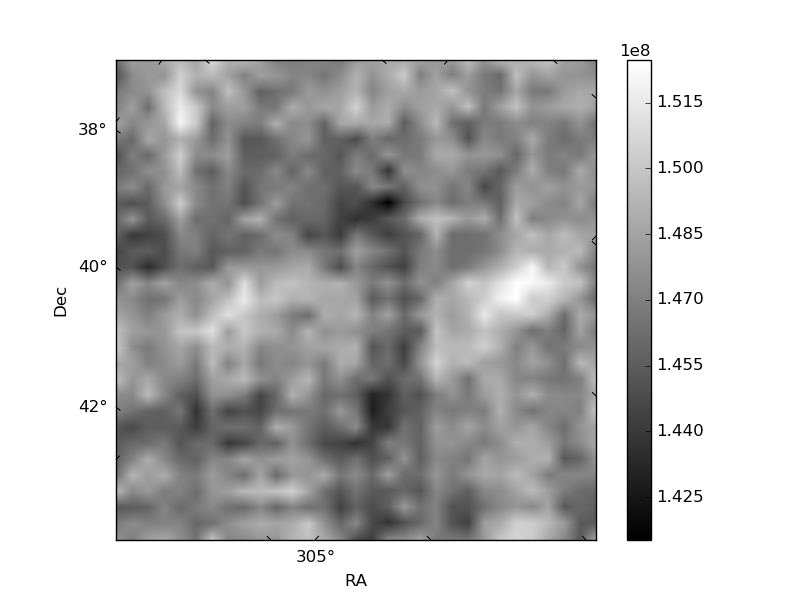
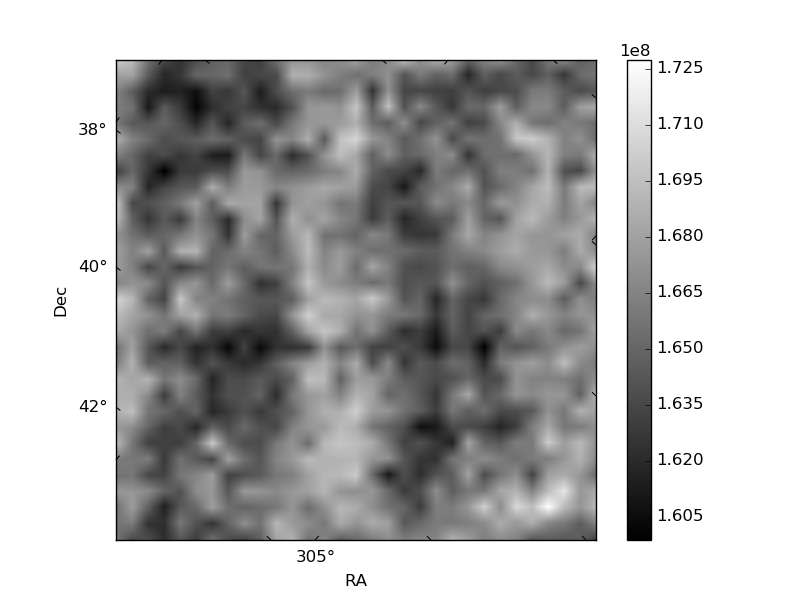
Histogram calculated using DETX and DETY for each event in the final _common_clean file
| Quadrant A | 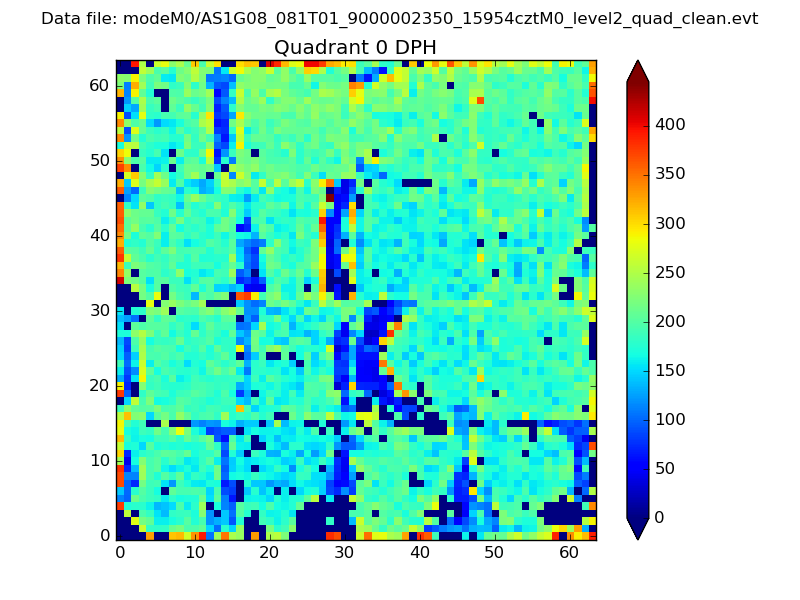 |
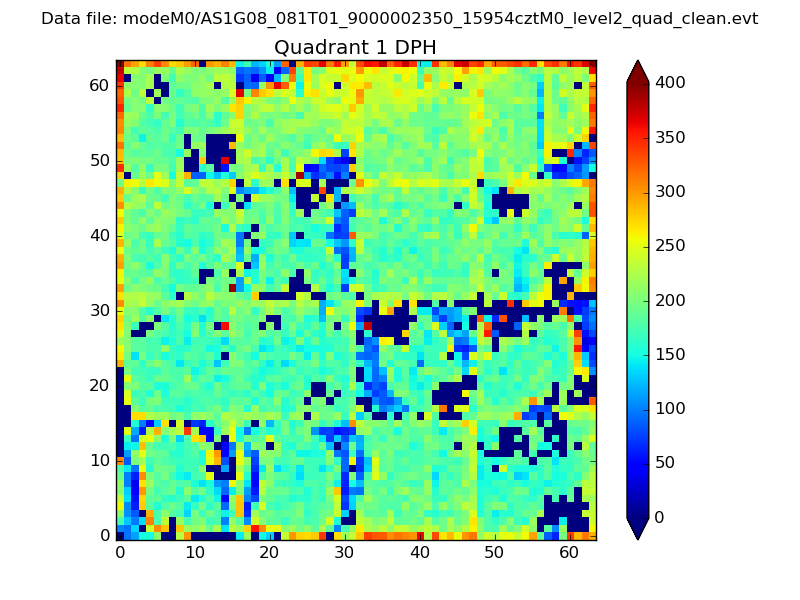 |
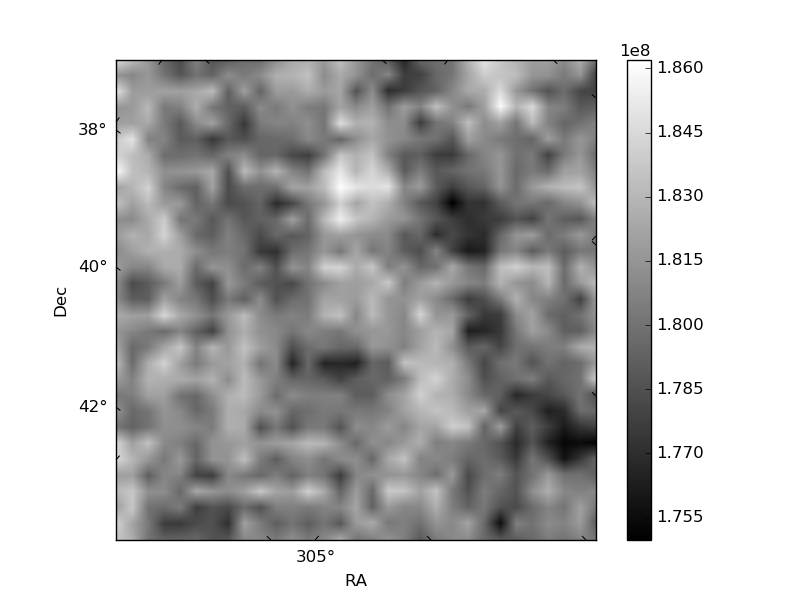
Quadrant B |
|---|---|---|---|
| Quadrant D | 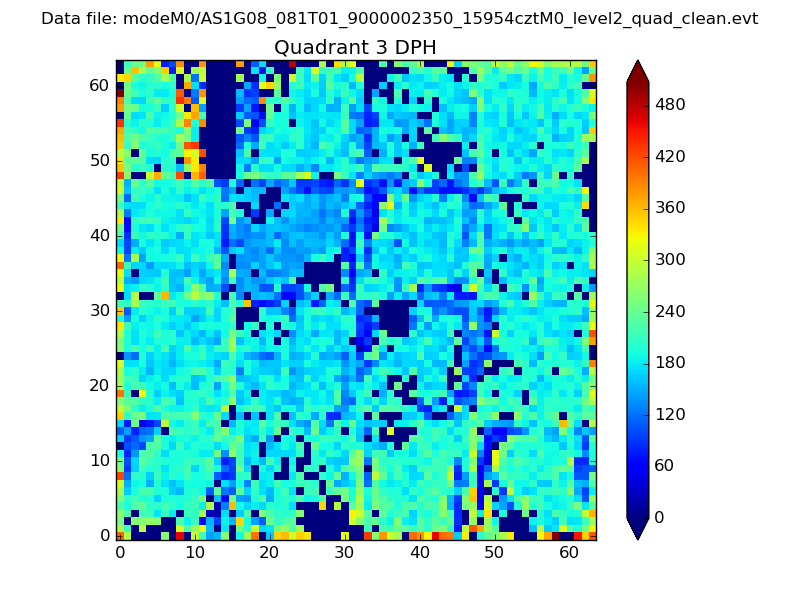 |
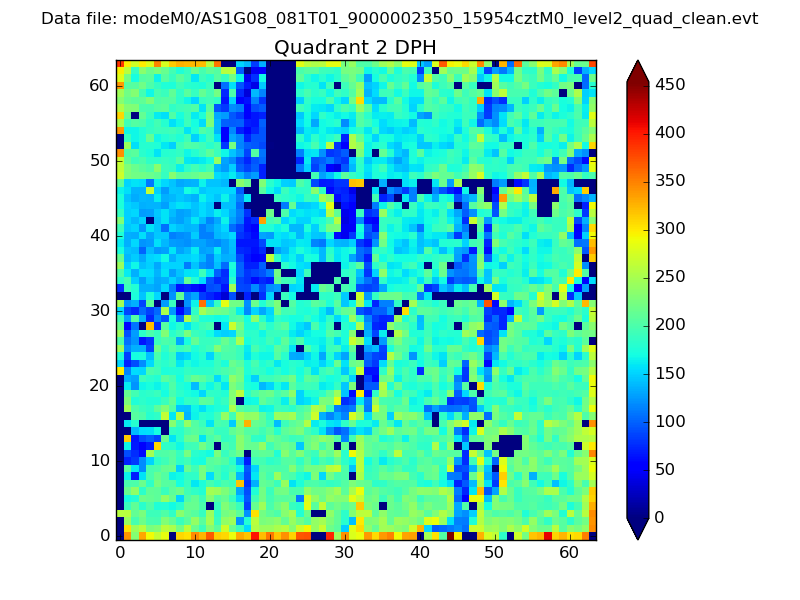 |
Quadrant C |
| Plot type | Count rate plots | Images |
|---|---|---|
| Comparison with Poisson distribution Blue bars denote a histogram of data divided into 1 sec bins. Red curve is a Poisson curve with rate = median count rate of data. |
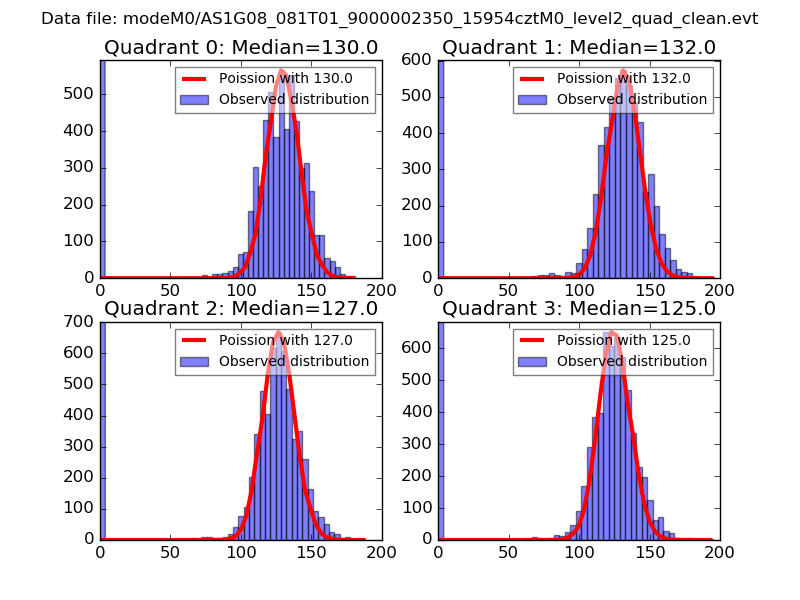 |
 |
| Quadrant-wise count rates Data is divided into 100 sec bins |
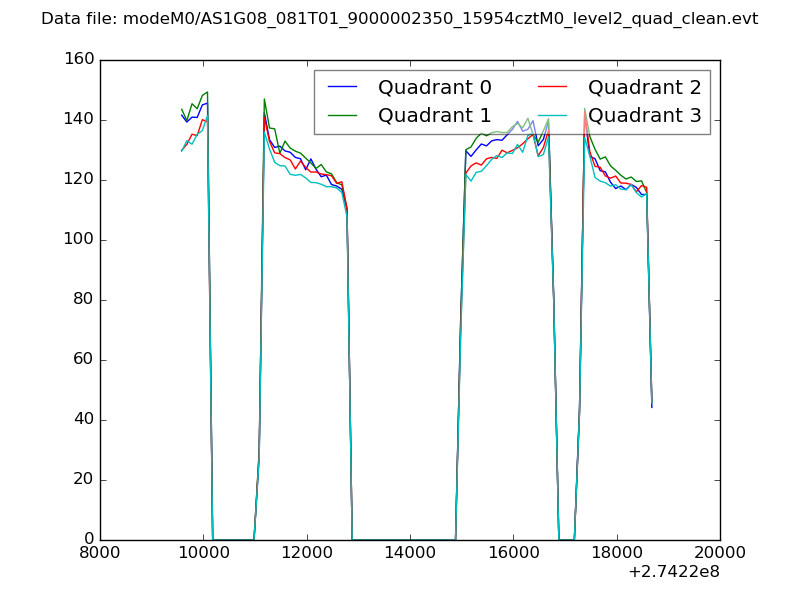 |
|
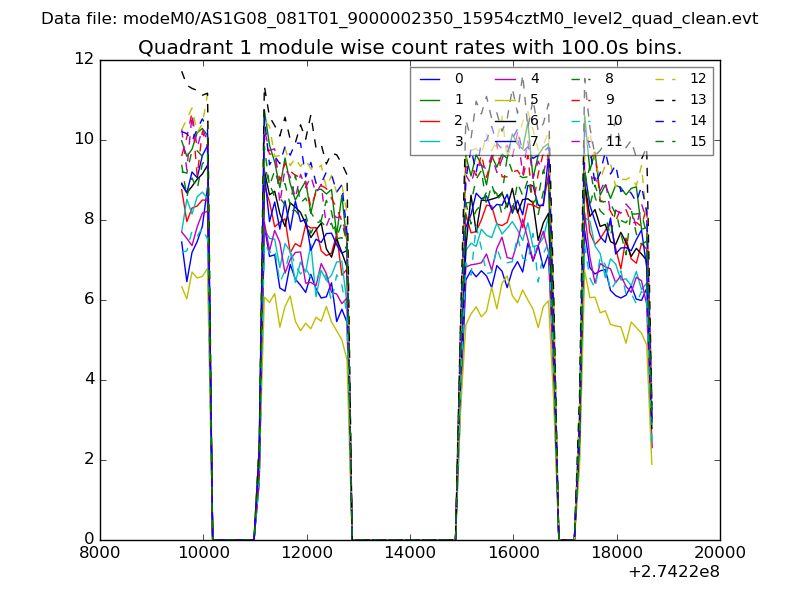
| Module-wise count rates for Quadrant A Data is divided into 100 sec bins |
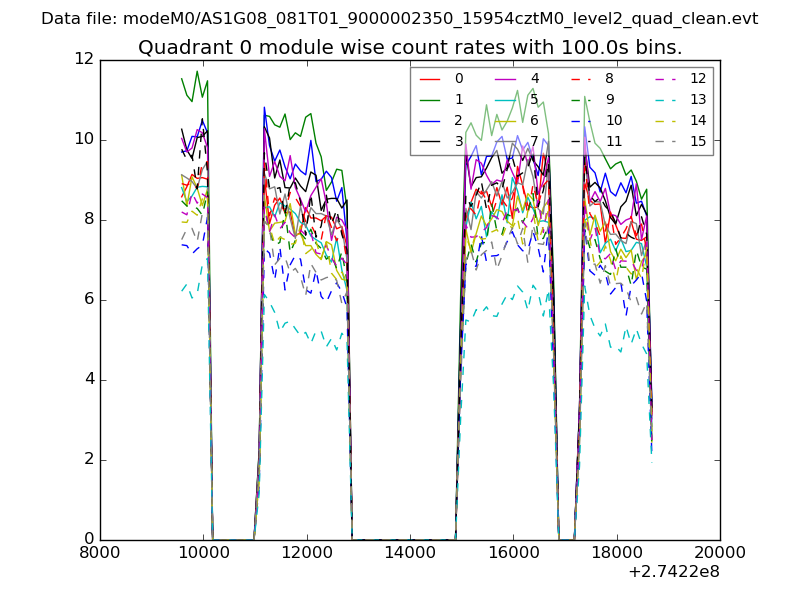 |
 |
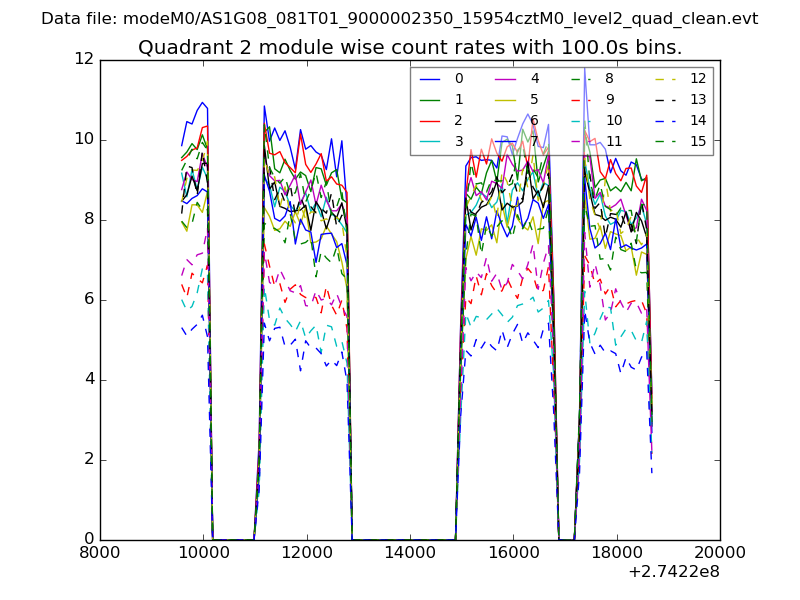
| Module-wise count rates for Quadrant B Data is divided into 100 sec bins |
 |
 |
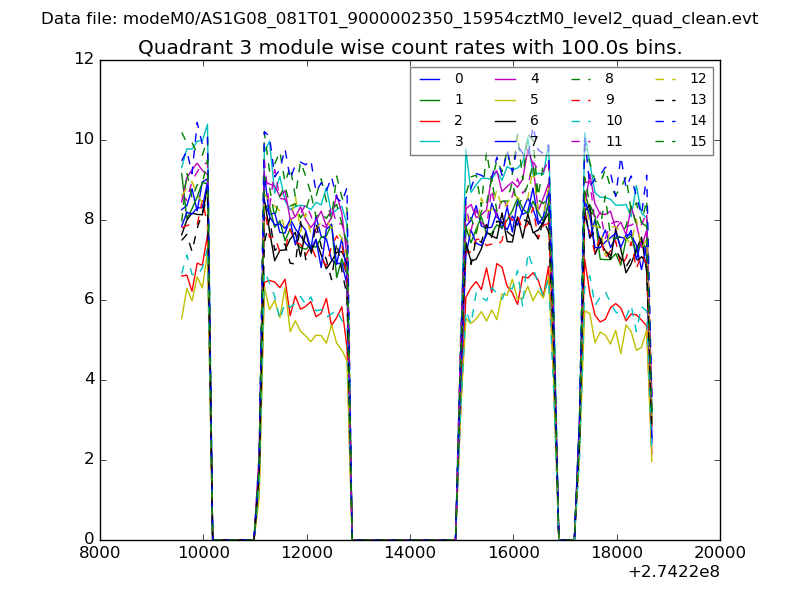
| Module-wise count rates for Quadrant C Data is divided into 100 sec bins |
 |
 |
| Module-wise count rates for Quadrant D Data is divided into 100 sec bins |
 |
 |
| Parameter | Plot |
|---|---|
| CZT HV Monitor | 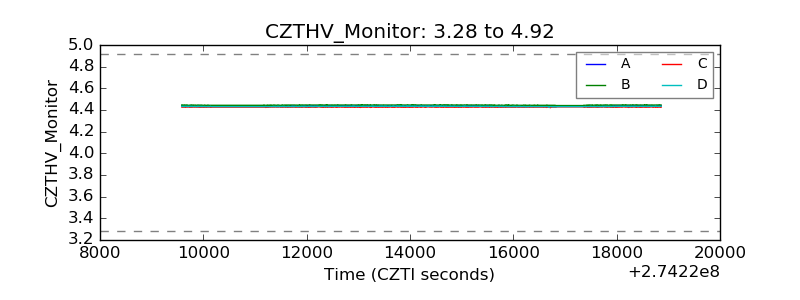 |
| D_VDD | 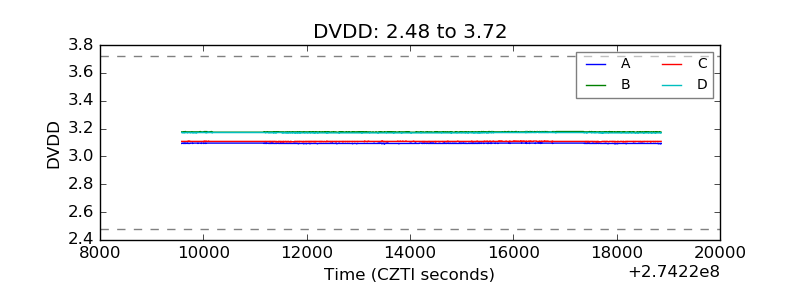 |
| Temperature 1 | 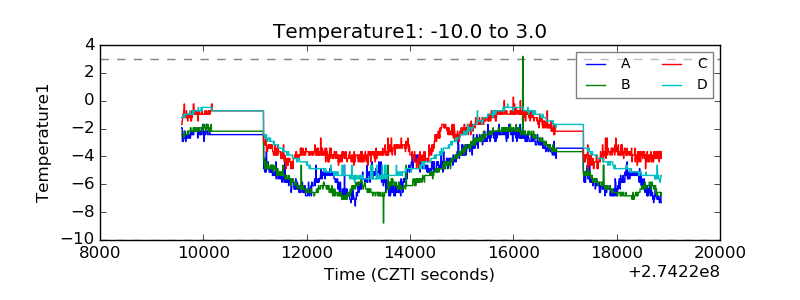 |
| Veto HV Monitor | 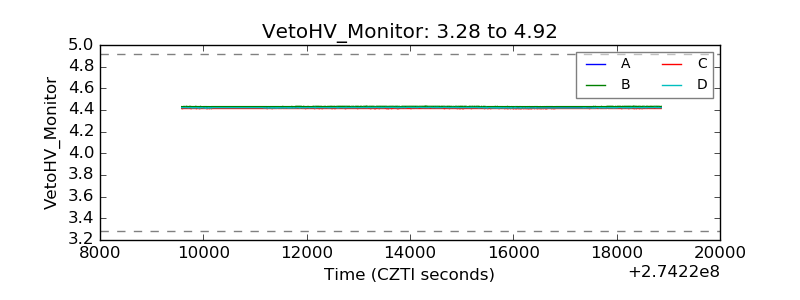 |
| Veto LLD | 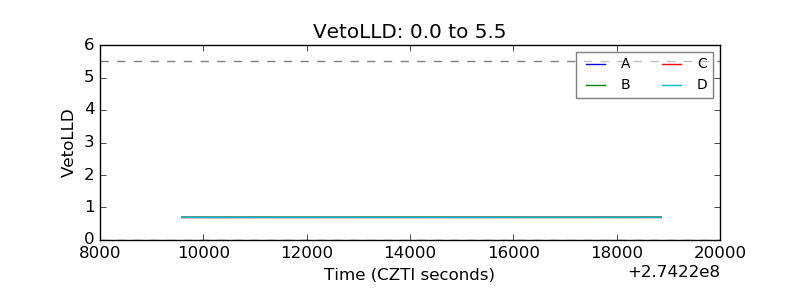 |
| Alpha Counter | 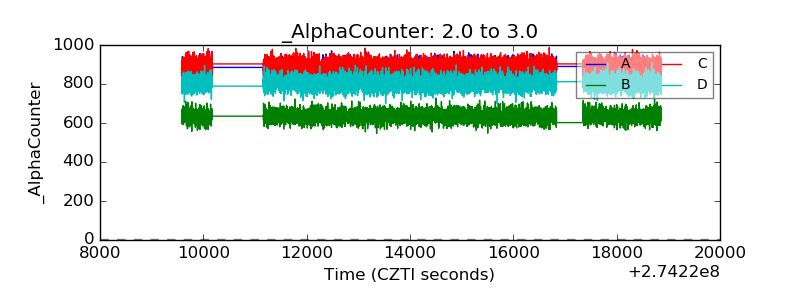 |
| _CPM_Rate | 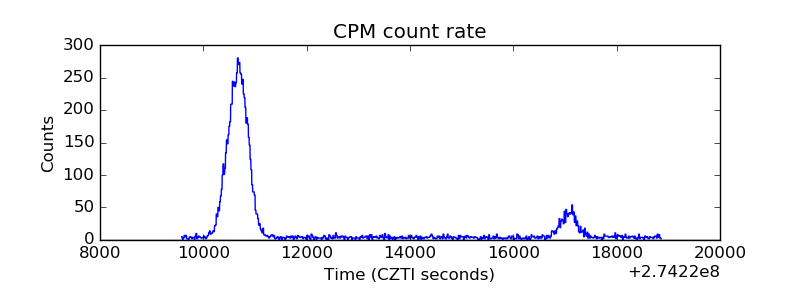 |
| CZT Counter | 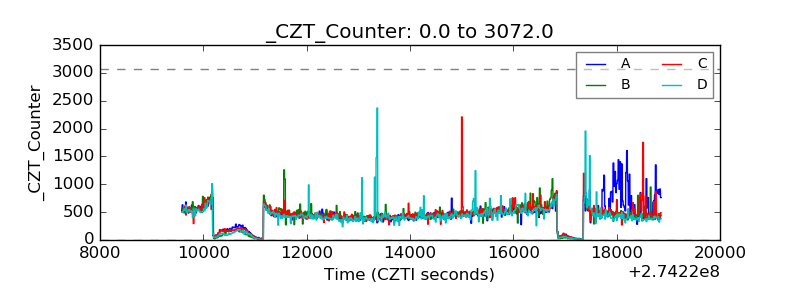 |
| +2.5 Volts monitor | 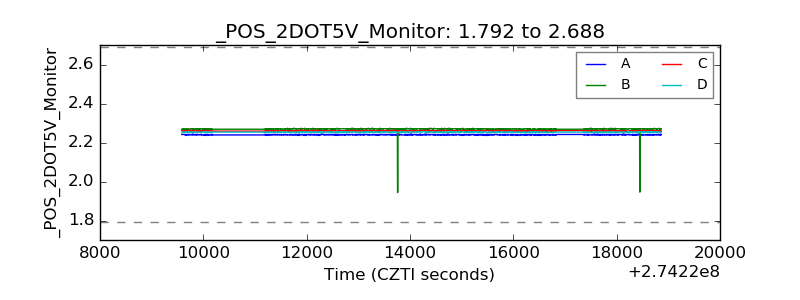 |
| +5 Volts monitor | 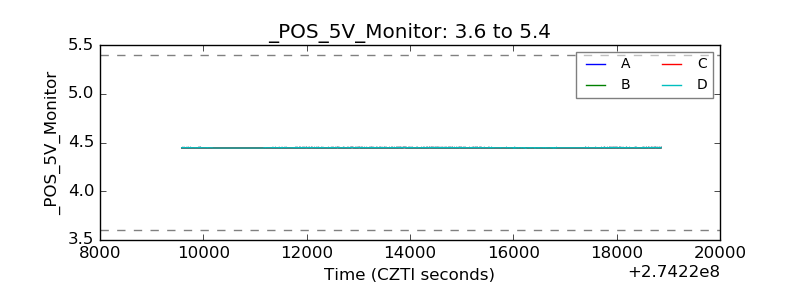 |
| _ROLL_ROT | 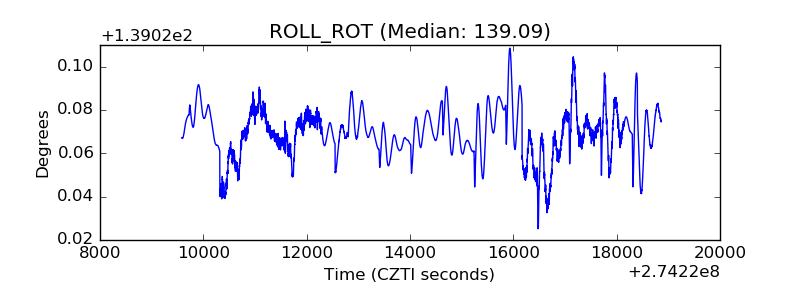 |
| _Roll_DEC |  |
| _Roll_RA | 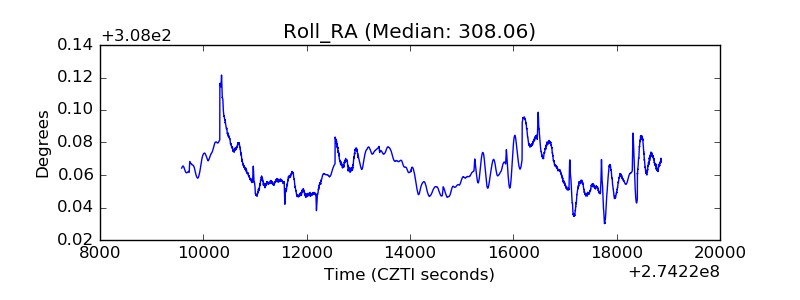 |
| Veto Counter | 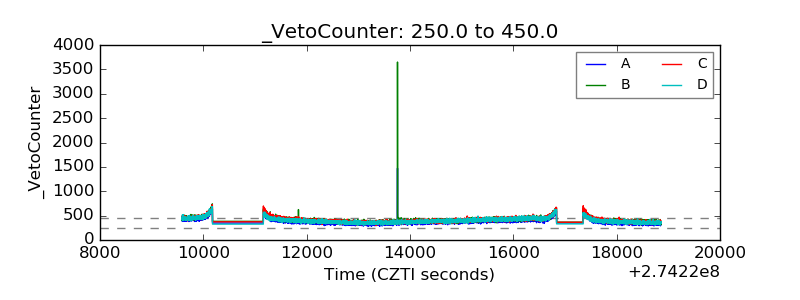 |