| Param | Original file | Final file |
|---|---|---|
| Filename | modeM0/AS1T02_087T01_9000002352cztM0_level2.fits | modeM0/AS1T02_087T01_9000002352cztM0_level2_quad_clean.evt |
| Size (bytes) | 642,464,640 | 531,846,720 |
| Size | 612.7 MB | 507.2 MB |
| Events in quadrant A | 3,932,944 | 3,018,269 |
| Events in quadrant B | 3,764,076 | 3,003,265 |
| Events in quadrant C | 3,808,246 | 2,846,926 |
| Events in quadrant D | 3,349,120 | 2,634,761 |
| Mode M0 | |||
|---|---|---|---|
| Quadrant | BADHDUFLAG | Total packets | Discarded packets |
| A | 0 | 139425 | 0 |
| B | 0 | 145423 | 0 |
| C | 0 | 139446 | 0 |
| D | 0 | 138082 | 0 |
| Mode M9 | |||
|---|---|---|---|
| Quadrant | BADHDUFLAG | Total packets | Discarded packets |
| A | 0 | 144 | 0 |
| B | 0 | 144 | 0 |
| C | 0 | 144 | 0 |
| D | 0 | 144 | 0 |
| Mode SS | |||
|---|---|---|---|
| Quadrant | BADHDUFLAG | Total packets | Discarded packets |
| A | 0 | 1936 | 0 |
| B | 0 | 1936 | 0 |
| C | 0 | 1936 | 0 |
| D | 0 | 1338 | 0 |
| Quadrant | Total seconds | Saturated seconds | Saturation percentage |
|---|---|---|---|
| A | 65707 | 982 | 1.494514% |
| B | 65691 | 1176 | 1.790200% |
| C | 65681 | 1227 | 1.868120% |
| D | 65670 | 609 | 0.927364% |
Noise dominated data is calculated using 1-second bins in cleaned event files. If a bin has >2000 counts, and if more than 50% of those come from <1% of pixels, then it is considered to be noise-dominated and hence unusable.
| Quadrant | # 1 sec bins | Bins with >0 counts | Bins with >2000 counts | High rate bins dominated by noise | Noise dominated (total time) | Noise dominated (detector-on time) | Marked lightcurve |
|---|---|---|---|---|---|---|---|
| A | 77126 | 65706 | 0 | 0 | 0.00% | 0.00% |  |
| B | 77126 | 65687 | 0 | 0 | 0.00% | 0.00% |  |
| C | 77126 | 65670 | 0 | 0 | 0.00% | 0.00% |  |
| D | 77126 | 65671 | 0 | 0 | 0.00% | 0.00% |  |
Top three noisy pixels from each quadrant. If the there are fewer than three noisy pixels in the level2.evt file, extra rows are filled as -1
| Pixel properties | Quadrant properties | ||||||
|---|---|---|---|---|---|---|---|
| Quadrant | DetID | PixID | Counts | Sigma | Mean | Median | Sigma |
| A | 0 | 29 | 3783 | 11.14 | 1023 | 958 | 253.6 |
| A | 7 | 110 | 3229 | 8.95 | 1023 | 958 | 253.6 |
| A | 15 | 236 | 2930 | 7.78 | 1023 | 958 | 253.6 |
| B | 2 | 9 | 3070 | 10.84 | 994 | 949 | 195.7 |
| B | 2 | 8 | 2595 | 8.41 | 994 | 949 | 195.7 |
| B | 14 | 254 | 2473 | 7.79 | 994 | 949 | 195.7 |
| C | 1 | 80 | 2898 | 7.56 | 1006 | 937 | 259.5 |
| C | 1 | 81 | 2893 | 7.54 | 1006 | 937 | 259.5 |
| C | 12 | 241 | 2608 | 6.44 | 1006 | 937 | 259.5 |
| D | 6 | 231 | 2457 | 6.28 | 955 | 869 | 252.8 |
| D | 3 | 14 | 2445 | 6.23 | 955 | 869 | 252.8 |
| D | 10 | 189 | 2359 | 5.89 | 955 | 869 | 252.8 |
Histogram calculated using DETX and DETY for each event in the final _common_clean file
| Quadrant A |  |
 |
Quadrant B |
|---|---|---|---|
| Quadrant D |  |
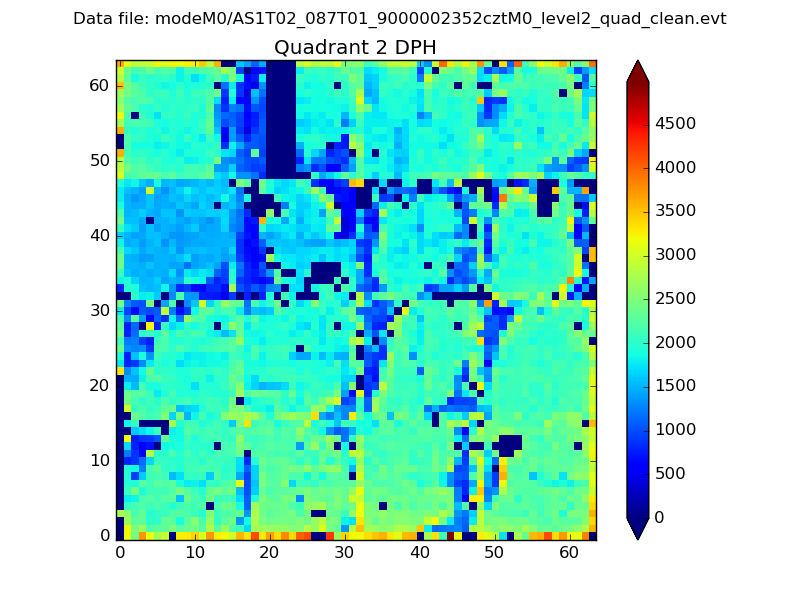 |
Quadrant C |
| Plot type | Count rate plots | Images |
|---|---|---|
| Comparison with Poisson distribution Blue bars denote a histogram of data divided into 1 sec bins. Red curve is a Poisson curve with rate = median count rate of data. |
 |
 |
| Quadrant-wise count rates Data is divided into 100 sec bins |
 |
|
| Module-wise count rates for Quadrant A Data is divided into 100 sec bins |
 |
 |
| Module-wise count rates for Quadrant B Data is divided into 100 sec bins |
 |
 |
| Module-wise count rates for Quadrant C Data is divided into 100 sec bins |
 |
 |
| Module-wise count rates for Quadrant D Data is divided into 100 sec bins |
 |
 |
| Parameter | Plot |
|---|---|
| CZT HV Monitor |  |
| D_VDD |  |
| Temperature 1 |  |
| Veto HV Monitor |  |
| Veto LLD | 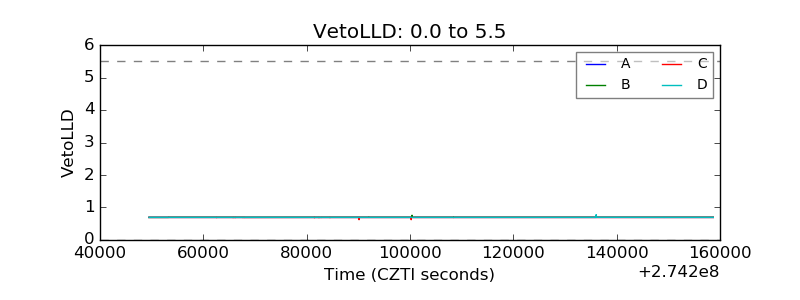 |
| Alpha Counter |  |
| _CPM_Rate | 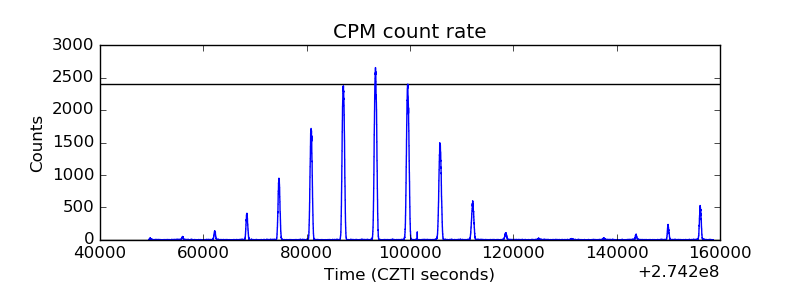 |
| CZT Counter |  |
| +2.5 Volts monitor |  |
| +5 Volts monitor |  |
| _ROLL_ROT |  |
| _Roll_DEC |  |
| _Roll_RA |  |
| Veto Counter |  |