| Param | Original file | Final file |
|---|---|---|
| Filename | modeM0/AS1T02_087T01_9000002352_15956cztM0_level2.evt | modeM0/AS1T02_087T01_9000002352_15956cztM0_level2_quad_clean.evt |
| Size (bytes) | 116,254,080 | 6,762,240 |
| Size | 110.9 MB | 6.4 MB |
| Events in quadrant A | 814,300 | 21,457 |
| Events in quadrant B | 873,451 | 21,459 |
| Events in quadrant C | 932,122 | 20,724 |
| Events in quadrant D | 788,723 | 21,736 |
| Mode M0 | |||
|---|---|---|---|
| Quadrant | BADHDUFLAG | Total packets | Discarded packets |
| A | 0 | 3553 | 2 |
| B | 0 | 3642 | 1 |
| C | 0 | 3835 | 1 |
| D | 0 | 3556 | 1 |
| Mode M9 | |||
|---|---|---|---|
| Quadrant | BADHDUFLAG | Total packets | Discarded packets |
| A | 0 | 3 | 0 |
| B | 0 | 3 | 0 |
| C | 0 | 3 | 0 |
| D | 0 | 3 | 0 |
| Mode SS | |||
|---|---|---|---|
| Quadrant | BADHDUFLAG | Total packets | Discarded packets |
| A | 0 | 34 | 0 |
| B | 0 | 34 | 0 |
| C | 0 | 34 | 0 |
| D | 0 | 34 | 0 |
| Quadrant | Total seconds | Saturated seconds | Saturation percentage |
|---|---|---|---|
| A | 1608 | 101 | 6.281095% |
| B | 1608 | 126 | 7.835821% |
| C | 1608 | 143 | 8.893035% |
| D | 1608 | 77 | 4.788557% |
Noise dominated data is calculated using 1-second bins in cleaned event files. If a bin has >2000 counts, and if more than 50% of those come from <1% of pixels, then it is considered to be noise-dominated and hence unusable.
| Quadrant | # 1 sec bins | Bins with >0 counts | Bins with >2000 counts | High rate bins dominated by noise | Noise dominated (total time) | Noise dominated (detector-on time) | Marked lightcurve |
|---|---|---|---|---|---|---|---|
| A | 1864 | 1610 | 0 | 0 | 0.00% | 0.00% | 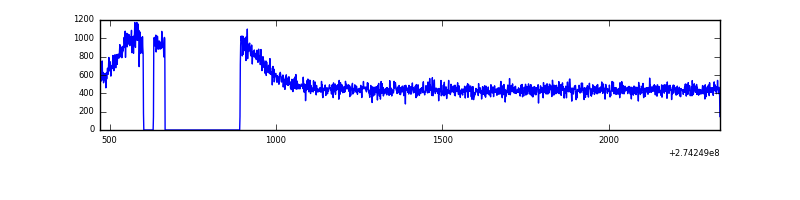 |
| B | 1864 | 1610 | 2 | 2 | 0.11% | 0.12% | 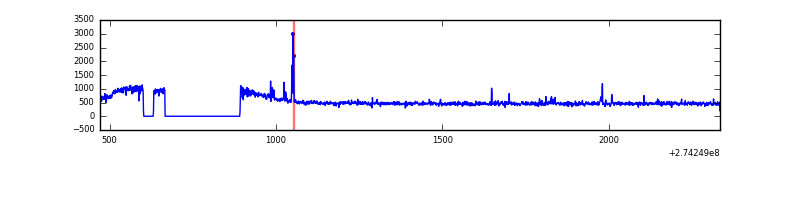 |
| C | 1864 | 1610 | 8 | 8 | 0.43% | 0.50% | 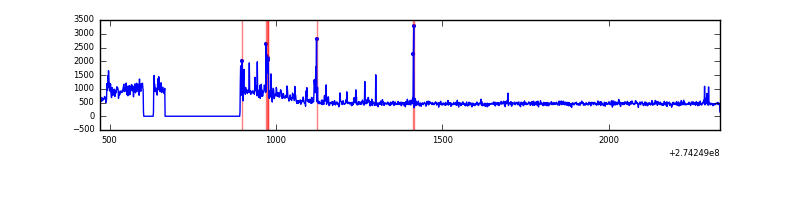 |
| D | 1864 | 1610 | 1 | 1 | 0.05% | 0.06% | 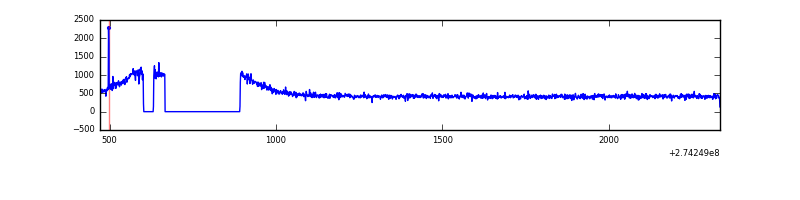 |
Top three noisy pixels from each quadrant. If the there are fewer than three noisy pixels in the level2.evt file, extra rows are filled as -1
| Pixel properties | Quadrant properties | ||||||
|---|---|---|---|---|---|---|---|
| Quadrant | DetID | PixID | Counts | Sigma | Mean | Median | Sigma |
| A | 0 | 226 | 1883 | 36.59 | 212 | 206 | 45.8 |
| A | 3 | 137 | 1620 | 30.85 | 212 | 206 | 45.8 |
| A | 12 | 194 | 1549 | 29.3 | 212 | 206 | 45.8 |
| B | 4 | 173 | 18851 | 407.88 | 214 | 207 | 45.7 |
| B | 12 | 111 | 5495 | 115.69 | 214 | 207 | 45.7 |
| B | 15 | 222 | 4910 | 102.89 | 214 | 207 | 45.7 |
| C | 9 | 236 | 105032 | 2055.38 | 203 | 203 | 51.0 |
| C | 14 | 238 | 29781 | 579.94 | 203 | 203 | 51.0 |
| C | 3 | 233 | 5438 | 102.64 | 203 | 203 | 51.0 |
| D | 2 | 234 | 5889 | 105.64 | 208 | 202 | 53.8 |
| D | 2 | 120 | 3951 | 69.64 | 208 | 202 | 53.8 |
| D | 14 | 226 | 2048 | 34.29 | 208 | 202 | 53.8 |
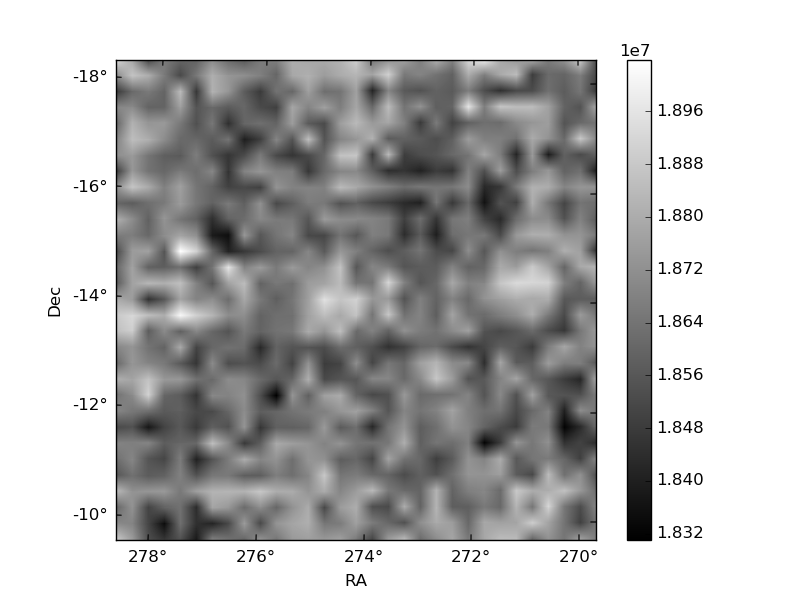
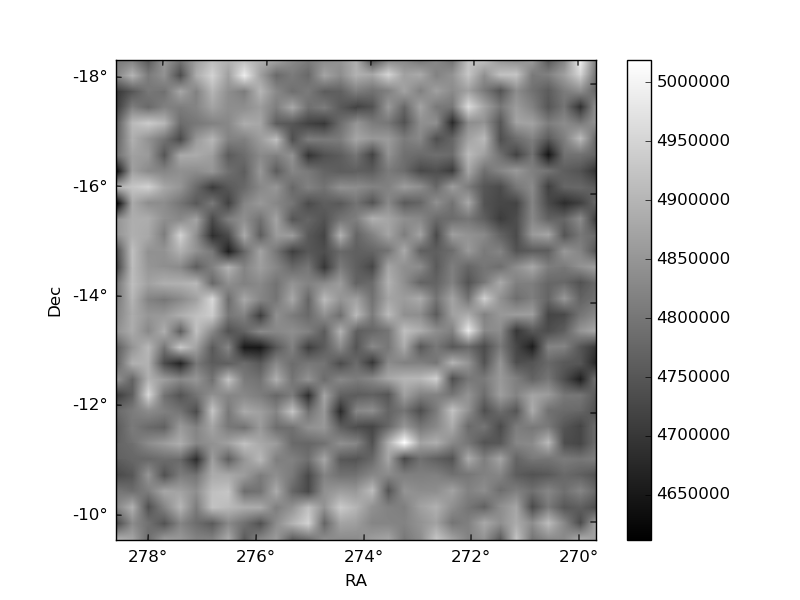
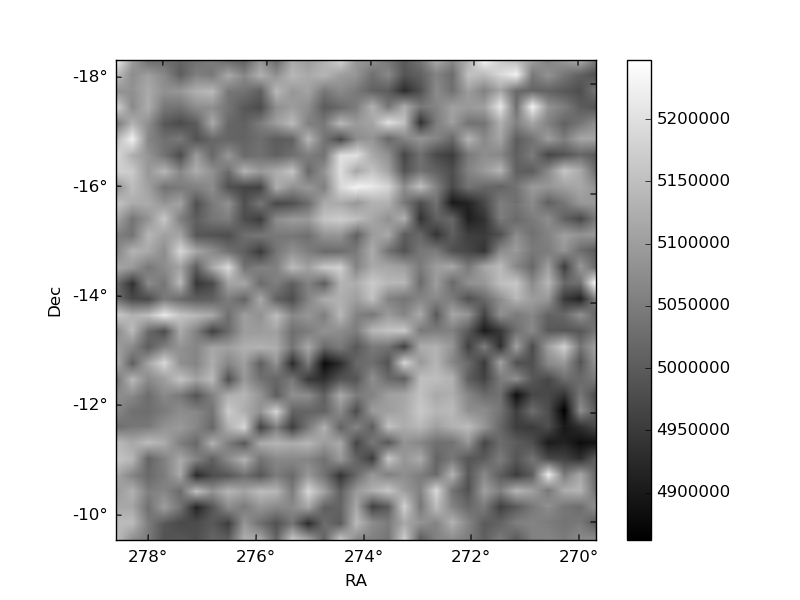
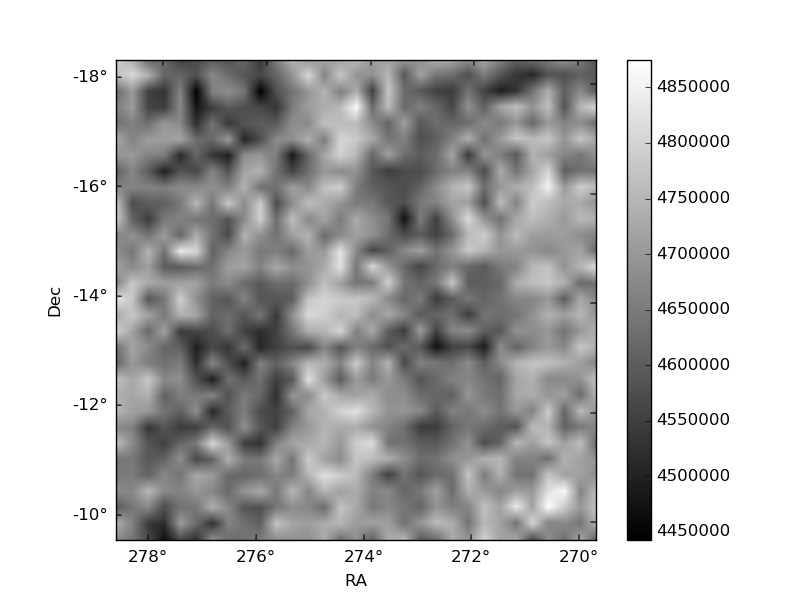
Histogram calculated using DETX and DETY for each event in the final _common_clean file
| Quadrant A | 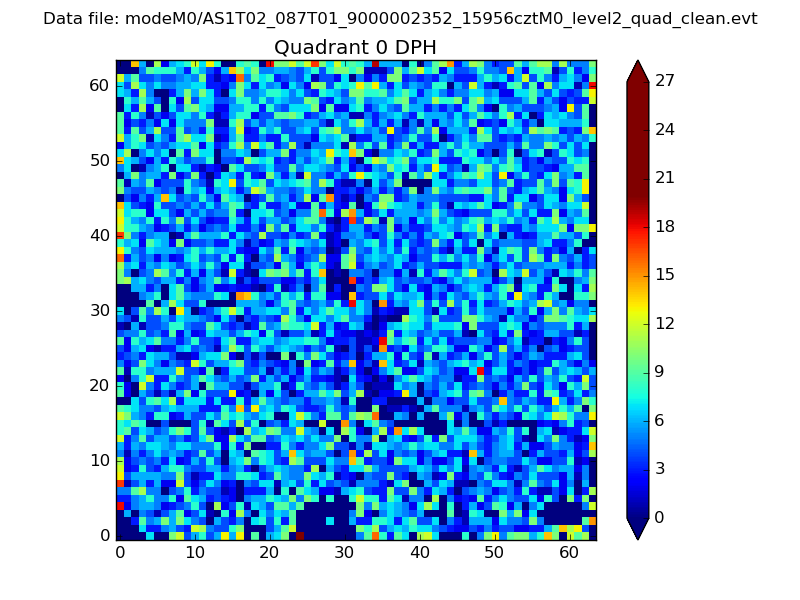 |
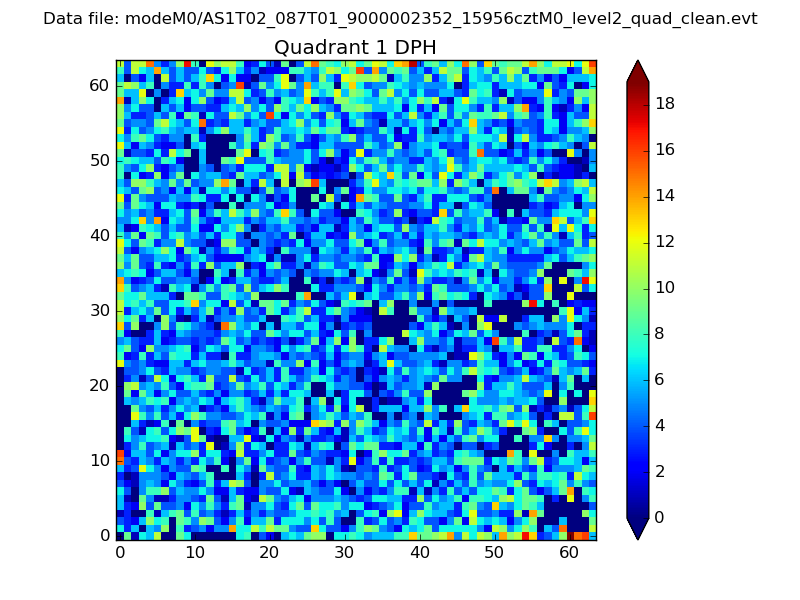 |
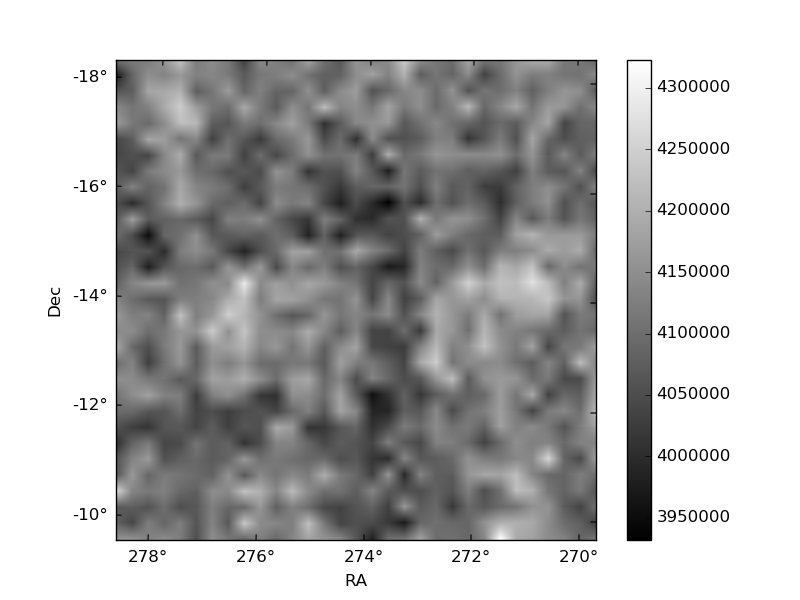
Quadrant B |
|---|---|---|---|
| Quadrant D | 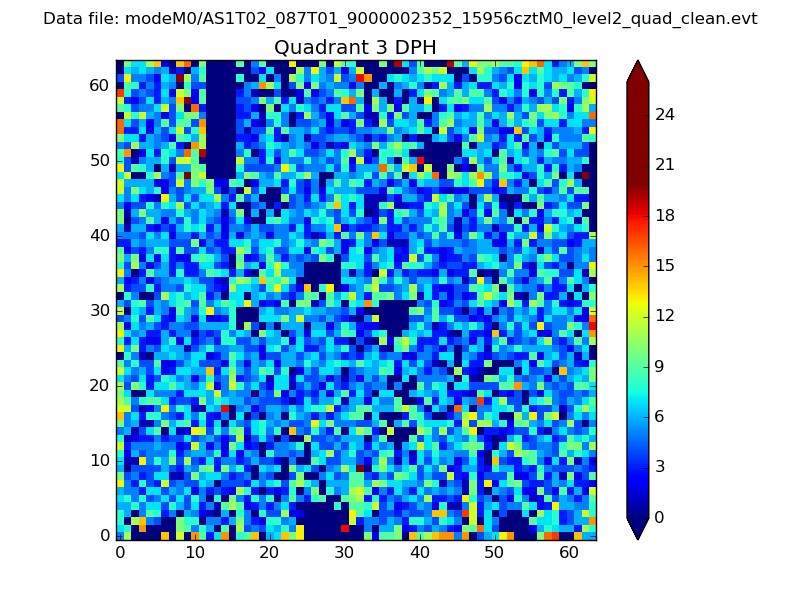 |
 |
Quadrant C |
| Plot type | Count rate plots | Images |
|---|---|---|
| Comparison with Poisson distribution Blue bars denote a histogram of data divided into 1 sec bins. Red curve is a Poisson curve with rate = median count rate of data. |
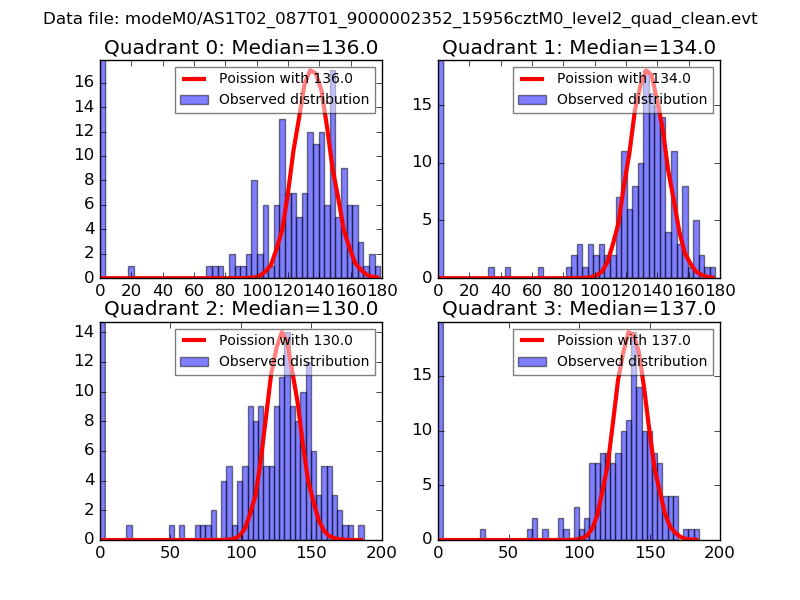 |
 |
| Quadrant-wise count rates Data is divided into 100 sec bins |
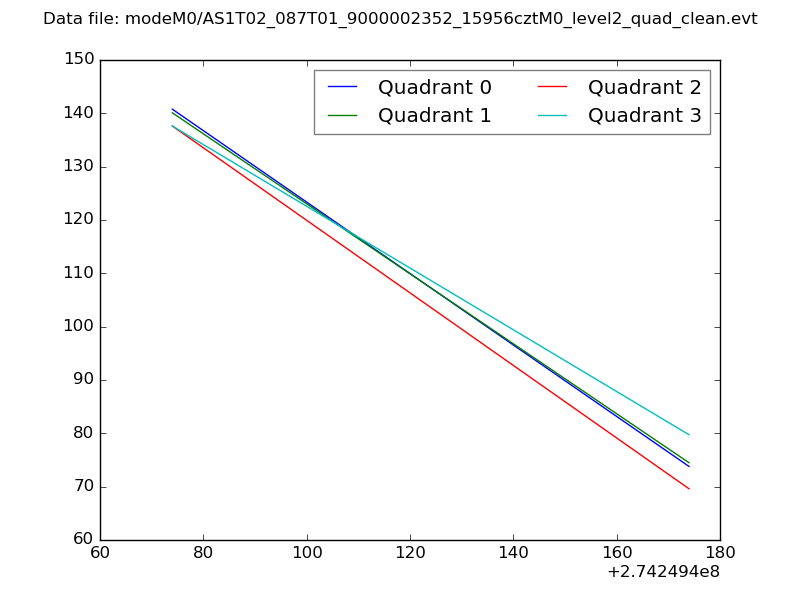 |
|
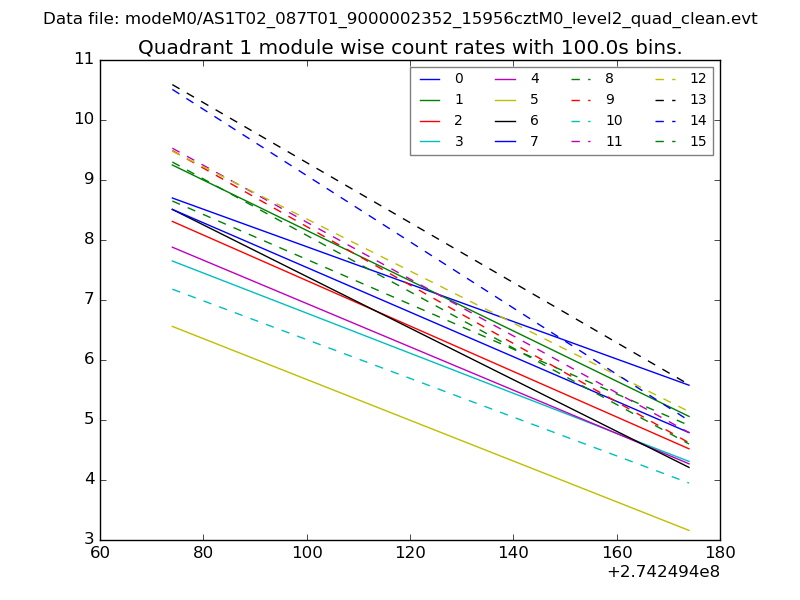
| Module-wise count rates for Quadrant A Data is divided into 100 sec bins |
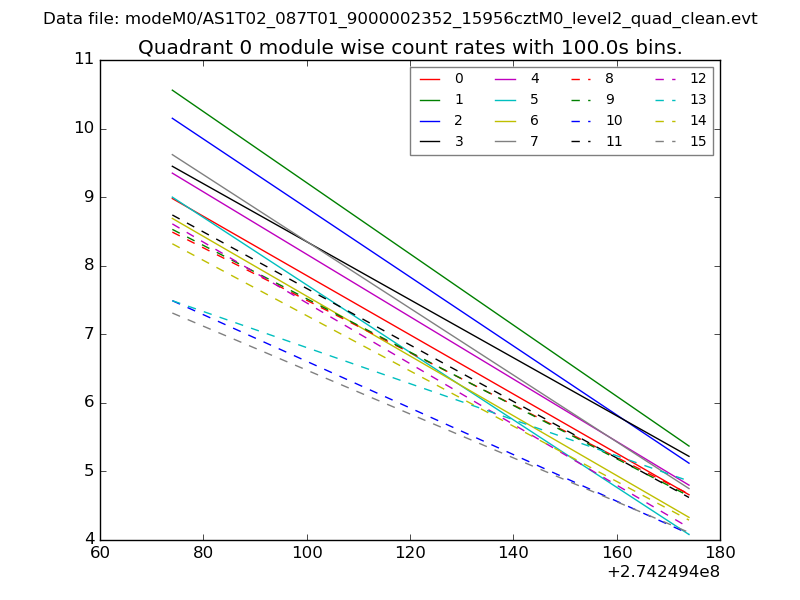 |
 |
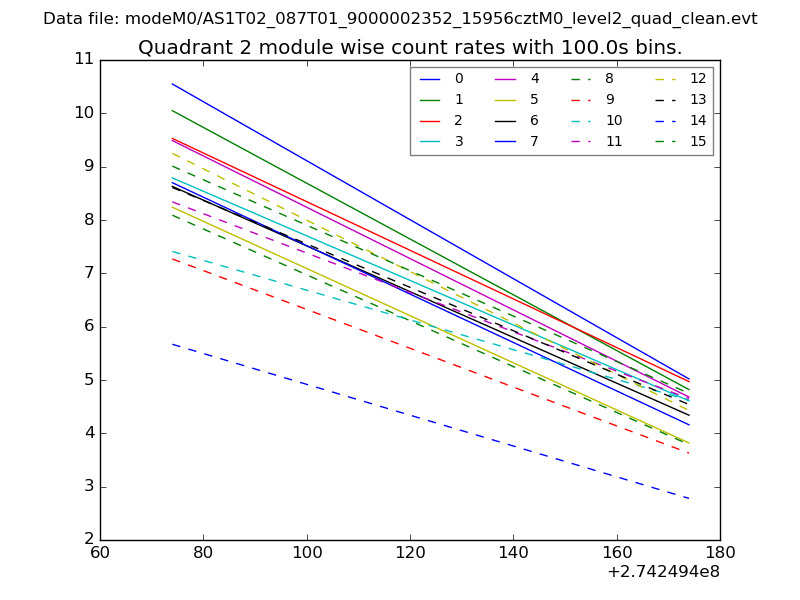
| Module-wise count rates for Quadrant B Data is divided into 100 sec bins |
 |
 |
| Module-wise count rates for Quadrant C Data is divided into 100 sec bins |
 |
 |
| Module-wise count rates for Quadrant D Data is divided into 100 sec bins |
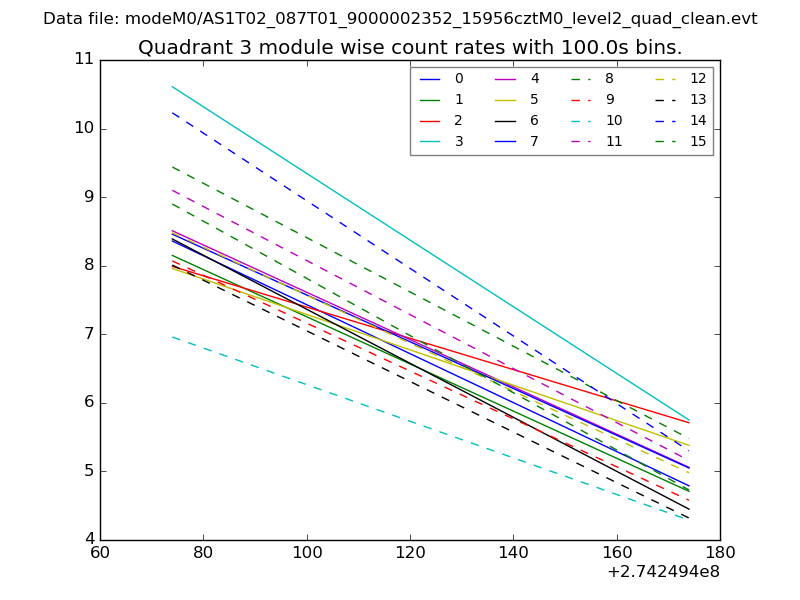 |
 |
| Parameter | Plot |
|---|---|
| CZT HV Monitor | 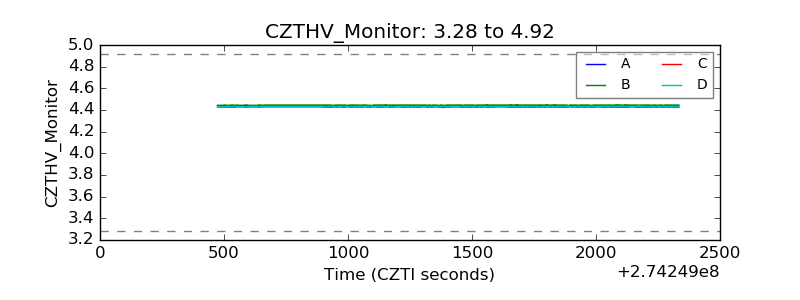 |
| D_VDD | 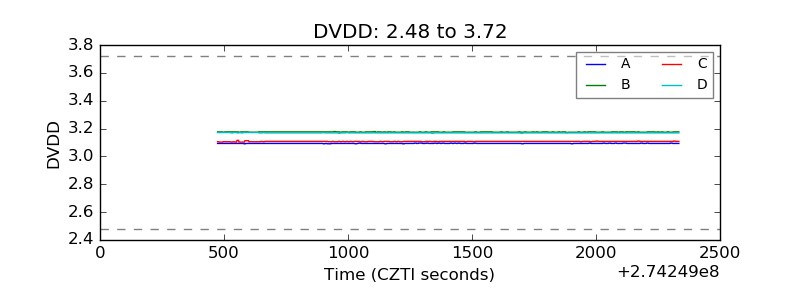 |
| Temperature 1 | 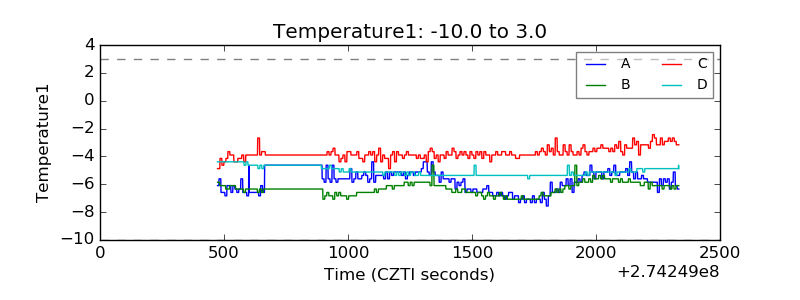 |
| Veto HV Monitor | 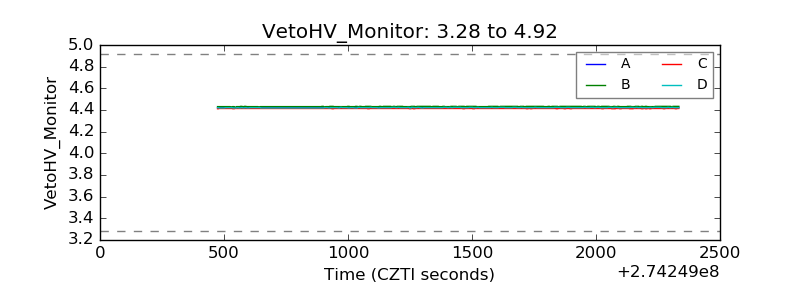 |
| Veto LLD | 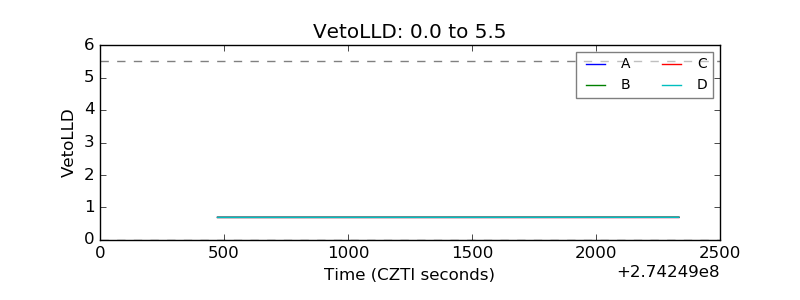 |
| Alpha Counter | 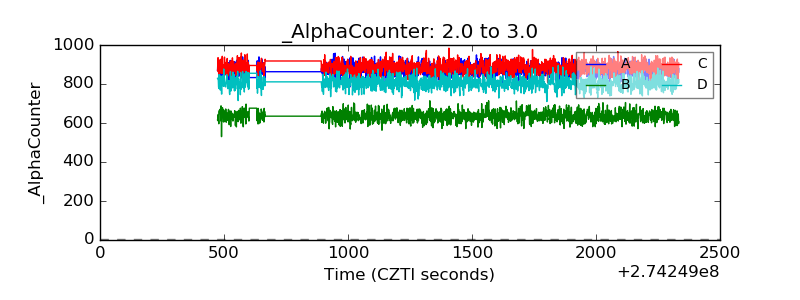 |
| _CPM_Rate | 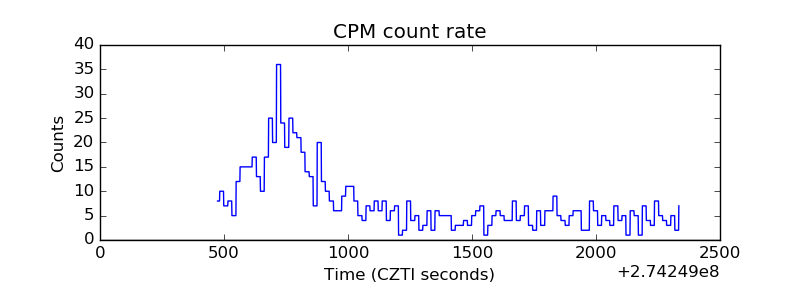 |
| CZT Counter |  |
| +2.5 Volts monitor |  |
| +5 Volts monitor |  |
| _ROLL_ROT | 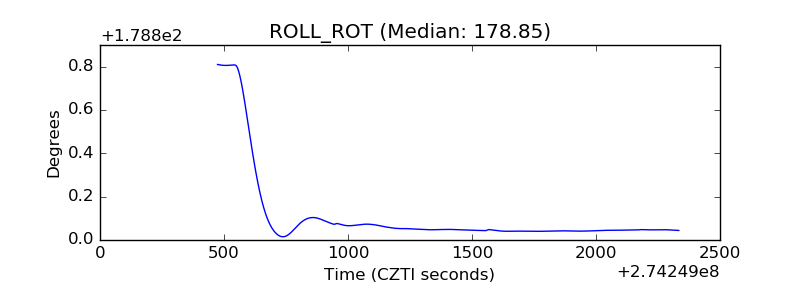 |
| _Roll_DEC | 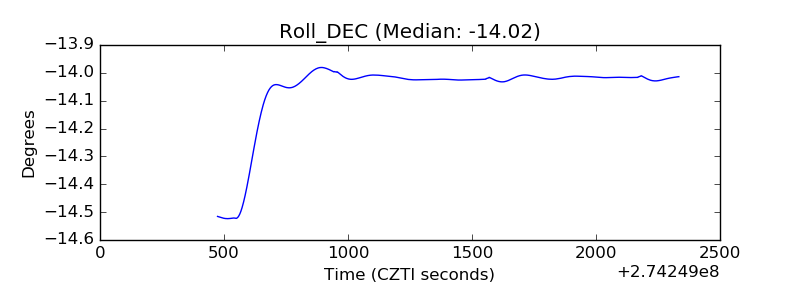 |
| _Roll_RA |  |
| Veto Counter | 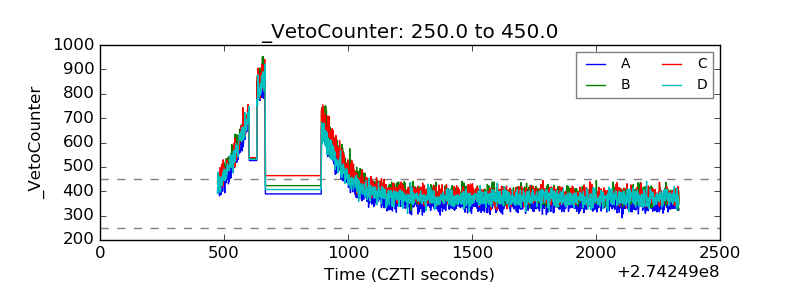 |