| Param | Original file | Final file |
|---|---|---|
| Filename | modeM0/AS1T02_087T01_9000002352_15959cztM0_level2.evt | modeM0/AS1T02_087T01_9000002352_15959cztM0_level2_quad_clean.evt |
| Size (bytes) | 1,258,032,960 | 232,073,280 |
| Size | 1.2 GB | 221.3 MB |
| Events in quadrant A | 8,955,972 | 1,459,644 |
| Events in quadrant B | 9,720,750 | 1,473,998 |
| Events in quadrant C | 9,563,160 | 1,413,087 |
| Events in quadrant D | 8,589,412 | 1,388,277 |
| Mode M0 | |||
|---|---|---|---|
| Quadrant | BADHDUFLAG | Total packets | Discarded packets |
| A | 0 | 38894 | 5 |
| B | 0 | 40382 | 4 |
| C | 0 | 40185 | 4 |
| D | 0 | 38669 | 4 |
| Mode M9 | |||
|---|---|---|---|
| Quadrant | BADHDUFLAG | Total packets | Discarded packets |
| A | 0 | 21 | 0 |
| B | 0 | 21 | 0 |
| C | 0 | 21 | 0 |
| D | 0 | 21 | 0 |
| Mode SS | |||
|---|---|---|---|
| Quadrant | BADHDUFLAG | Total packets | Discarded packets |
| A | 0 | 384 | 0 |
| B | 0 | 384 | 0 |
| C | 0 | 384 | 0 |
| D | 0 | 384 | 0 |
| Quadrant | Total seconds | Saturated seconds | Saturation percentage |
|---|---|---|---|
| A | 18775 | 346 | 1.842876% |
| B | 18775 | 413 | 2.199734% |
| C | 18775 | 494 | 2.631158% |
| D | 18775 | 277 | 1.475366% |
Noise dominated data is calculated using 1-second bins in cleaned event files. If a bin has >2000 counts, and if more than 50% of those come from <1% of pixels, then it is considered to be noise-dominated and hence unusable.
| Quadrant | # 1 sec bins | Bins with >0 counts | Bins with >2000 counts | High rate bins dominated by noise | Noise dominated (total time) | Noise dominated (detector-on time) | Marked lightcurve |
|---|---|---|---|---|---|---|---|
| A | 20861 | 18777 | 10 | 10 | 0.05% | 0.05% | 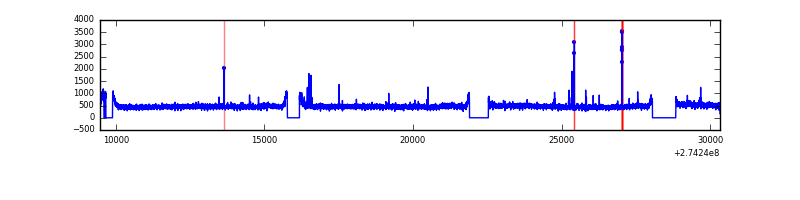 |
| B | 20861 | 18777 | 21 | 21 | 0.10% | 0.11% | 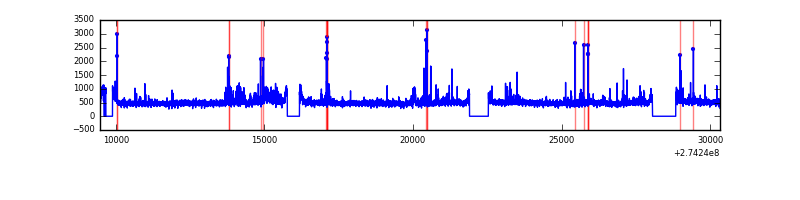 |
| C | 20861 | 18777 | 26 | 26 | 0.12% | 0.14% | 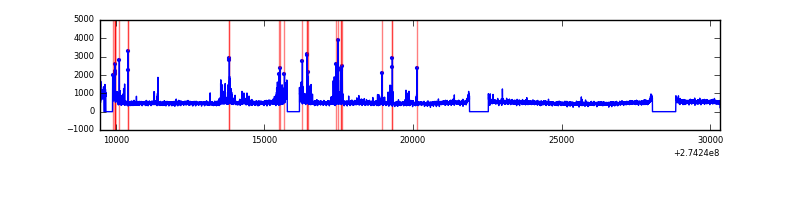 |
| D | 20861 | 18778 | 10 | 10 | 0.05% | 0.05% | 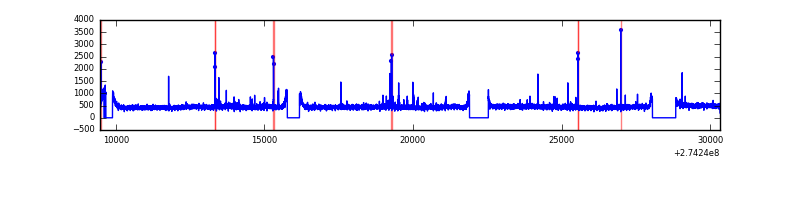 |
Top three noisy pixels from each quadrant. If the there are fewer than three noisy pixels in the level2.evt file, extra rows are filled as -1
| Pixel properties | Quadrant properties | ||||||
|---|---|---|---|---|---|---|---|
| Quadrant | DetID | PixID | Counts | Sigma | Mean | Median | Sigma |
| A | 15 | 157 | 54087 | 111.15 | 2292 | 2240 | 466.5 |
| A | 15 | 239 | 33922 | 67.92 | 2292 | 2240 | 466.5 |
| A | 7 | 32 | 31922 | 63.63 | 2292 | 2240 | 466.5 |
| B | 4 | 173 | 128416 | 285.76 | 2290 | 2231 | 441.6 |
| B | 5 | 175 | 120989 | 268.94 | 2290 | 2231 | 441.6 |
| B | 4 | 216 | 115170 | 255.76 | 2290 | 2231 | 441.6 |
| C | 9 | 236 | 519336 | 1010.32 | 2184 | 2197 | 511.9 |
| C | 14 | 238 | 329850 | 640.12 | 2184 | 2197 | 511.9 |
| C | 3 | 233 | 133941 | 257.38 | 2184 | 2197 | 511.9 |
| D | 2 | 152 | 91837 | 165.32 | 2225 | 2162 | 542.4 |
| D | 2 | 234 | 80236 | 143.94 | 2225 | 2162 | 542.4 |
| D | 2 | 120 | 31758 | 54.56 | 2225 | 2162 | 542.4 |
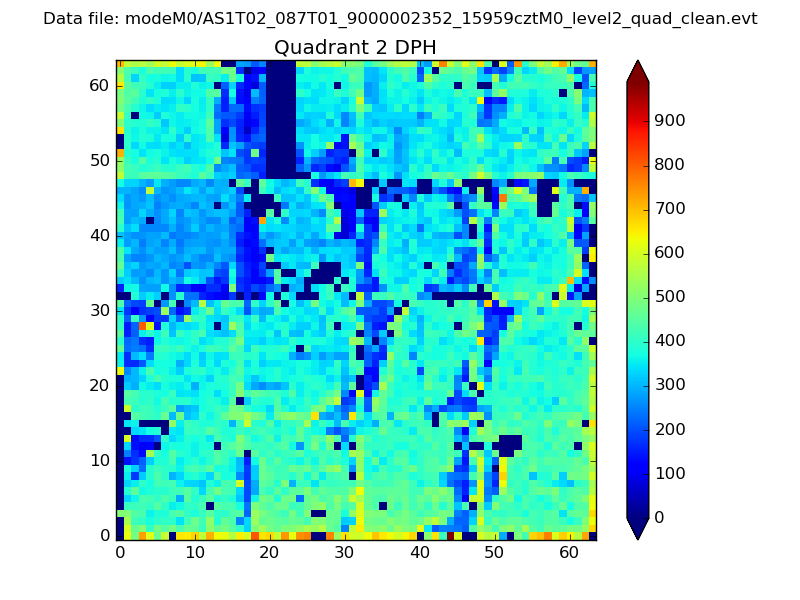
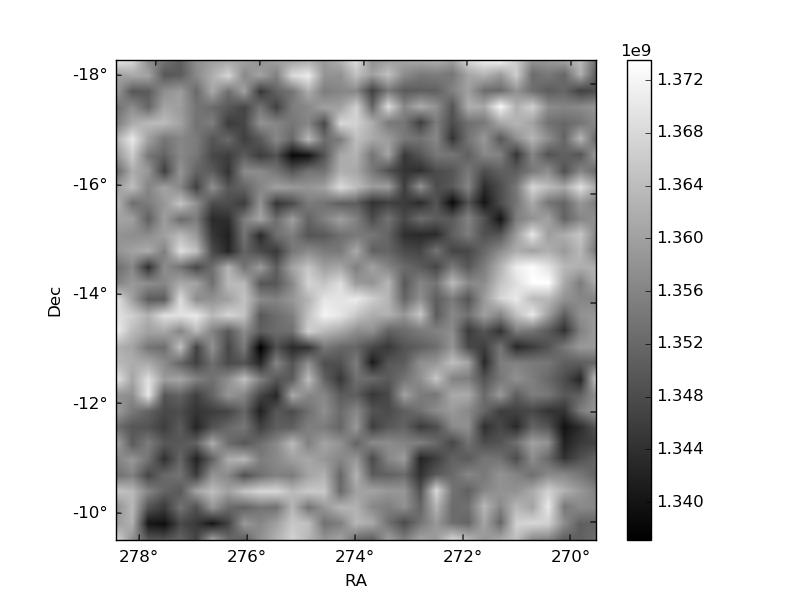
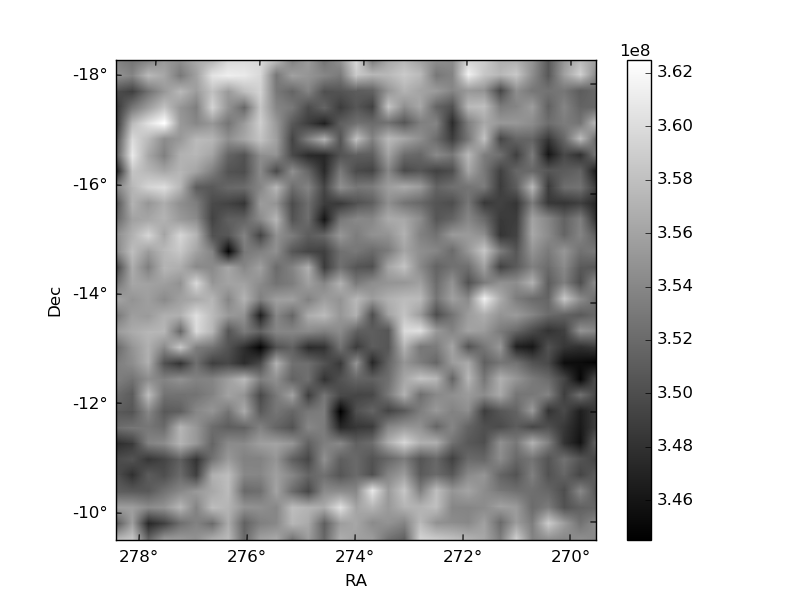
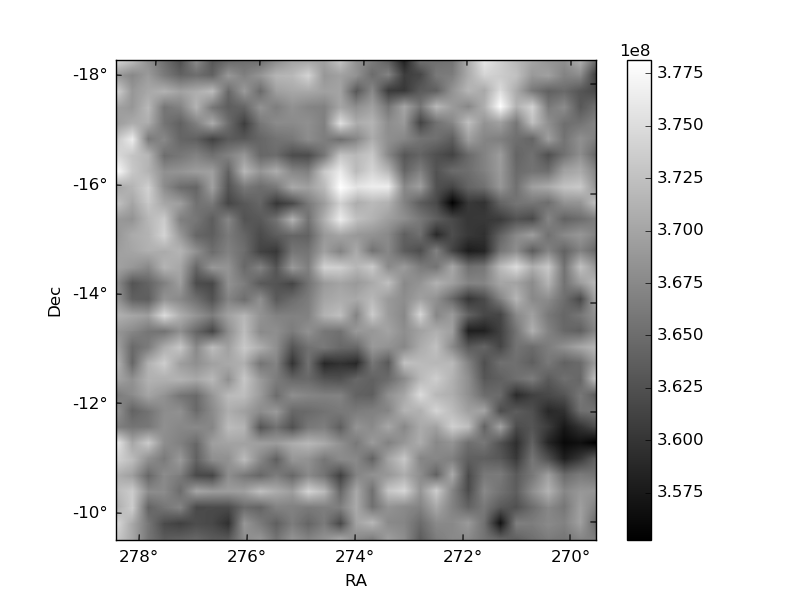
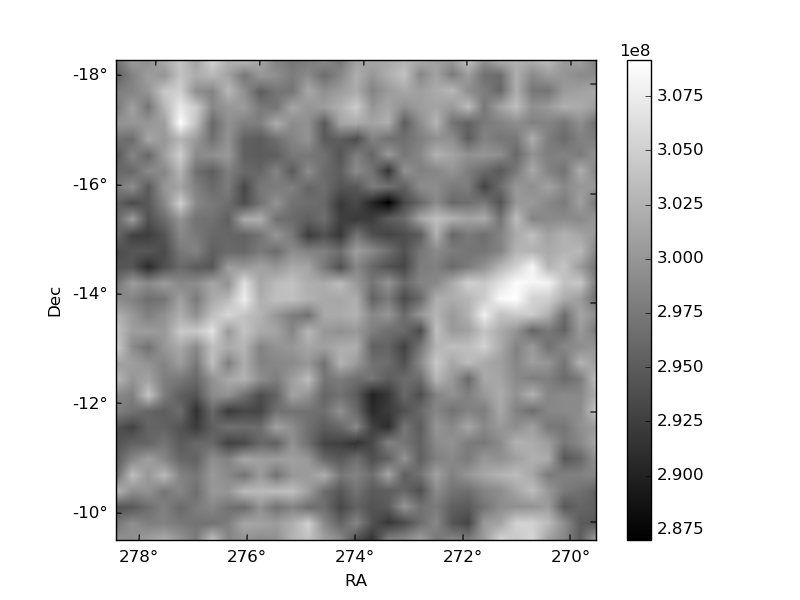
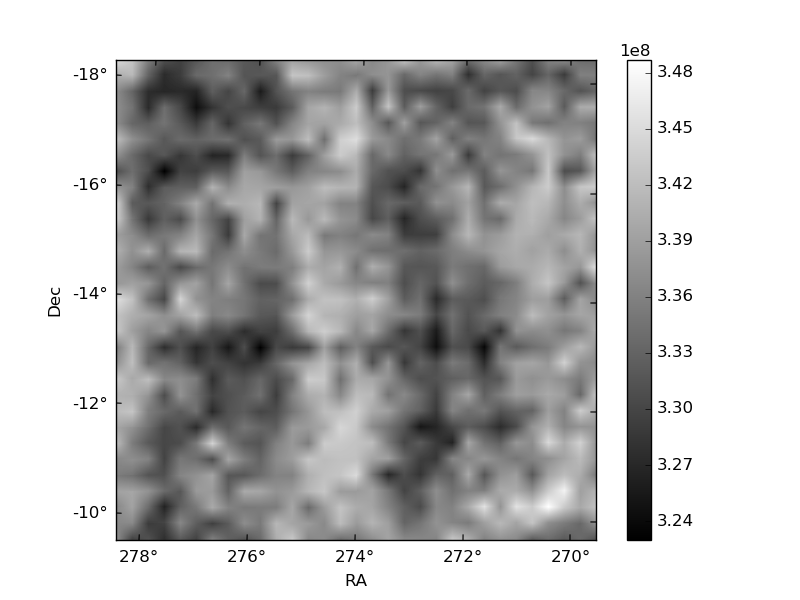
Histogram calculated using DETX and DETY for each event in the final _common_clean file
| Quadrant A | 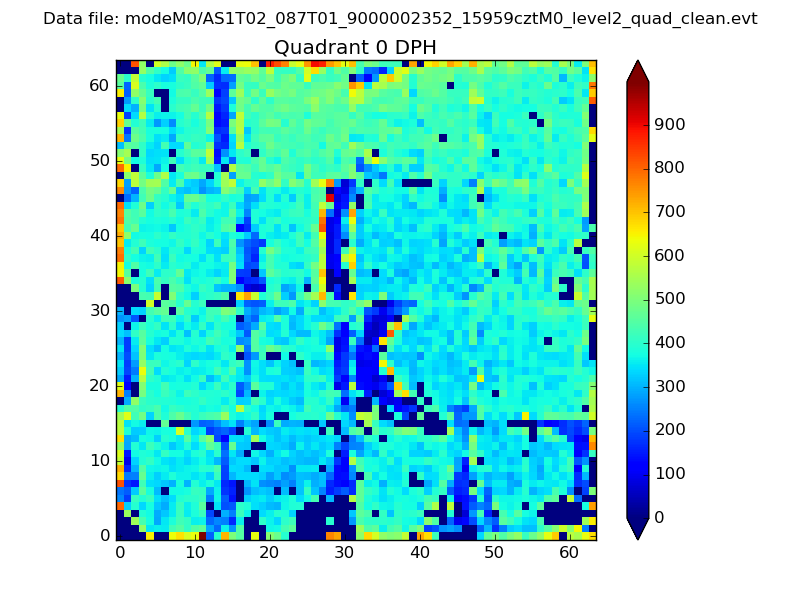 |
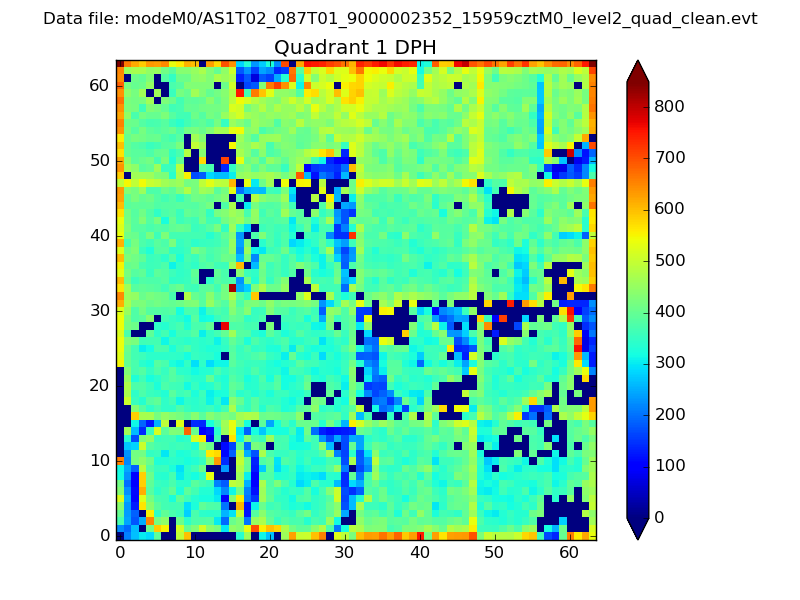 |
Quadrant B |
|---|---|---|---|
| Quadrant D | 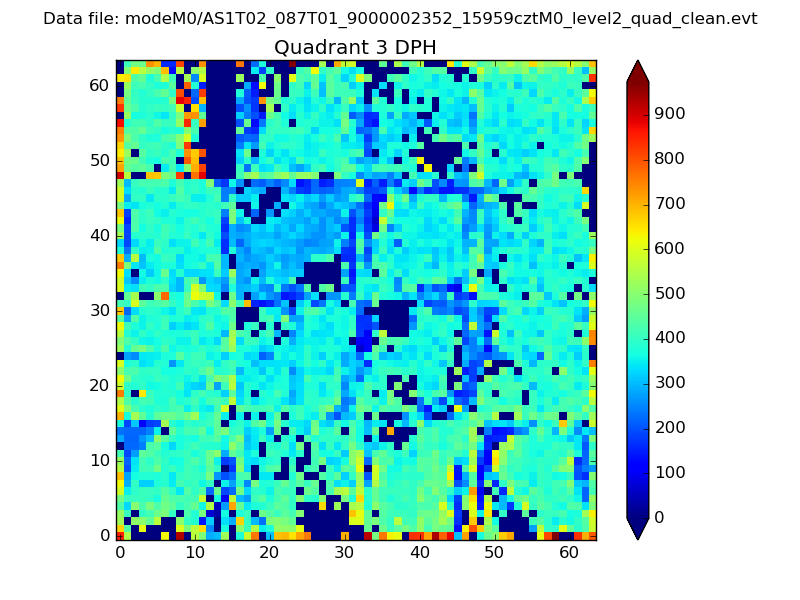 |
 |
Quadrant C |
| Plot type | Count rate plots | Images |
|---|---|---|
| Comparison with Poisson distribution Blue bars denote a histogram of data divided into 1 sec bins. Red curve is a Poisson curve with rate = median count rate of data. |
 |
 |
| Quadrant-wise count rates Data is divided into 100 sec bins |
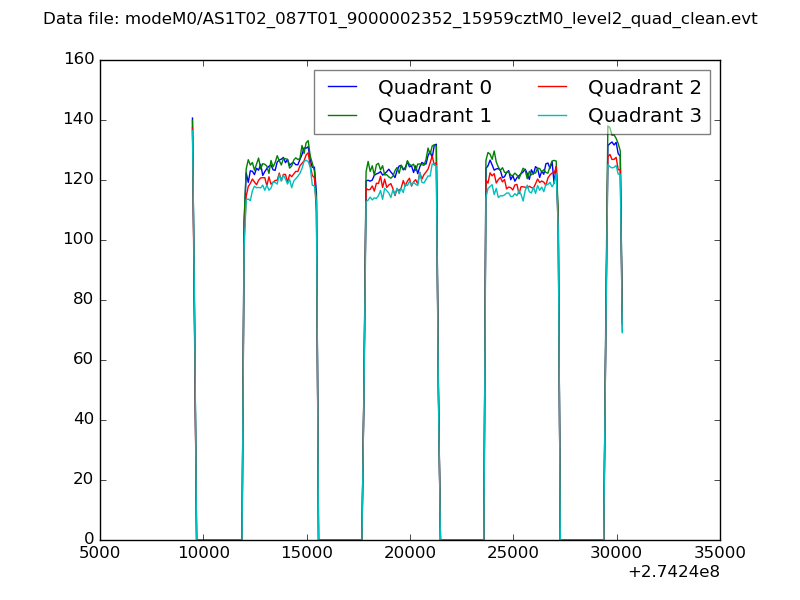 |
|
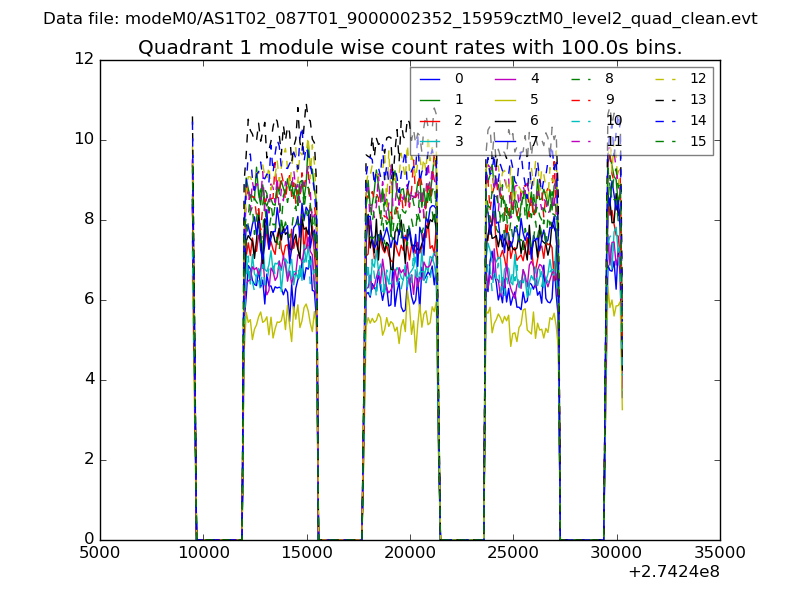
| Module-wise count rates for Quadrant A Data is divided into 100 sec bins |
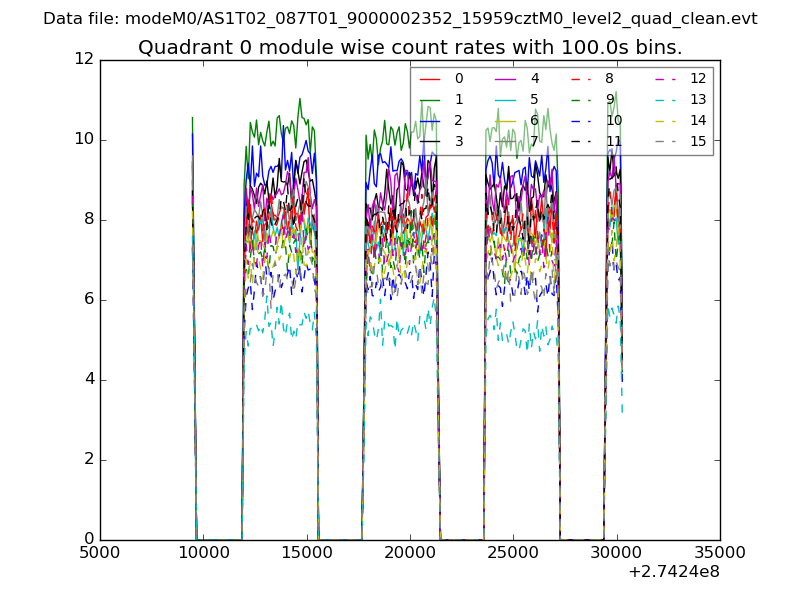 |
 |
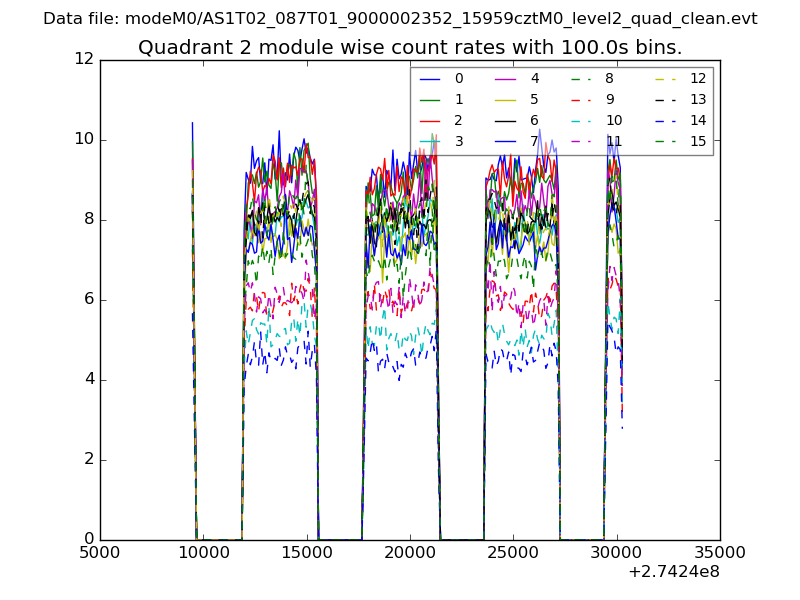
| Module-wise count rates for Quadrant B Data is divided into 100 sec bins |
 |
 |
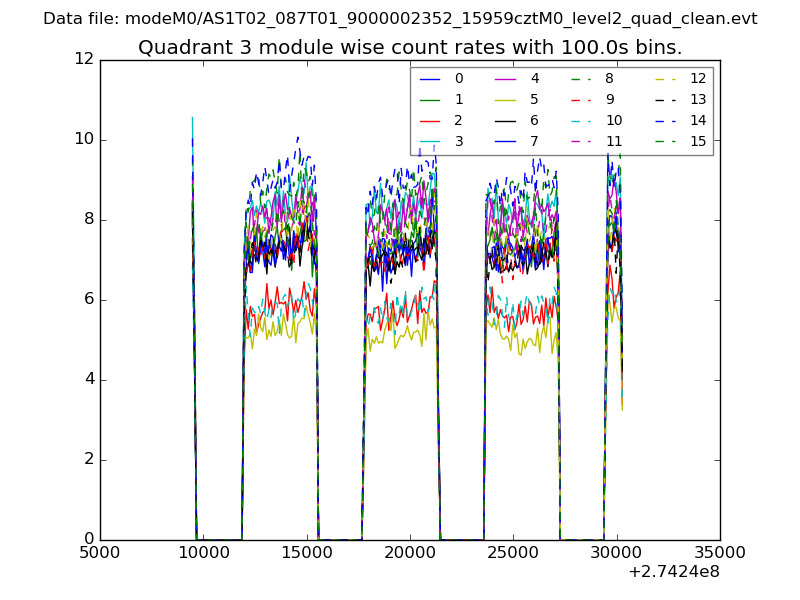
| Module-wise count rates for Quadrant C Data is divided into 100 sec bins |
 |
 |
| Module-wise count rates for Quadrant D Data is divided into 100 sec bins |
 |
 |
| Parameter | Plot |
|---|---|
| CZT HV Monitor |  |
| D_VDD | 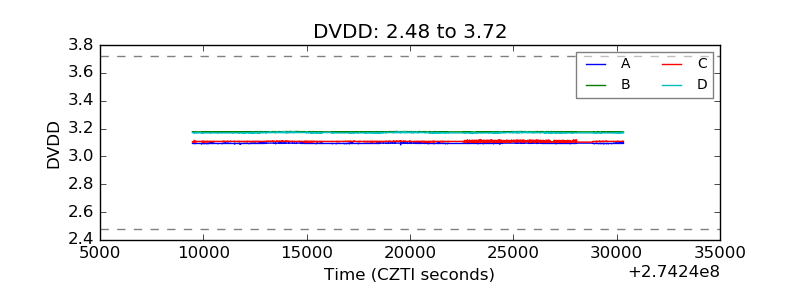 |
| Temperature 1 |  |
| Veto HV Monitor | 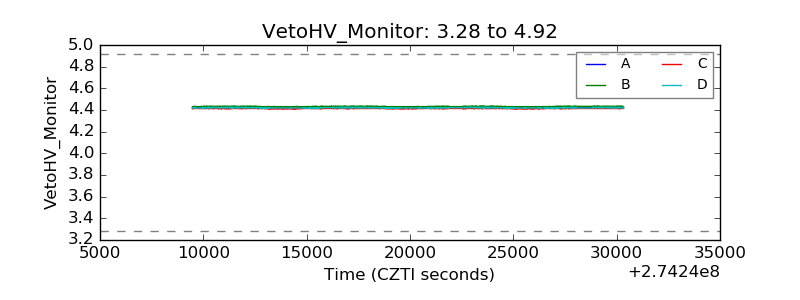 |
| Veto LLD |  |
| Alpha Counter | 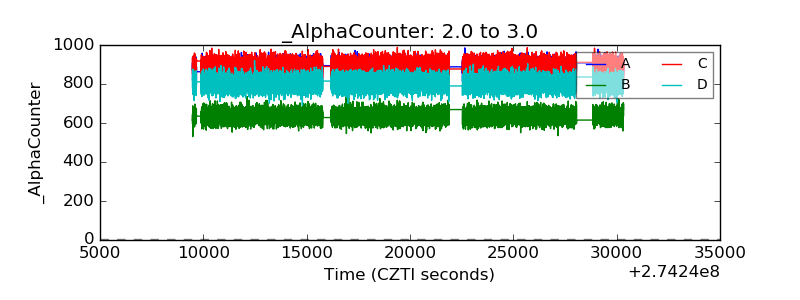 |
| _CPM_Rate | 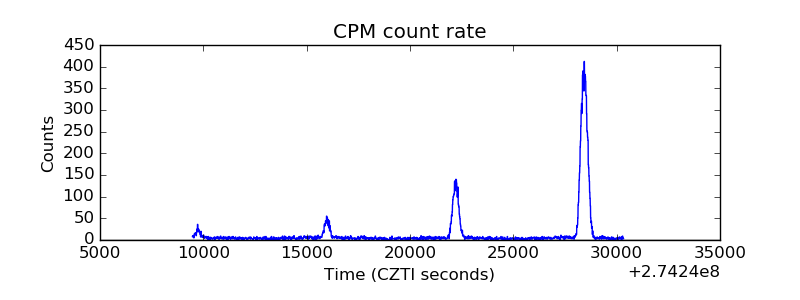 |
| CZT Counter | 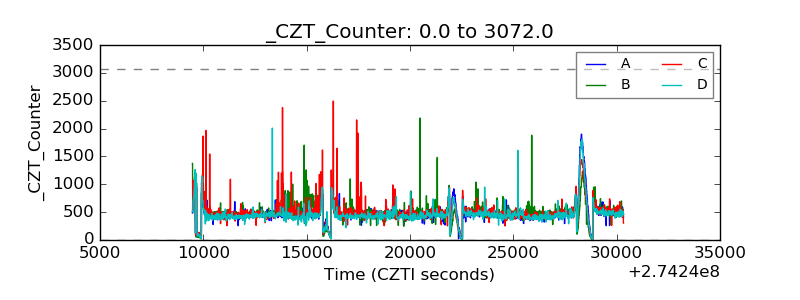 |
| +2.5 Volts monitor |  |
| +5 Volts monitor |  |
| _ROLL_ROT | 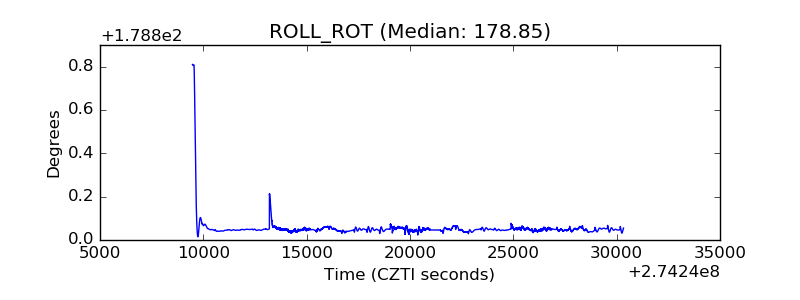 |
| _Roll_DEC | 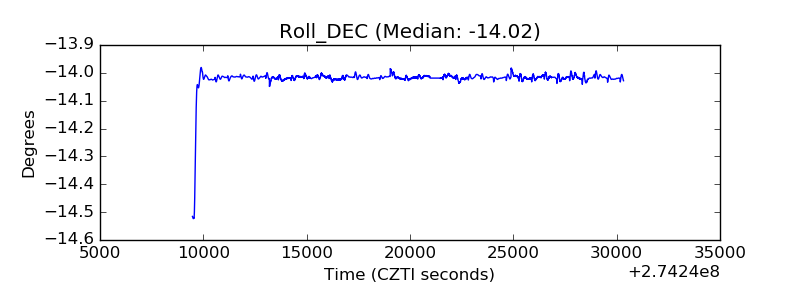 |
| _Roll_RA | 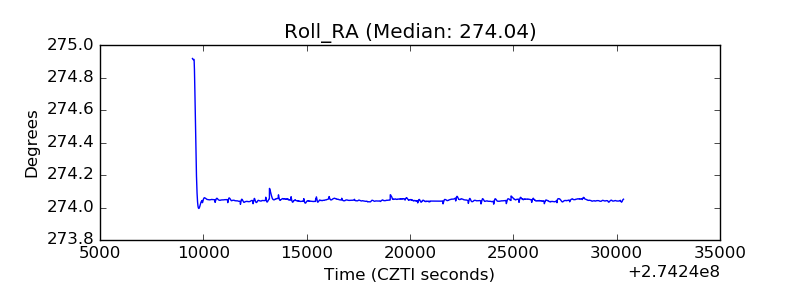 |
| Veto Counter | 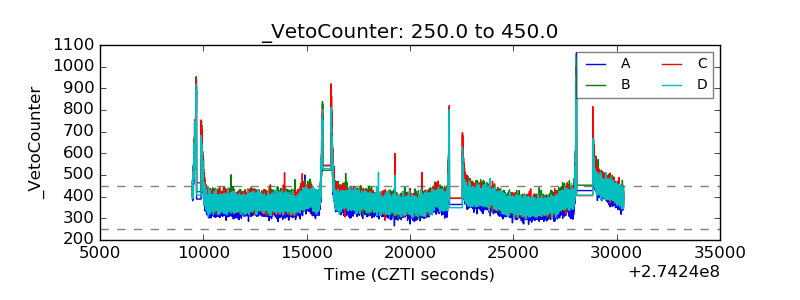 |