| Param | Original file | Final file |
|---|---|---|
| Filename | modeM0/AS1T02_087T01_9000002352_15960cztM0_level2.evt | modeM0/AS1T02_087T01_9000002352_15960cztM0_level2_quad_clean.evt |
| Size (bytes) | 411,500,160 | 93,818,880 |
| Size | 392.4 MB | 89.5 MB |
| Events in quadrant A | 3,012,541 | 618,204 |
| Events in quadrant B | 3,147,844 | 621,995 |
| Events in quadrant C | 3,006,123 | 590,785 |
| Events in quadrant D | 2,878,524 | 582,031 |
| Mode M0 | |||
|---|---|---|---|
| Quadrant | BADHDUFLAG | Total packets | Discarded packets |
| A | 0 | 12835 | 2 |
| B | 0 | 13141 | 1 |
| C | 0 | 12808 | 1 |
| D | 0 | 12686 | 1 |
| Mode M9 | |||
|---|---|---|---|
| Quadrant | BADHDUFLAG | Total packets | Discarded packets |
| A | 0 | 10 | 0 |
| B | 0 | 10 | 0 |
| C | 0 | 10 | 0 |
| D | 0 | 10 | 0 |
| Mode SS | |||
|---|---|---|---|
| Quadrant | BADHDUFLAG | Total packets | Discarded packets |
| A | 0 | 124 | 0 |
| B | 0 | 124 | 0 |
| C | 0 | 124 | 0 |
| D | 0 | 124 | 0 |
| Quadrant | Total seconds | Saturated seconds | Saturation percentage |
|---|---|---|---|
| A | 6135 | 67 | 1.092095% |
| B | 6135 | 76 | 1.238794% |
| C | 6135 | 88 | 1.434393% |
| D | 6135 | 60 | 0.977995% |
Noise dominated data is calculated using 1-second bins in cleaned event files. If a bin has >2000 counts, and if more than 50% of those come from <1% of pixels, then it is considered to be noise-dominated and hence unusable.
| Quadrant | # 1 sec bins | Bins with >0 counts | Bins with >2000 counts | High rate bins dominated by noise | Noise dominated (total time) | Noise dominated (detector-on time) | Marked lightcurve |
|---|---|---|---|---|---|---|---|
| A | 7096 | 6136 | 0 | 0 | 0.00% | 0.00% | 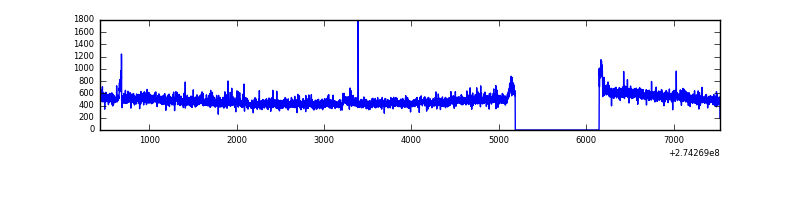 |
| B | 7096 | 6136 | 6 | 6 | 0.08% | 0.10% | 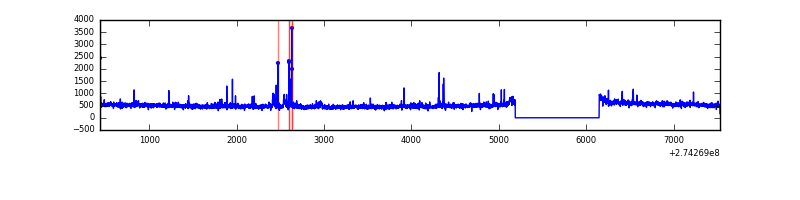 |
| C | 7096 | 6136 | 0 | 0 | 0.00% | 0.00% | 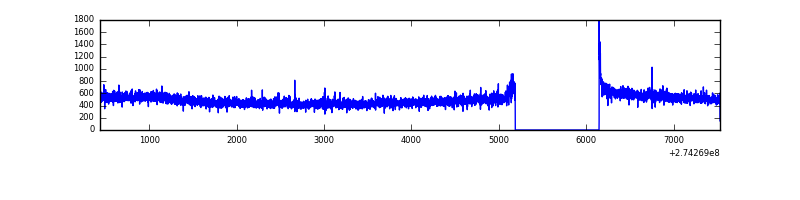 |
| D | 7096 | 6136 | 7 | 7 | 0.10% | 0.11% | 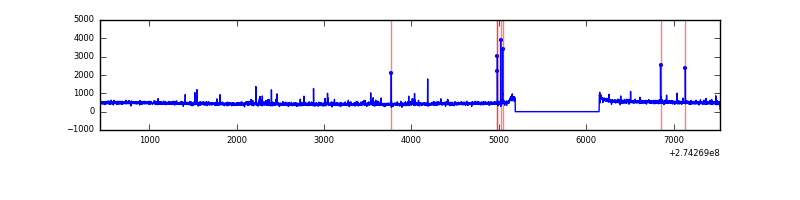 |
Top three noisy pixels from each quadrant. If the there are fewer than three noisy pixels in the level2.evt file, extra rows are filled as -1
| Pixel properties | Quadrant properties | ||||||
|---|---|---|---|---|---|---|---|
| Quadrant | DetID | PixID | Counts | Sigma | Mean | Median | Sigma |
| A | 15 | 239 | 61466 | 392.14 | 762 | 744 | 154.8 |
| A | 13 | 210 | 22029 | 137.46 | 762 | 744 | 154.8 |
| A | 0 | 226 | 6820 | 39.24 | 762 | 744 | 154.8 |
| B | 5 | 65 | 32802 | 220.97 | 756 | 739 | 145.1 |
| B | 4 | 216 | 27442 | 184.03 | 756 | 739 | 145.1 |
| B | 0 | 189 | 25215 | 168.69 | 756 | 739 | 145.1 |
| C | 14 | 238 | 110092 | 648.8 | 720 | 725 | 168.6 |
| C | 3 | 233 | 80130 | 471.05 | 720 | 725 | 168.6 |
| C | 9 | 236 | 6696 | 35.42 | 720 | 725 | 168.6 |
| D | 2 | 120 | 28802 | 155.62 | 737 | 716 | 180.5 |
| D | 2 | 152 | 28145 | 151.98 | 737 | 716 | 180.5 |
| D | 2 | 234 | 25852 | 139.28 | 737 | 716 | 180.5 |
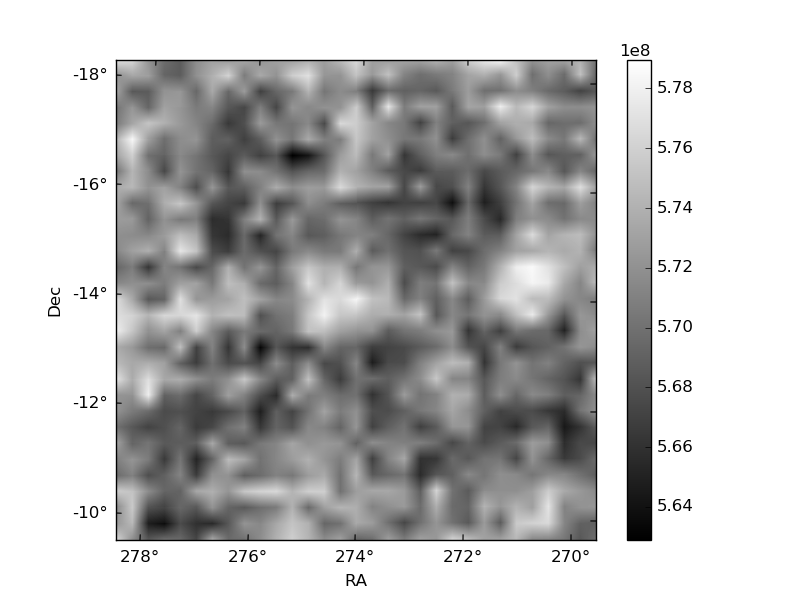
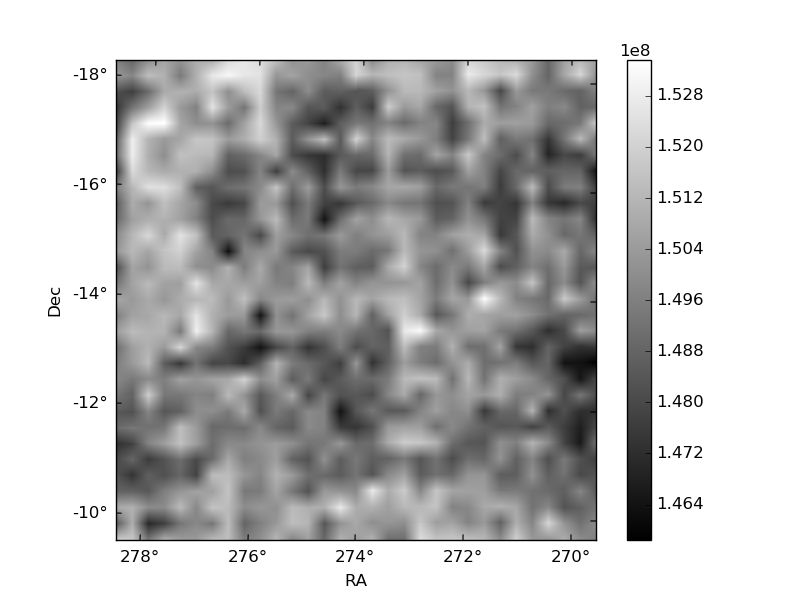
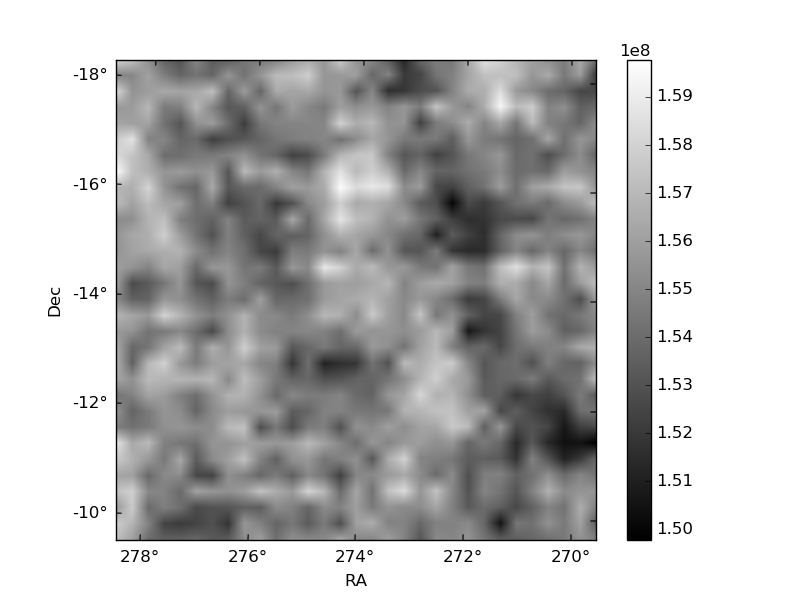
Histogram calculated using DETX and DETY for each event in the final _common_clean file
| Quadrant A | 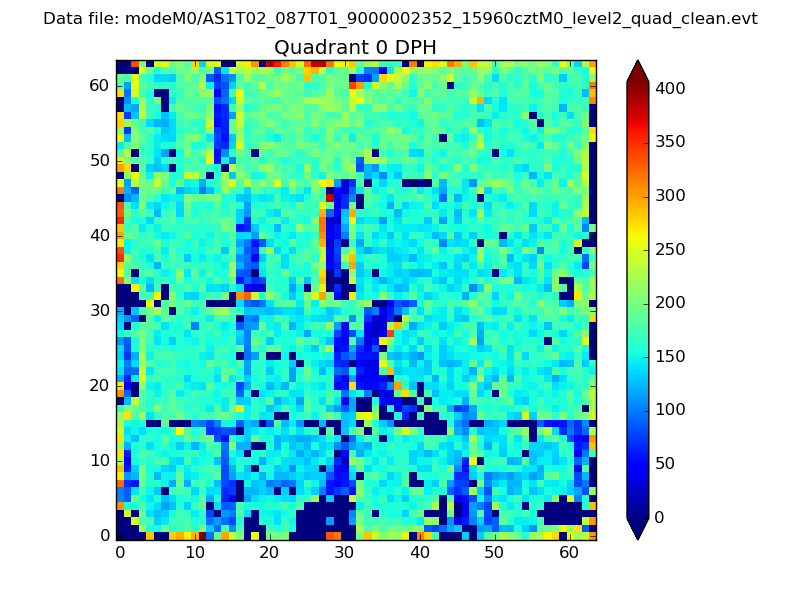 |
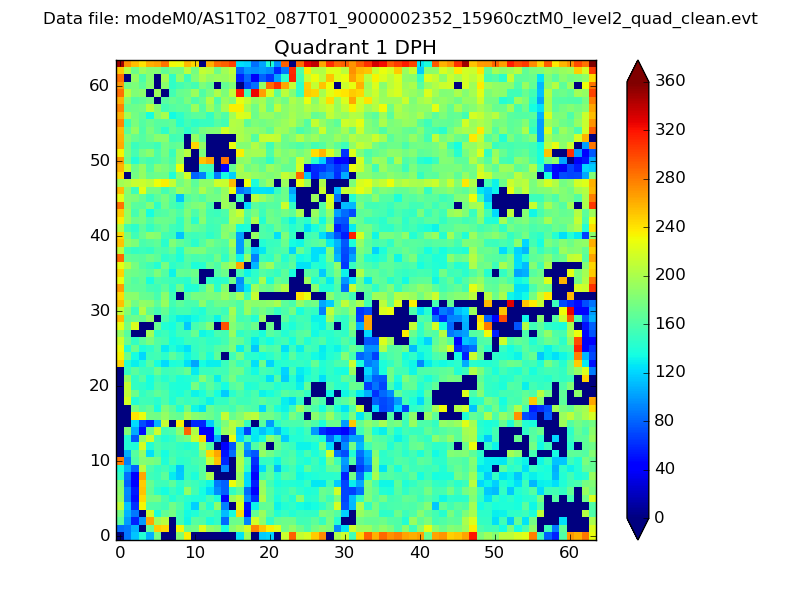 |
Quadrant B |
|---|---|---|---|
| Quadrant D | 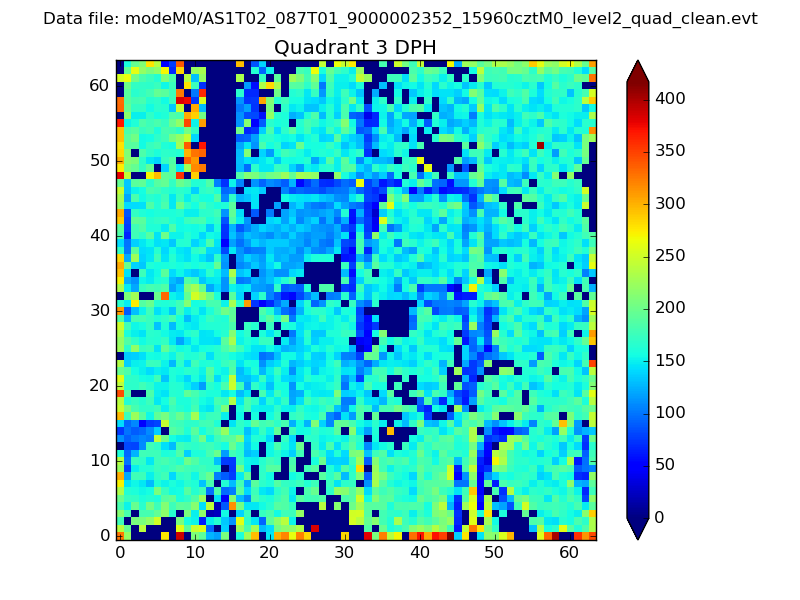 |
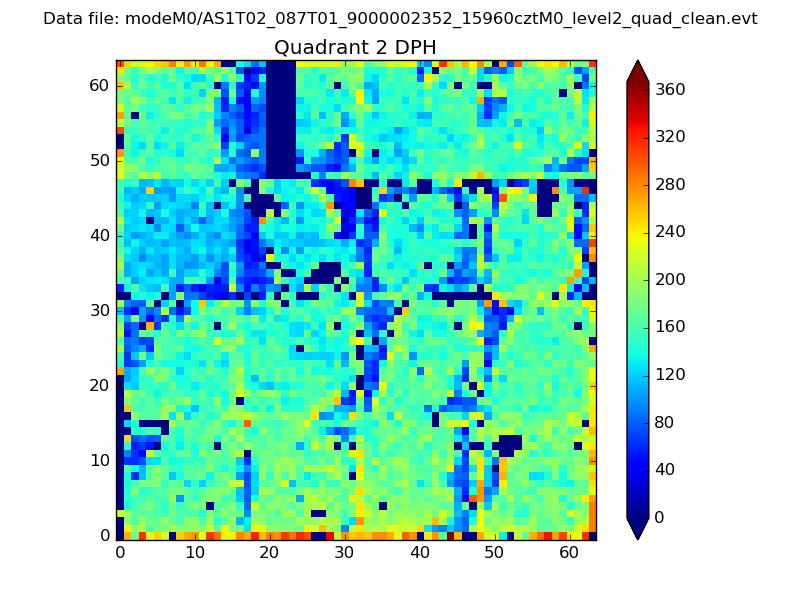 |
Quadrant C |
| Plot type | Count rate plots | Images |
|---|---|---|
| Comparison with Poisson distribution Blue bars denote a histogram of data divided into 1 sec bins. Red curve is a Poisson curve with rate = median count rate of data. |
 |
 |
| Quadrant-wise count rates Data is divided into 100 sec bins |
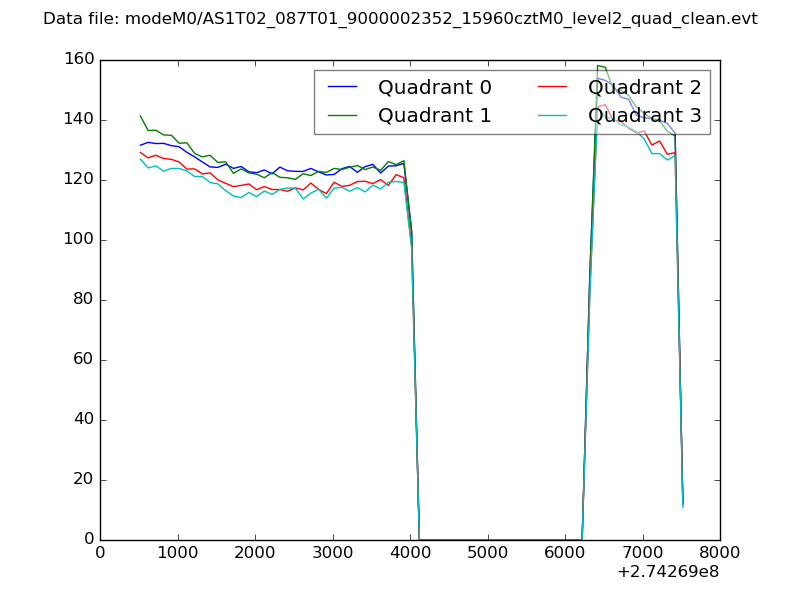 |
|
| Module-wise count rates for Quadrant A Data is divided into 100 sec bins |
 |
 |
| Module-wise count rates for Quadrant B Data is divided into 100 sec bins |
 |
 |
| Module-wise count rates for Quadrant C Data is divided into 100 sec bins |
 |
 |
| Module-wise count rates for Quadrant D Data is divided into 100 sec bins |
 |
 |
| Parameter | Plot |
|---|---|
| CZT HV Monitor |  |
| D_VDD | 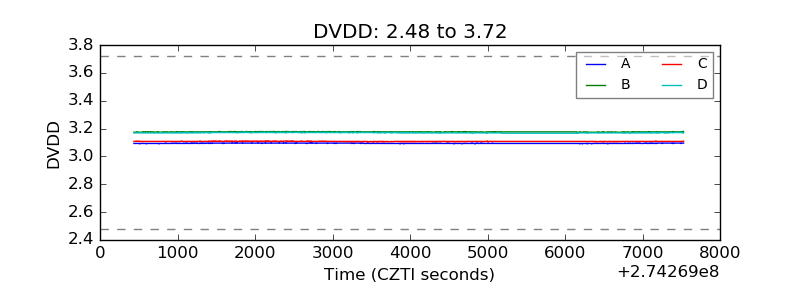 |
| Temperature 1 | 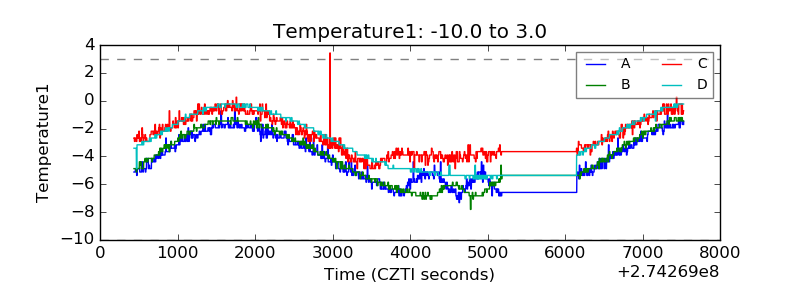 |
| Veto HV Monitor | 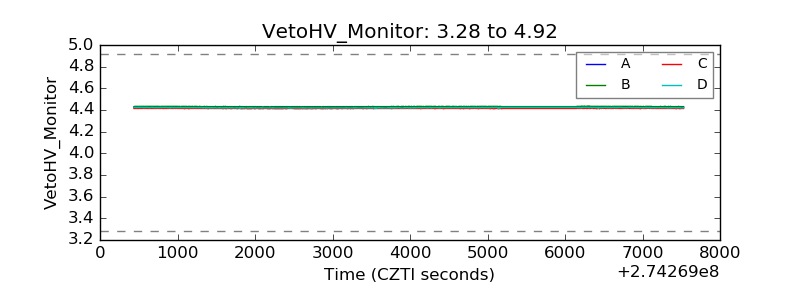 |
| Veto LLD |  |
| Alpha Counter | 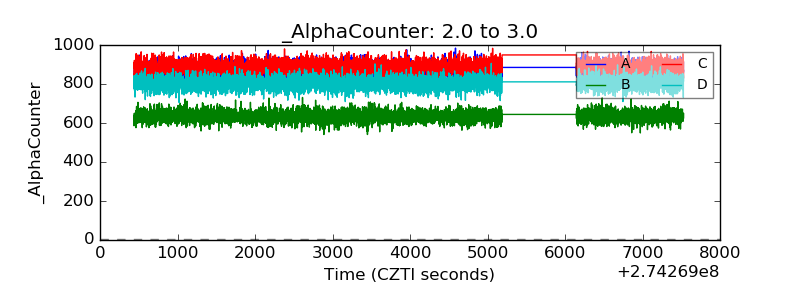 |
| _CPM_Rate | 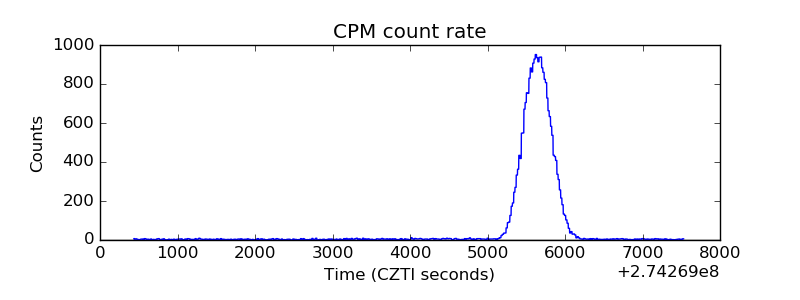 |
| CZT Counter | 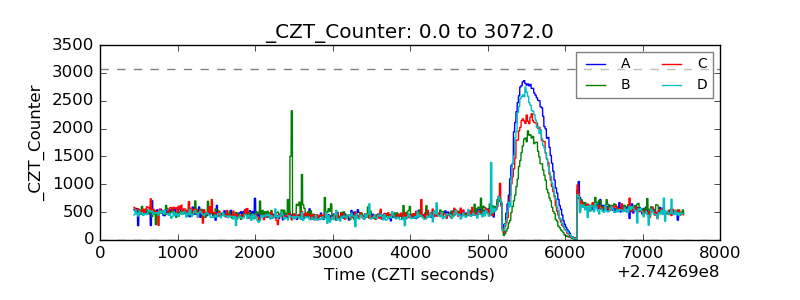 |
| +2.5 Volts monitor |  |
| +5 Volts monitor | 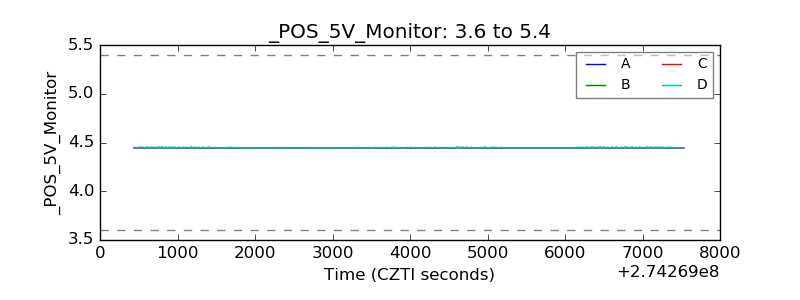 |
| _ROLL_ROT |  |
| _Roll_DEC |  |
| _Roll_RA | 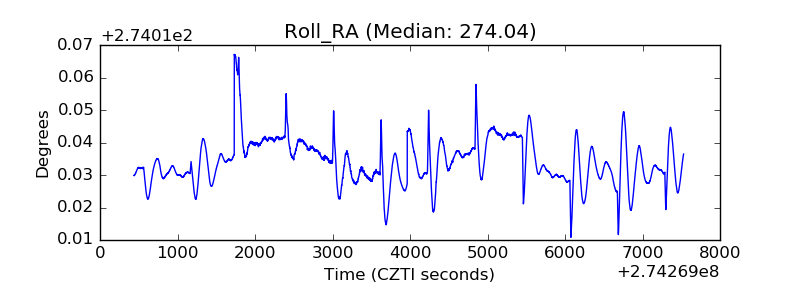 |
| Veto Counter |  |