| Param | Original file | Final file |
|---|---|---|
| Filename | modeM0/AS1T02_087T01_9000002352_15962cztM0_level2.evt | modeM0/AS1T02_087T01_9000002352_15962cztM0_level2_quad_clean.evt |
| Size (bytes) | 438,537,600 | 104,394,240 |
| Size | 418.2 MB | 99.6 MB |
| Events in quadrant A | 3,159,412 | 698,773 |
| Events in quadrant B | 3,385,765 | 701,027 |
| Events in quadrant C | 3,235,777 | 663,289 |
| Events in quadrant D | 3,068,158 | 655,078 |
| Mode M0 | |||
|---|---|---|---|
| Quadrant | BADHDUFLAG | Total packets | Discarded packets |
| A | 0 | 13546 | 2 |
| B | 0 | 13954 | 1 |
| C | 0 | 13586 | 1 |
| D | 0 | 13371 | 1 |
| Mode M9 | |||
|---|---|---|---|
| Quadrant | BADHDUFLAG | Total packets | Discarded packets |
| A | 0 | 11 | 0 |
| B | 0 | 11 | 0 |
| C | 0 | 11 | 0 |
| D | 0 | 11 | 0 |
| Mode SS | |||
|---|---|---|---|
| Quadrant | BADHDUFLAG | Total packets | Discarded packets |
| A | 0 | 128 | 0 |
| B | 0 | 128 | 0 |
| C | 0 | 128 | 0 |
| D | 0 | 128 | 0 |
| Quadrant | Total seconds | Saturated seconds | Saturation percentage |
|---|---|---|---|
| A | 6360 | 54 | 0.849057% |
| B | 6360 | 46 | 0.723270% |
| C | 6360 | 92 | 1.446541% |
| D | 6360 | 38 | 0.597484% |
Noise dominated data is calculated using 1-second bins in cleaned event files. If a bin has >2000 counts, and if more than 50% of those come from <1% of pixels, then it is considered to be noise-dominated and hence unusable.
| Quadrant | # 1 sec bins | Bins with >0 counts | Bins with >2000 counts | High rate bins dominated by noise | Noise dominated (total time) | Noise dominated (detector-on time) | Marked lightcurve |
|---|---|---|---|---|---|---|---|
| A | 7466 | 6361 | 0 | 0 | 0.00% | 0.00% | 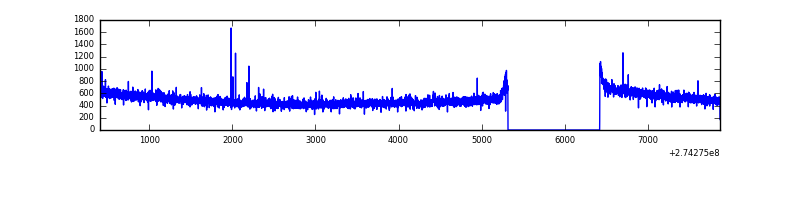 |
| B | 7466 | 6362 | 1 | 1 | 0.01% | 0.02% | 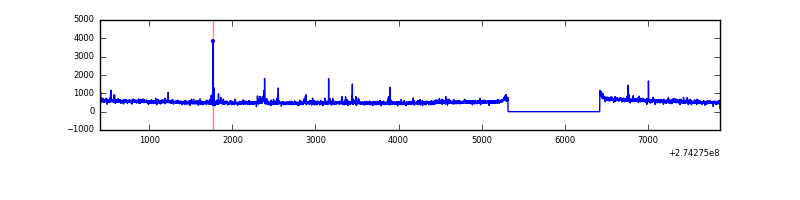 |
| C | 7466 | 6361 | 14 | 14 | 0.19% | 0.22% | 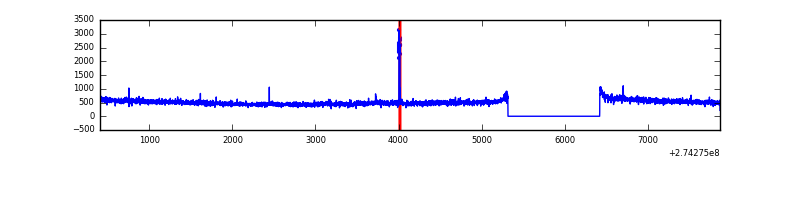 |
| D | 7466 | 6361 | 4 | 4 | 0.05% | 0.06% | 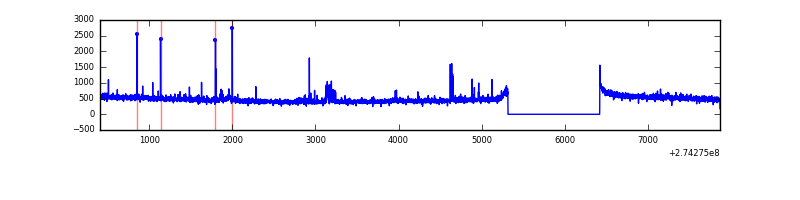 |
Top three noisy pixels from each quadrant. If the there are fewer than three noisy pixels in the level2.evt file, extra rows are filled as -1
| Pixel properties | Quadrant properties | ||||||
|---|---|---|---|---|---|---|---|
| Quadrant | DetID | PixID | Counts | Sigma | Mean | Median | Sigma |
| A | 13 | 210 | 11600 | 66.1 | 813 | 797 | 163.4 |
| A | 15 | 239 | 11413 | 64.95 | 813 | 797 | 163.4 |
| A | 0 | 226 | 7262 | 39.56 | 813 | 797 | 163.4 |
| B | 5 | 65 | 146173 | 944.51 | 803 | 783 | 153.9 |
| B | 0 | 219 | 29721 | 187.99 | 803 | 783 | 153.9 |
| B | 12 | 111 | 17504 | 108.63 | 803 | 783 | 153.9 |
| C | 3 | 233 | 128307 | 717.07 | 764 | 771 | 177.9 |
| C | 14 | 238 | 116739 | 652.03 | 764 | 771 | 177.9 |
| C | 13 | 61 | 5593 | 27.11 | 764 | 771 | 177.9 |
| D | 12 | 110 | 29774 | 149.7 | 785 | 762 | 193.8 |
| D | 2 | 234 | 26247 | 131.5 | 785 | 762 | 193.8 |
| D | 2 | 152 | 22058 | 109.89 | 785 | 762 | 193.8 |
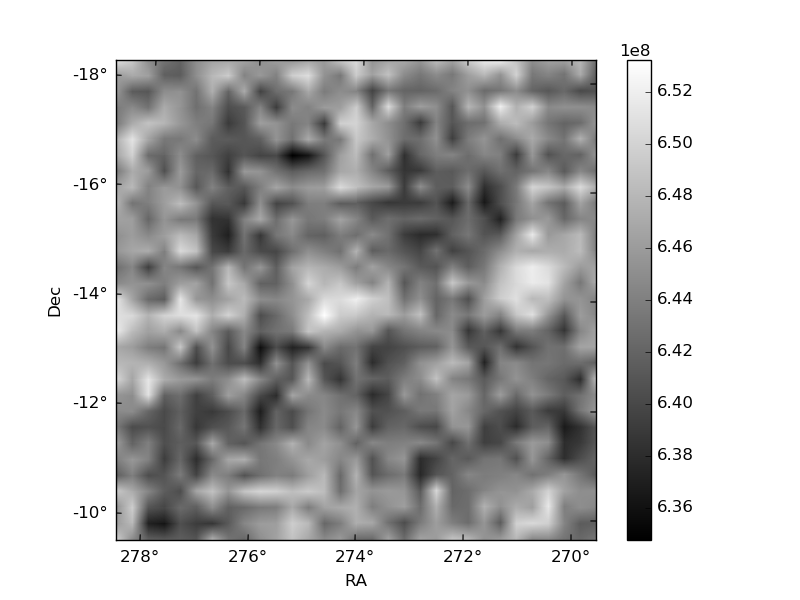
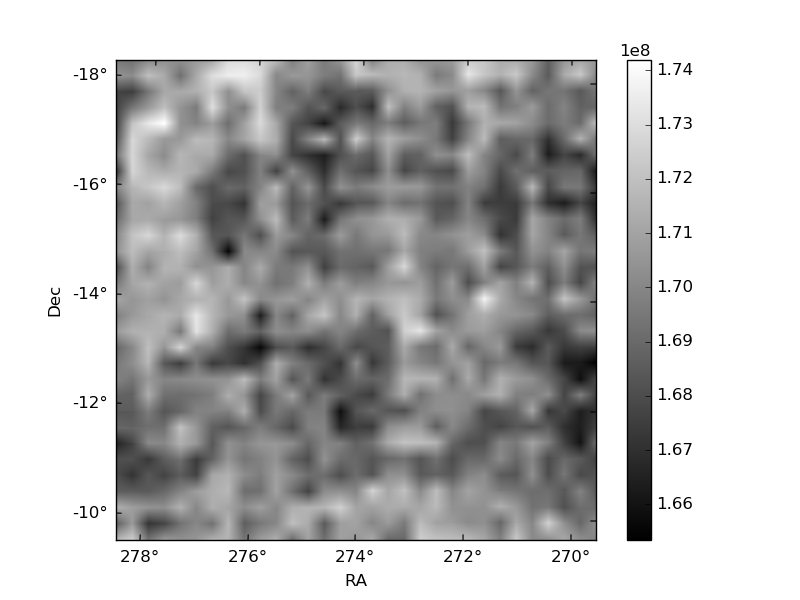
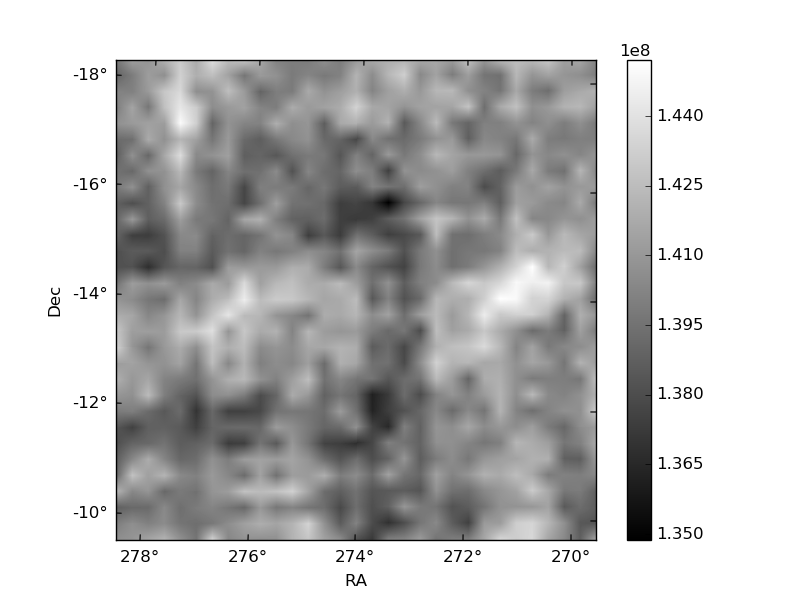
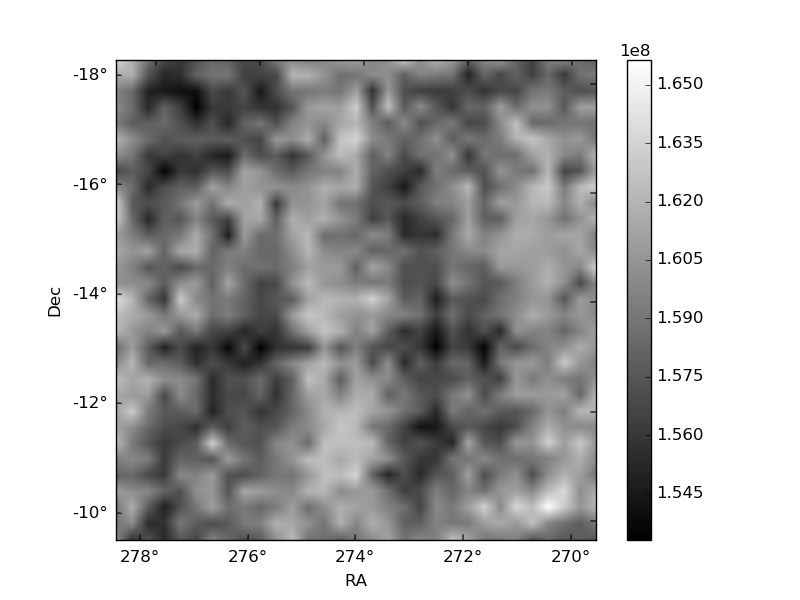
Histogram calculated using DETX and DETY for each event in the final _common_clean file
| Quadrant A | 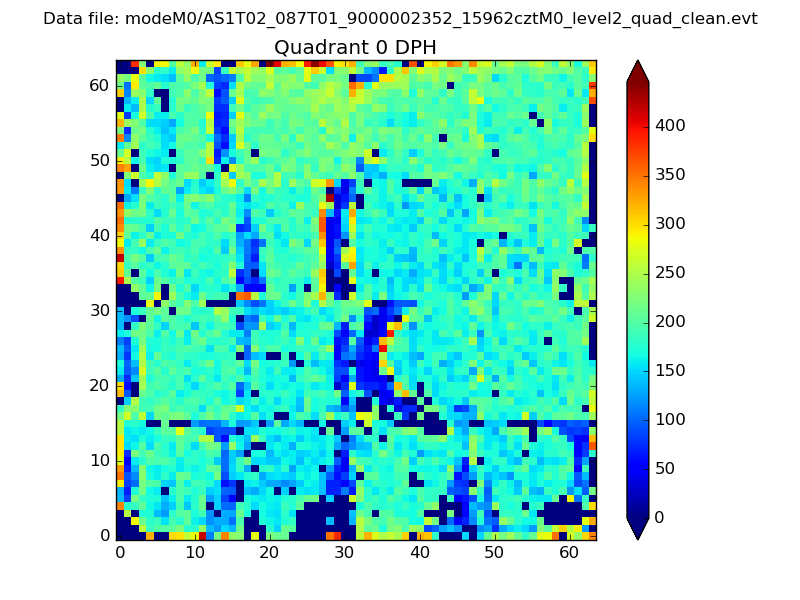 |
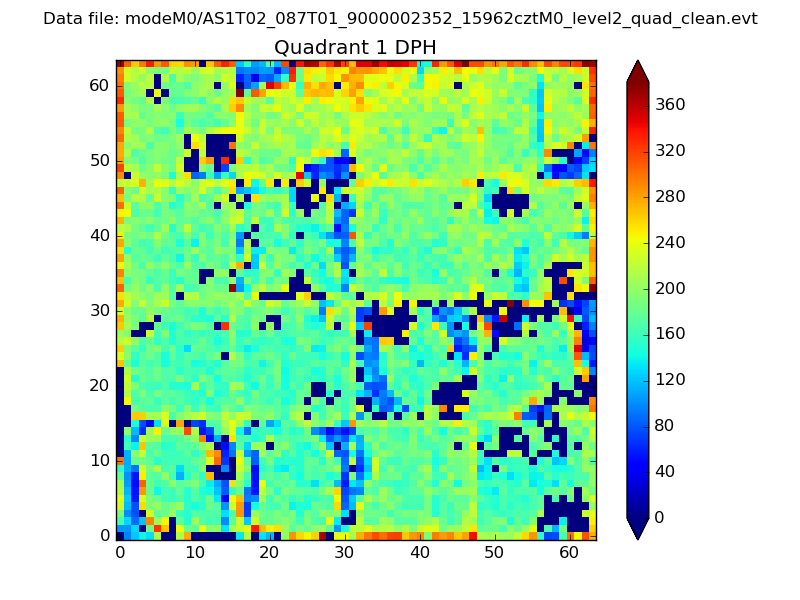 |
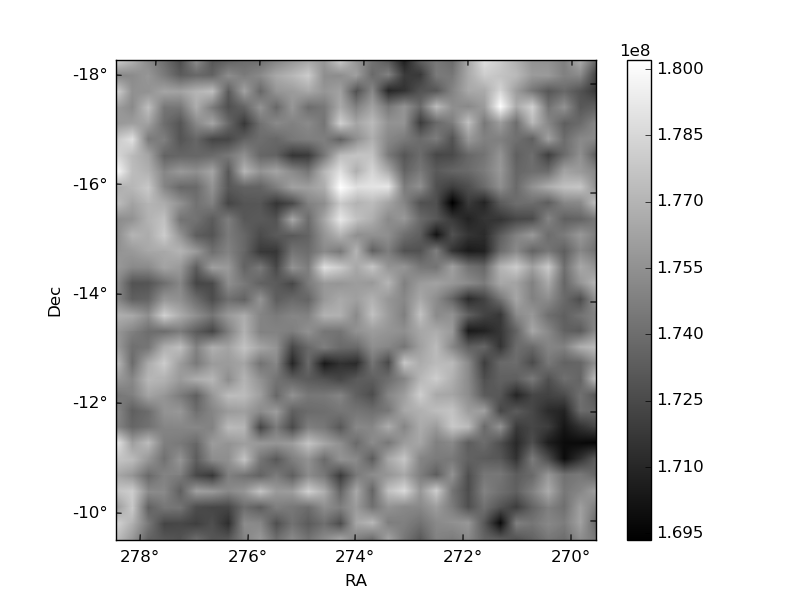
Quadrant B |
|---|---|---|---|
| Quadrant D | 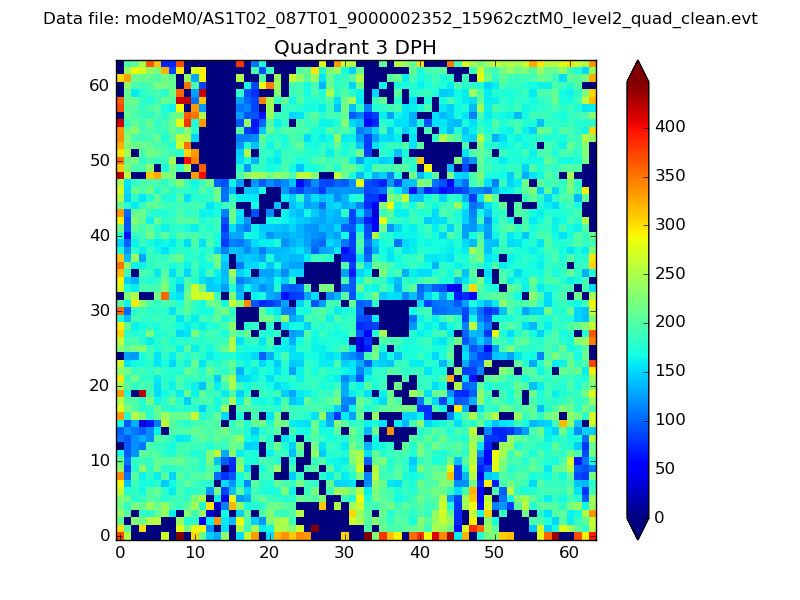 |
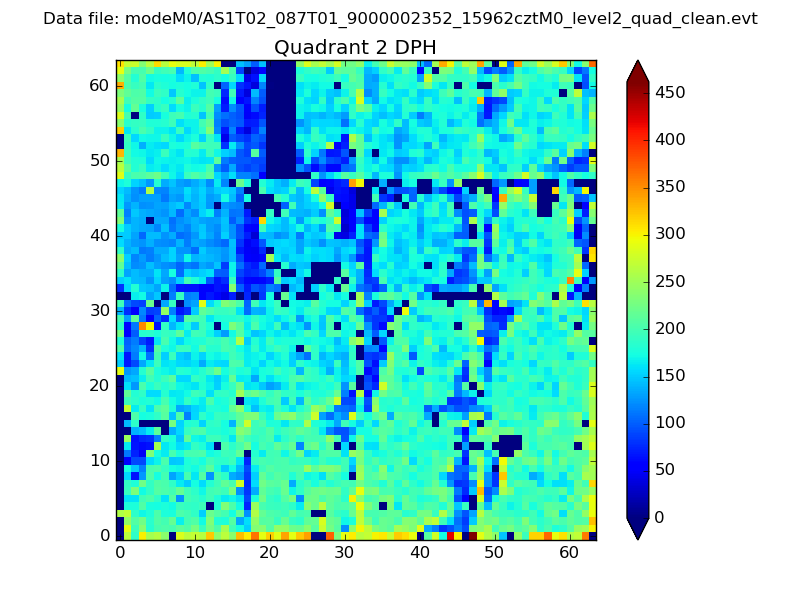 |
Quadrant C |
| Plot type | Count rate plots | Images |
|---|---|---|
| Comparison with Poisson distribution Blue bars denote a histogram of data divided into 1 sec bins. Red curve is a Poisson curve with rate = median count rate of data. |
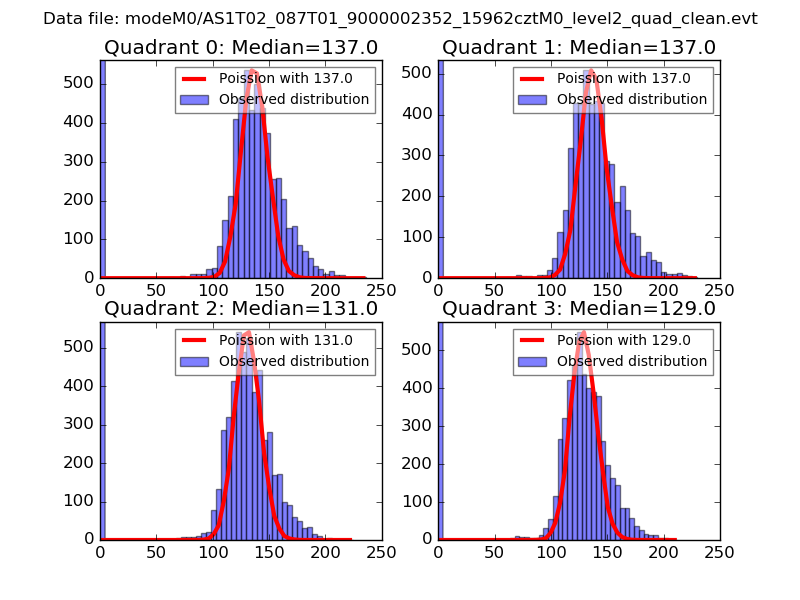 |
 |
| Quadrant-wise count rates Data is divided into 100 sec bins |
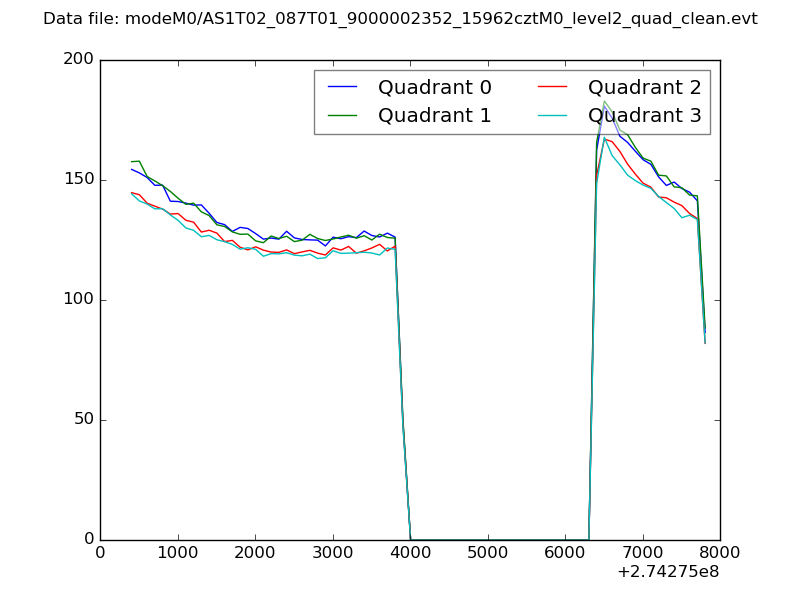 |
|
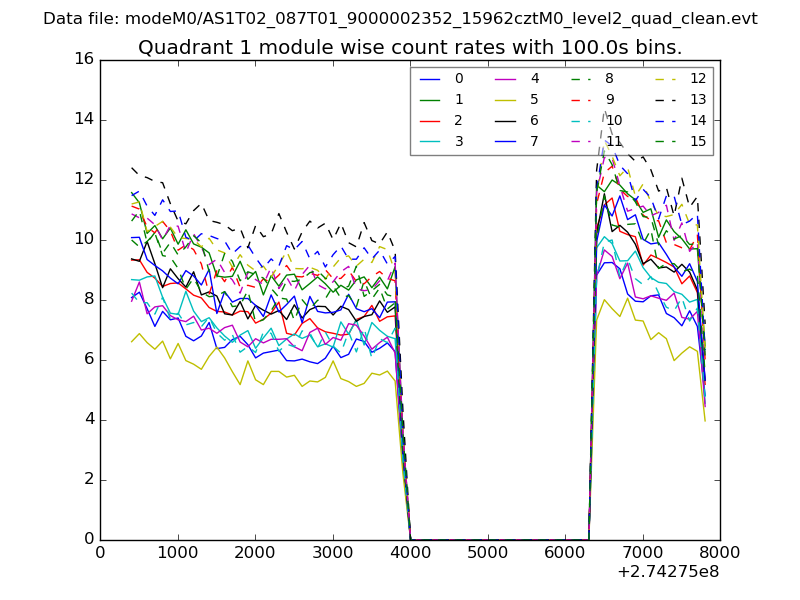
| Module-wise count rates for Quadrant A Data is divided into 100 sec bins |
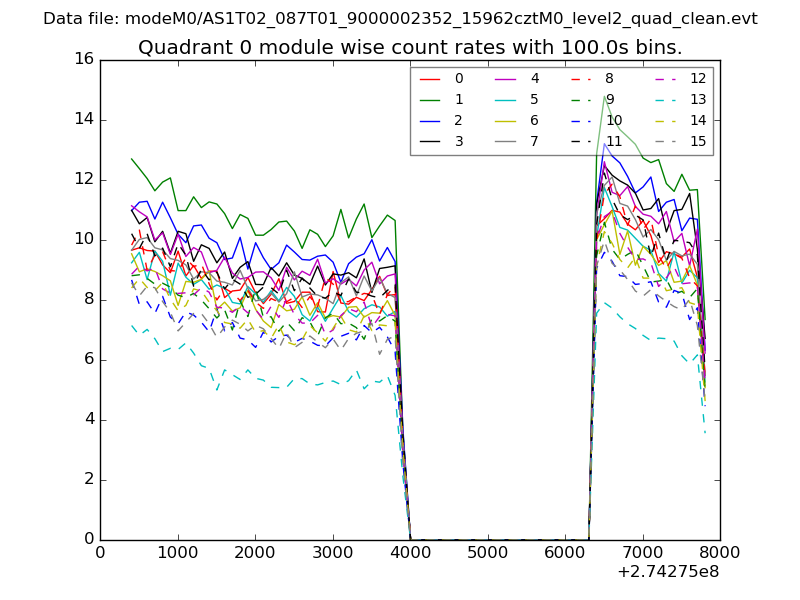 |
 |
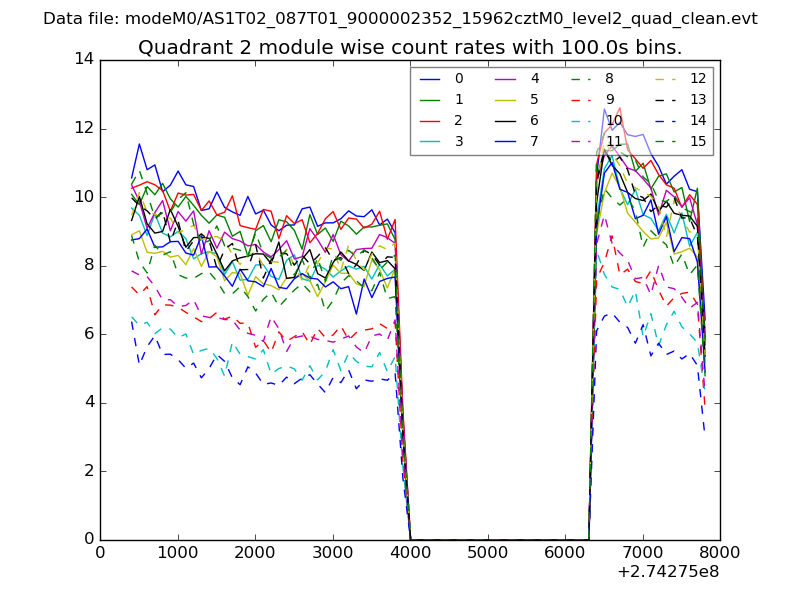
| Module-wise count rates for Quadrant B Data is divided into 100 sec bins |
 |
 |
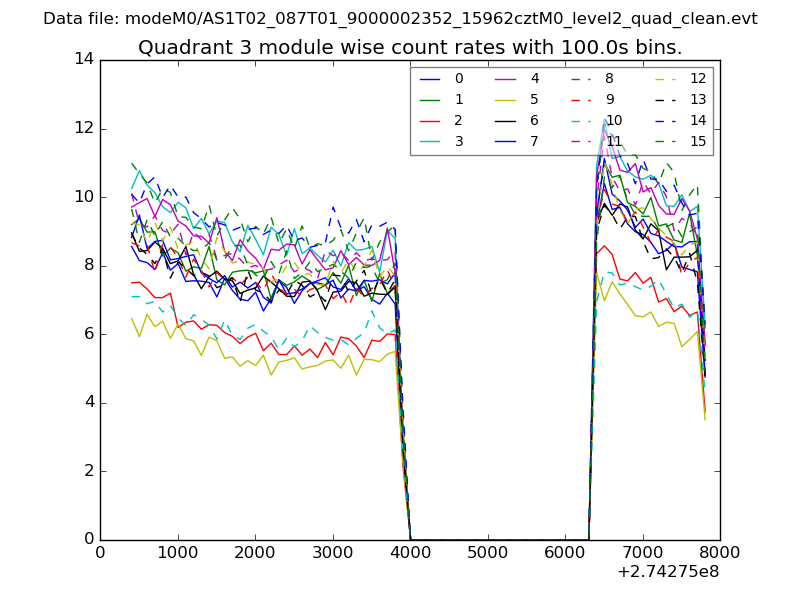
| Module-wise count rates for Quadrant C Data is divided into 100 sec bins |
 |
 |
| Module-wise count rates for Quadrant D Data is divided into 100 sec bins |
 |
 |
| Parameter | Plot |
|---|---|
| CZT HV Monitor | 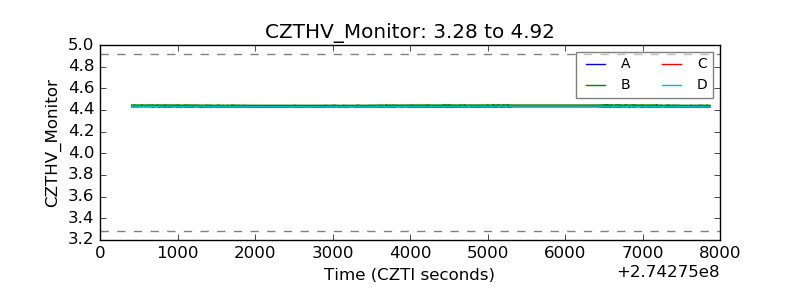 |
| D_VDD | 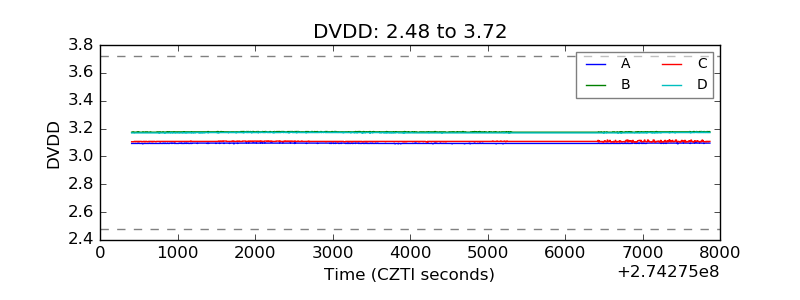 |
| Temperature 1 | 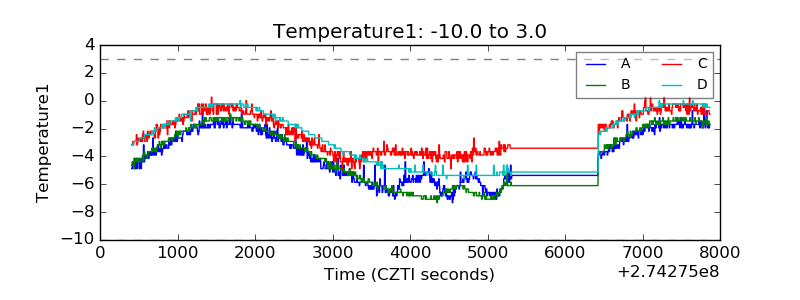 |
| Veto HV Monitor | 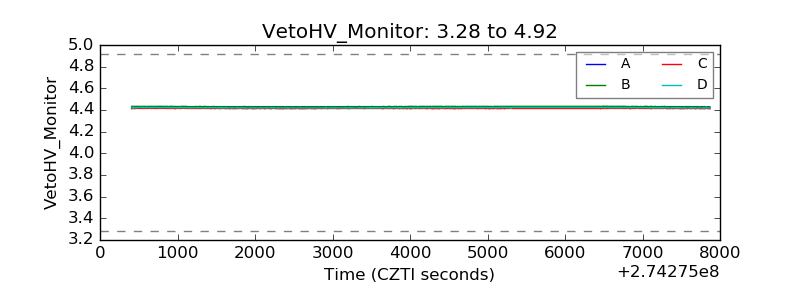 |
| Veto LLD | 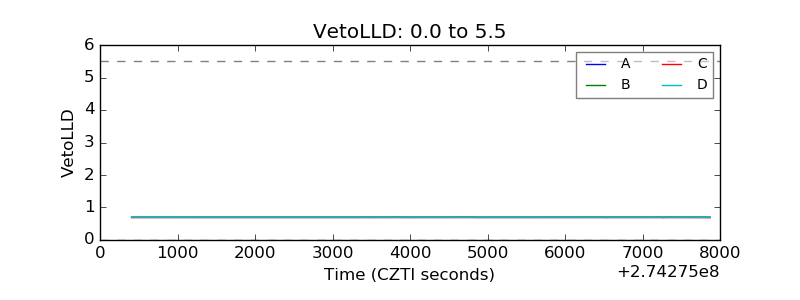 |
| Alpha Counter | 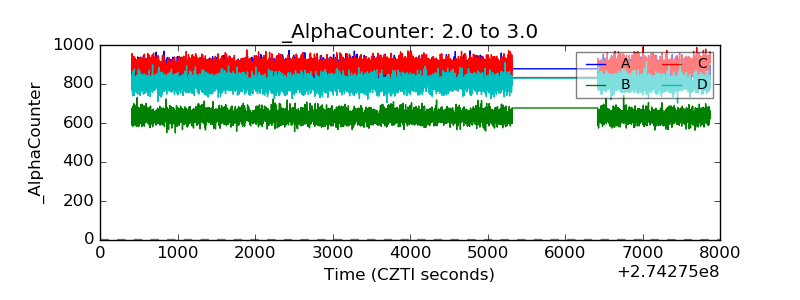 |
| _CPM_Rate | 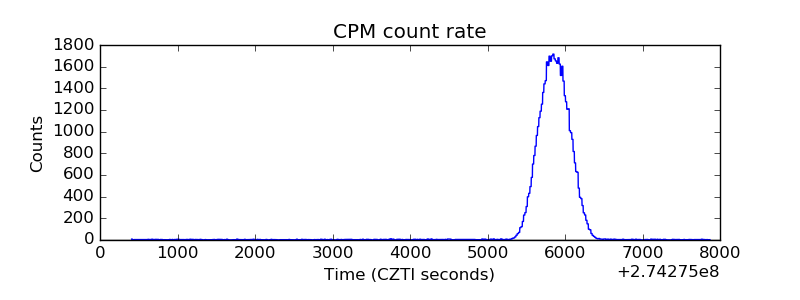 |
| CZT Counter | 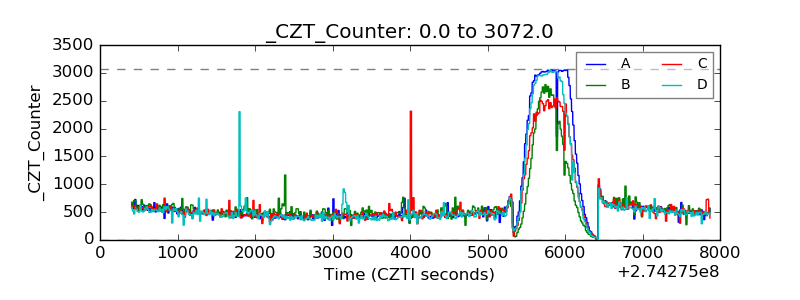 |
| +2.5 Volts monitor | 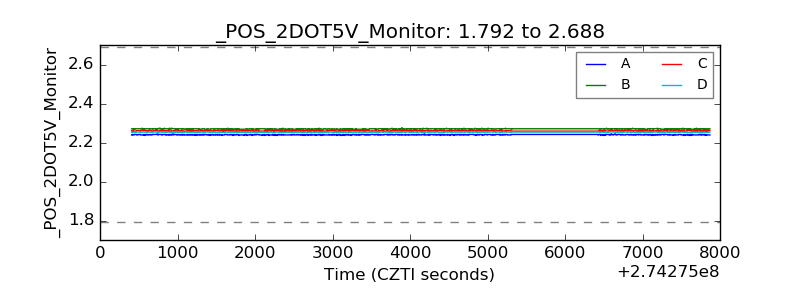 |
| +5 Volts monitor |  |
| _ROLL_ROT | 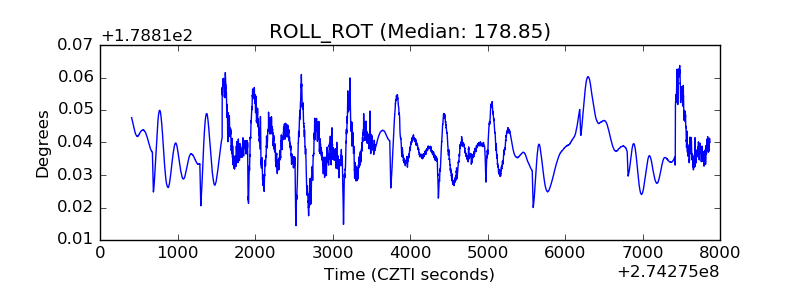 |
| _Roll_DEC | 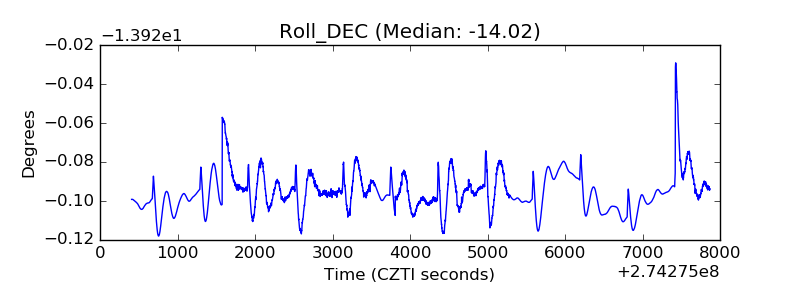 |
| _Roll_RA | 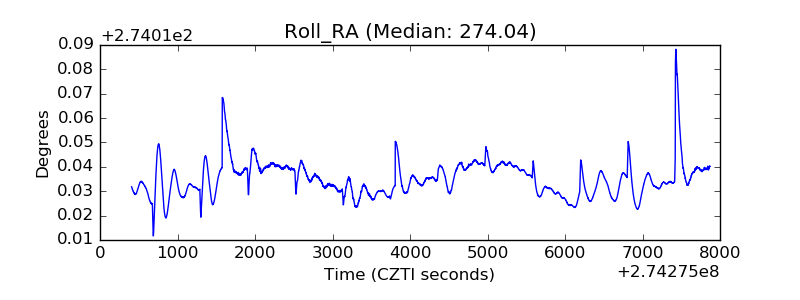 |
| Veto Counter | 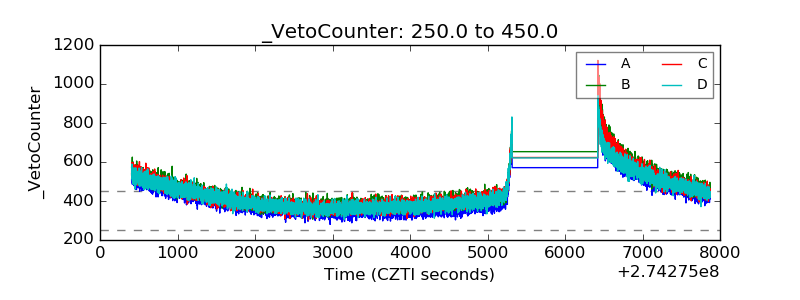 |