| Param | Original file | Final file |
|---|---|---|
| Filename | modeM0/AS1T02_087T01_9000002352_15964cztM0_level2.evt | modeM0/AS1T02_087T01_9000002352_15964cztM0_level2_quad_clean.evt |
| Size (bytes) | 463,443,840 | 100,601,280 |
| Size | 442.0 MB | 95.9 MB |
| Events in quadrant A | 3,330,002 | 671,807 |
| Events in quadrant B | 3,564,759 | 676,832 |
| Events in quadrant C | 3,395,661 | 635,900 |
| Events in quadrant D | 3,314,856 | 620,185 |
| Mode M0 | |||
|---|---|---|---|
| Quadrant | BADHDUFLAG | Total packets | Discarded packets |
| A | 0 | 13993 | 3 |
| B | 0 | 14835 | 2 |
| C | 0 | 14034 | 2 |
| D | 0 | 14019 | 2 |
| Mode M9 | |||
|---|---|---|---|
| Quadrant | BADHDUFLAG | Total packets | Discarded packets |
| A | 0 | 16 | 0 |
| B | 0 | 16 | 0 |
| C | 0 | 16 | 0 |
| D | 0 | 17 | 0 |
| Mode SS | |||
|---|---|---|---|
| Quadrant | BADHDUFLAG | Total packets | Discarded packets |
| A | 0 | 128 | 0 |
| B | 0 | 128 | 0 |
| C | 0 | 128 | 0 |
| D | 0 | 128 | 0 |
| Quadrant | Total seconds | Saturated seconds | Saturation percentage |
|---|---|---|---|
| A | 6337 | 88 | 1.388670% |
| B | 6337 | 90 | 1.420230% |
| C | 6337 | 108 | 1.704276% |
| D | 6337 | 48 | 0.757456% |
Noise dominated data is calculated using 1-second bins in cleaned event files. If a bin has >2000 counts, and if more than 50% of those come from <1% of pixels, then it is considered to be noise-dominated and hence unusable.
| Quadrant | # 1 sec bins | Bins with >0 counts | Bins with >2000 counts | High rate bins dominated by noise | Noise dominated (total time) | Noise dominated (detector-on time) | Marked lightcurve |
|---|---|---|---|---|---|---|---|
| A | 7623 | 6338 | 1 | 1 | 0.01% | 0.02% | 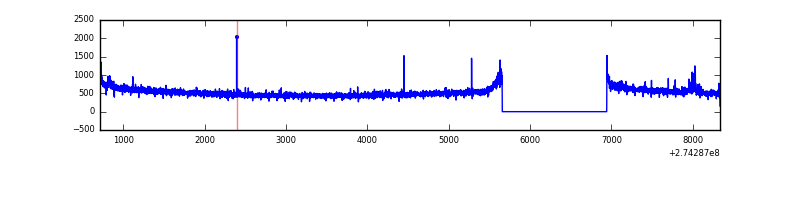 |
| B | 7623 | 6338 | 0 | 0 | 0.00% | 0.00% | 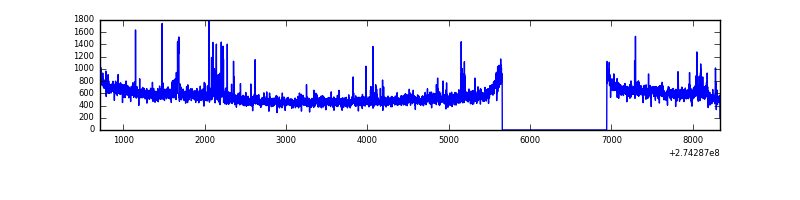 |
| C | 7623 | 6339 | 5 | 5 | 0.07% | 0.08% | 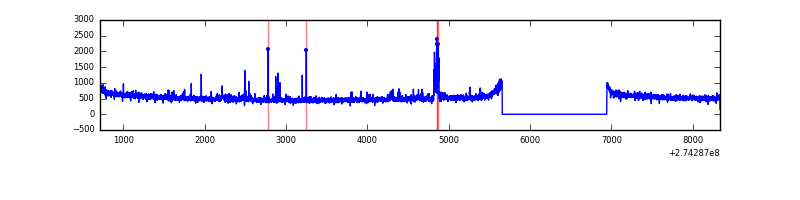 |
| D | 7623 | 6339 | 3 | 3 | 0.04% | 0.05% | 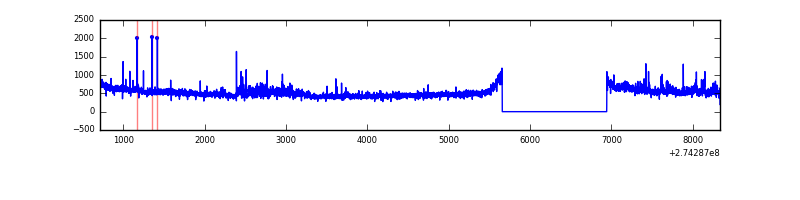 |
Top three noisy pixels from each quadrant. If the there are fewer than three noisy pixels in the level2.evt file, extra rows are filled as -1
| Pixel properties | Quadrant properties | ||||||
|---|---|---|---|---|---|---|---|
| Quadrant | DetID | PixID | Counts | Sigma | Mean | Median | Sigma |
| A | 15 | 239 | 67003 | 390.6 | 848 | 833 | 169.4 |
| A | 0 | 226 | 7800 | 41.12 | 848 | 833 | 169.4 |
| A | 12 | 194 | 6431 | 33.04 | 848 | 833 | 169.4 |
| B | 0 | 219 | 54951 | 341.85 | 843 | 827 | 158.3 |
| B | 0 | 189 | 41246 | 255.29 | 843 | 827 | 158.3 |
| B | 5 | 65 | 36539 | 225.56 | 843 | 827 | 158.3 |
| C | 3 | 233 | 162951 | 882.2 | 796 | 803 | 183.8 |
| C | 14 | 238 | 122822 | 663.87 | 796 | 803 | 183.8 |
| C | 13 | 61 | 5966 | 28.09 | 796 | 803 | 183.8 |
| D | 12 | 110 | 111447 | 555.94 | 812 | 788 | 199.0 |
| D | 2 | 152 | 105718 | 527.16 | 812 | 788 | 199.0 |
| D | 2 | 234 | 22622 | 109.69 | 812 | 788 | 199.0 |
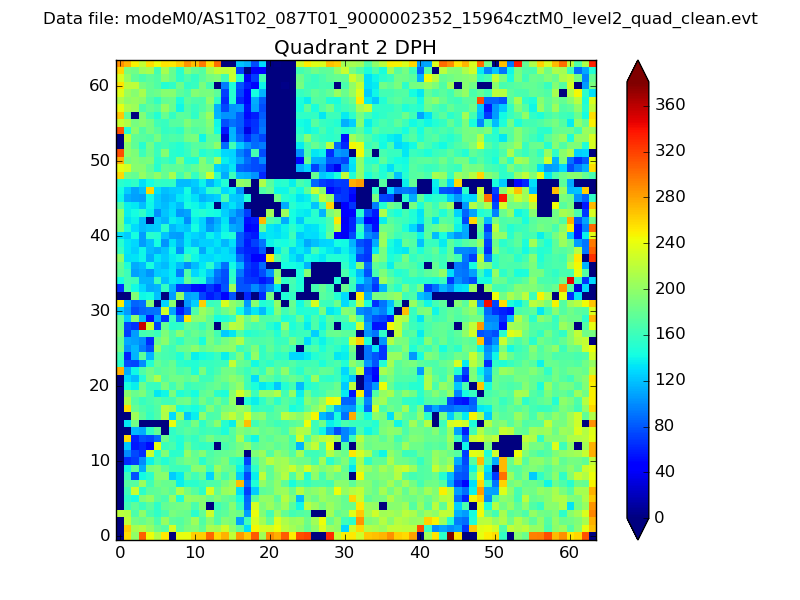
Histogram calculated using DETX and DETY for each event in the final _common_clean file
| Quadrant A |  |
 |
Quadrant B |
|---|---|---|---|
| Quadrant D |  |
 |
Quadrant C |
| Plot type | Count rate plots | Images |
|---|---|---|
| Comparison with Poisson distribution Blue bars denote a histogram of data divided into 1 sec bins. Red curve is a Poisson curve with rate = median count rate of data. |
 |
 |
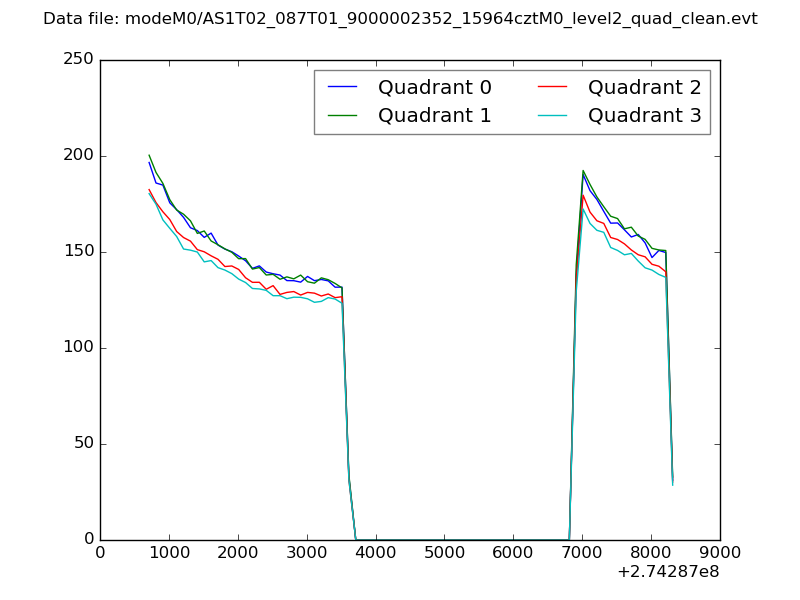
| Quadrant-wise count rates Data is divided into 100 sec bins |
 |
|
| Module-wise count rates for Quadrant A Data is divided into 100 sec bins |
 |
 |
| Module-wise count rates for Quadrant B Data is divided into 100 sec bins |
 |
 |
| Module-wise count rates for Quadrant C Data is divided into 100 sec bins |
 |
 |
| Module-wise count rates for Quadrant D Data is divided into 100 sec bins |
 |
 |
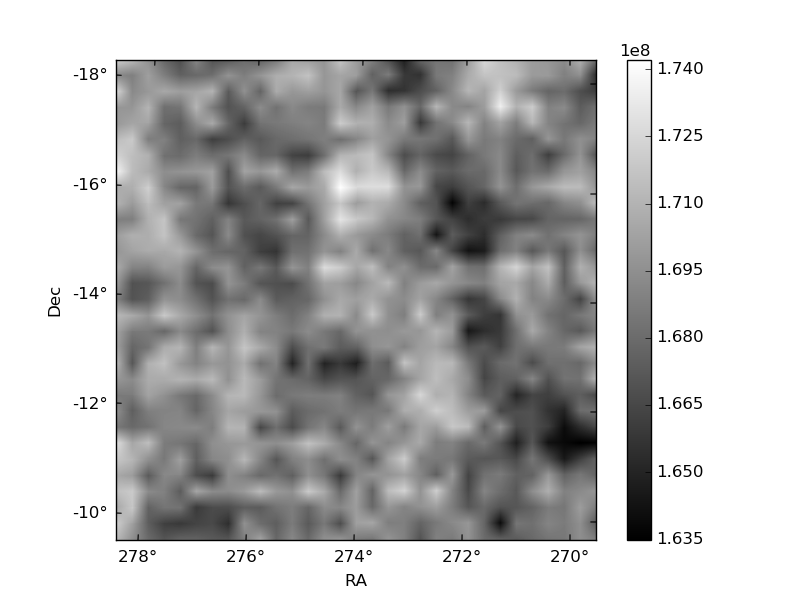
| Parameter | Plot |
|---|---|
| CZT HV Monitor |  |
| D_VDD | 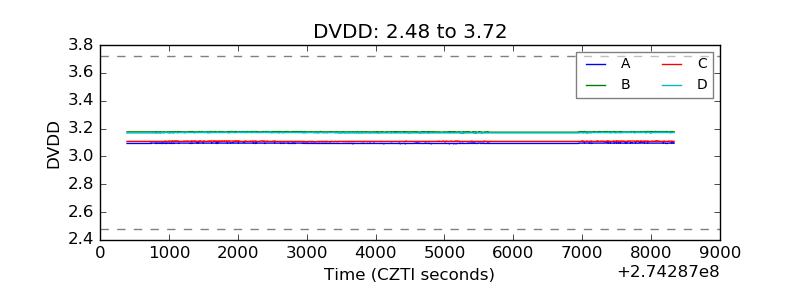 |
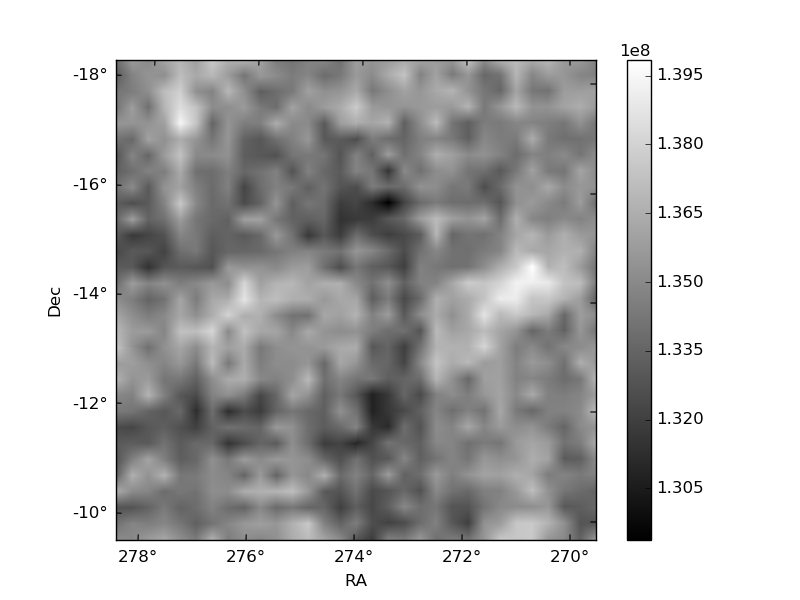
| Temperature 1 | 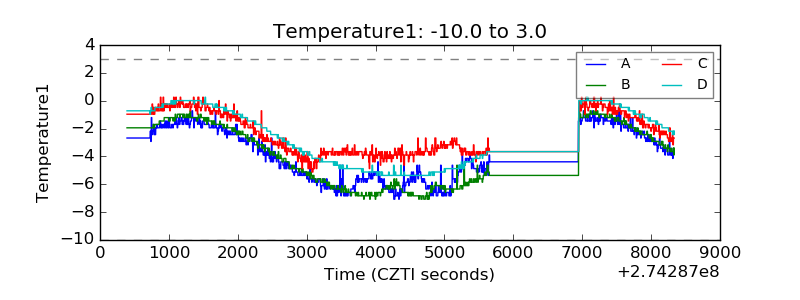 |
| Veto HV Monitor | 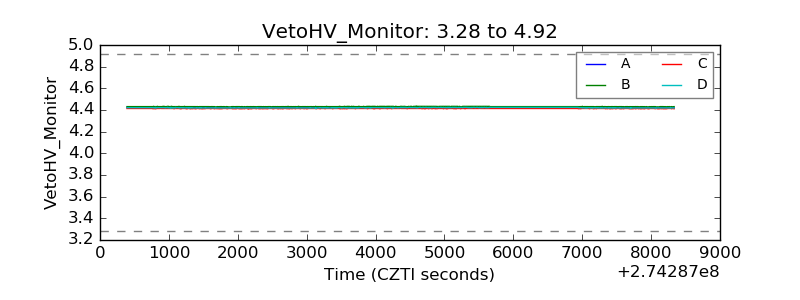 |
| Veto LLD | 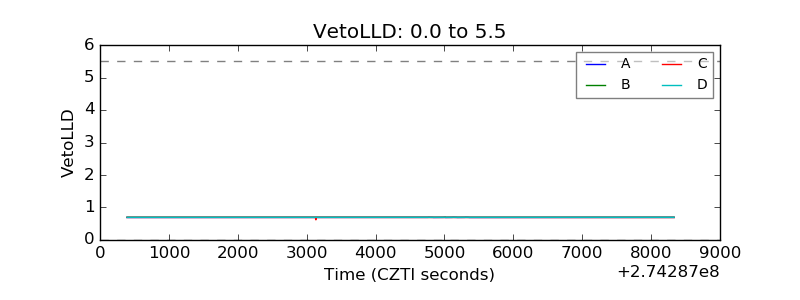 |
| Alpha Counter | 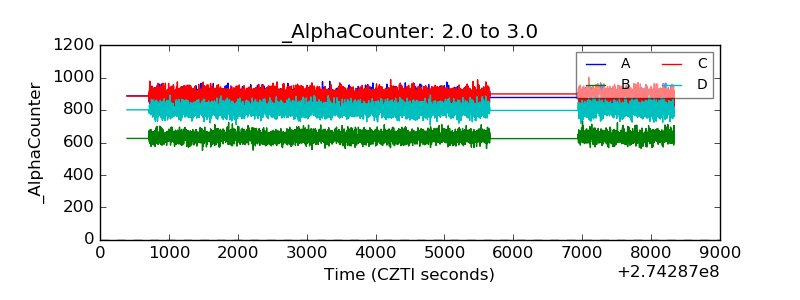 |
| _CPM_Rate | 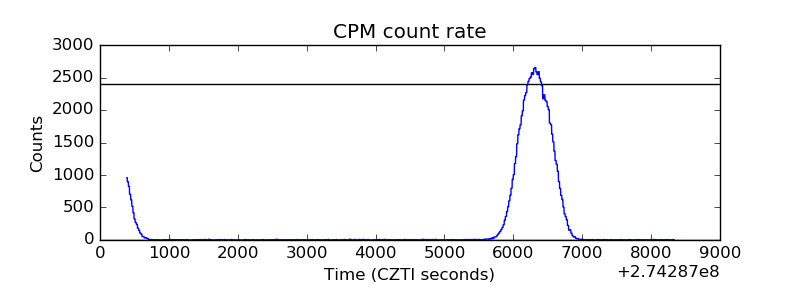 |
| CZT Counter | 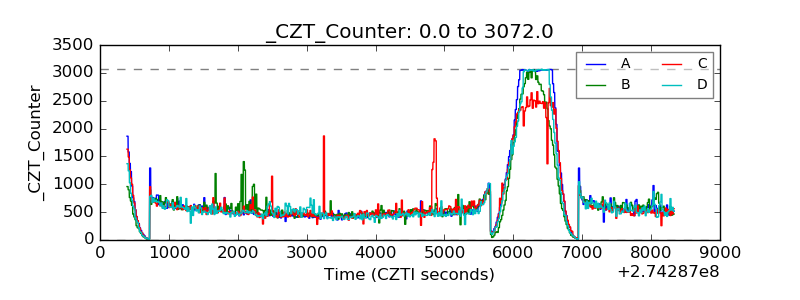 |
| +2.5 Volts monitor | 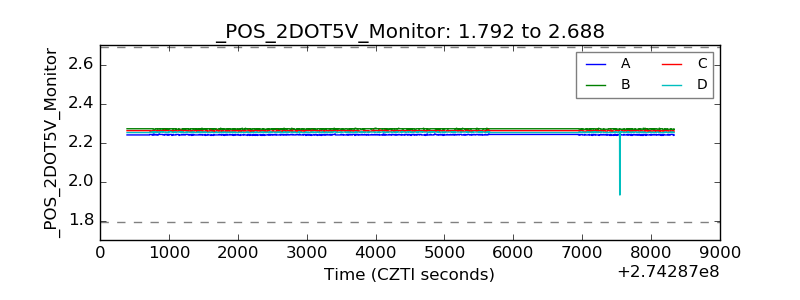 |
| +5 Volts monitor |  |
| _ROLL_ROT | 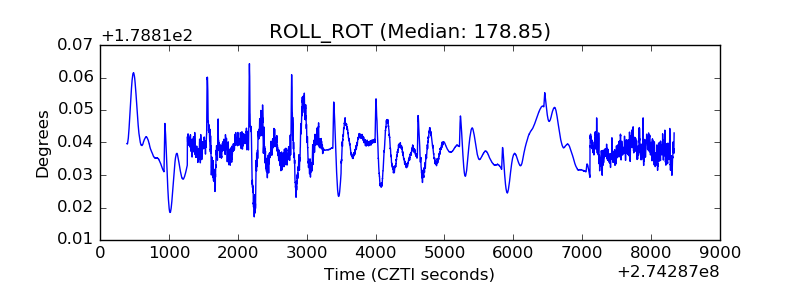 |
| _Roll_DEC | 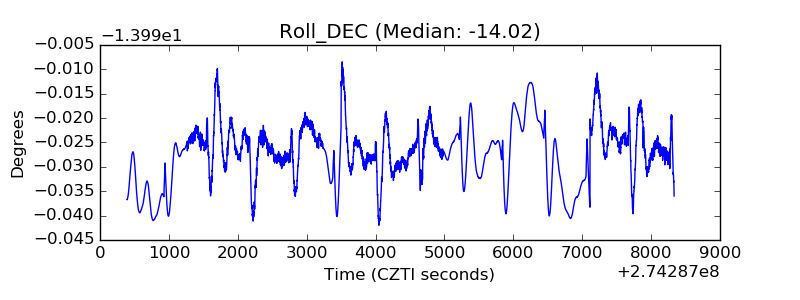 |
| _Roll_RA | 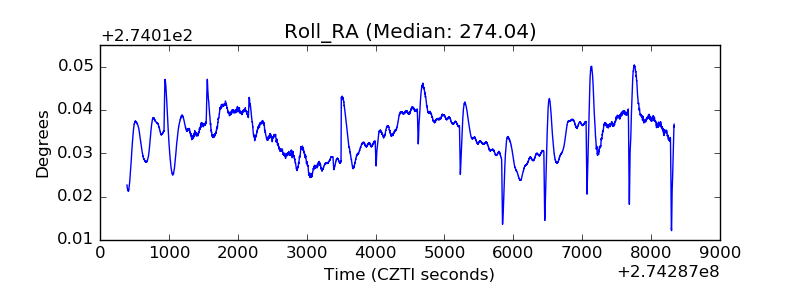 |
| Veto Counter |  |