| Param | Original file | Final file |
|---|---|---|
| Filename | modeM0/AS1T02_087T01_9000002352_15965cztM0_level2.evt | modeM0/AS1T02_087T01_9000002352_15965cztM0_level2_quad_clean.evt |
| Size (bytes) | 436,475,520 | 88,980,480 |
| Size | 416.3 MB | 84.9 MB |
| Events in quadrant A | 3,159,468 | 582,877 |
| Events in quadrant B | 3,424,870 | 591,986 |
| Events in quadrant C | 3,105,935 | 557,045 |
| Events in quadrant D | 3,116,619 | 539,605 |
| Mode M0 | |||
|---|---|---|---|
| Quadrant | BADHDUFLAG | Total packets | Discarded packets |
| A | 0 | 13222 | 2 |
| B | 0 | 14202 | 1 |
| C | 0 | 12884 | 1 |
| D | 0 | 13254 | 1 |
| Mode M9 | |||
|---|---|---|---|
| Quadrant | BADHDUFLAG | Total packets | Discarded packets |
| A | 0 | 14 | 0 |
| B | 0 | 14 | 0 |
| C | 0 | 14 | 0 |
| D | 0 | 14 | 0 |
| Mode SS | |||
|---|---|---|---|
| Quadrant | BADHDUFLAG | Total packets | Discarded packets |
| A | 0 | 122 | 0 |
| B | 0 | 122 | 0 |
| C | 0 | 122 | 0 |
| D | 0 | 122 | 0 |
| Quadrant | Total seconds | Saturated seconds | Saturation percentage |
|---|---|---|---|
| A | 6064 | 85 | 1.401715% |
| B | 6064 | 89 | 1.467678% |
| C | 6064 | 113 | 1.863456% |
| D | 6064 | 49 | 0.808047% |
Noise dominated data is calculated using 1-second bins in cleaned event files. If a bin has >2000 counts, and if more than 50% of those come from <1% of pixels, then it is considered to be noise-dominated and hence unusable.
| Quadrant | # 1 sec bins | Bins with >0 counts | Bins with >2000 counts | High rate bins dominated by noise | Noise dominated (total time) | Noise dominated (detector-on time) | Marked lightcurve |
|---|---|---|---|---|---|---|---|
| A | 7400 | 6066 | 7 | 7 | 0.09% | 0.12% | 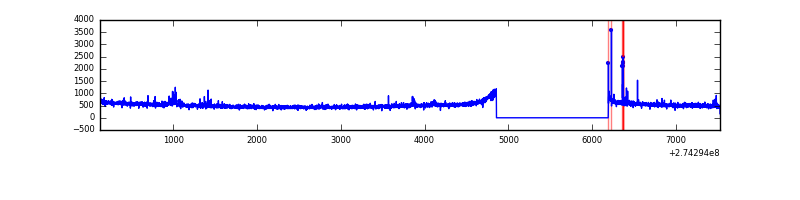 |
| B | 7400 | 6065 | 4 | 4 | 0.05% | 0.07% | 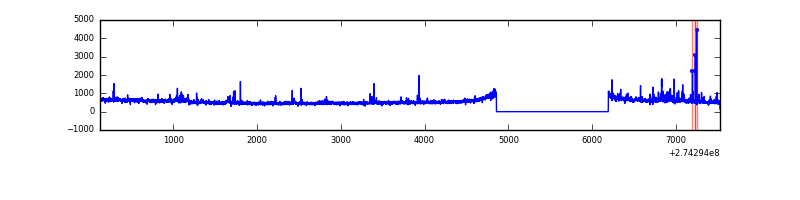 |
| C | 7400 | 6066 | 0 | 0 | 0.00% | 0.00% | 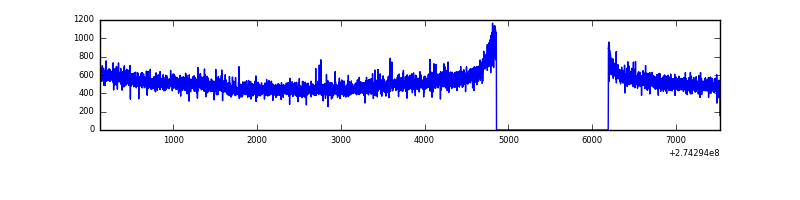 |
| D | 7400 | 6066 | 3 | 3 | 0.04% | 0.05% | 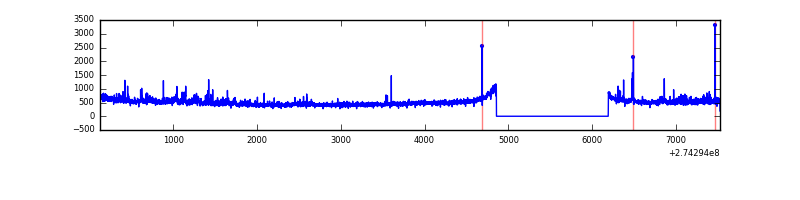 |
Top three noisy pixels from each quadrant. If the there are fewer than three noisy pixels in the level2.evt file, extra rows are filled as -1
| Pixel properties | Quadrant properties | ||||||
|---|---|---|---|---|---|---|---|
| Quadrant | DetID | PixID | Counts | Sigma | Mean | Median | Sigma |
| A | 15 | 239 | 75202 | 459.5 | 798 | 785 | 162.0 |
| A | 13 | 248 | 15817 | 92.82 | 798 | 785 | 162.0 |
| A | 0 | 226 | 7295 | 40.2 | 798 | 785 | 162.0 |
| B | 0 | 219 | 69467 | 454.72 | 799 | 781 | 151.1 |
| B | 0 | 229 | 45957 | 299.08 | 799 | 781 | 151.1 |
| B | 0 | 189 | 43958 | 285.84 | 799 | 781 | 151.1 |
| C | 14 | 238 | 116878 | 662.14 | 755 | 762 | 175.4 |
| C | 3 | 233 | 42067 | 235.54 | 755 | 762 | 175.4 |
| C | 13 | 61 | 5588 | 27.52 | 755 | 762 | 175.4 |
| D | 12 | 110 | 100549 | 538.41 | 762 | 741 | 185.4 |
| D | 2 | 152 | 86444 | 462.32 | 762 | 741 | 185.4 |
| D | 2 | 234 | 19145 | 99.28 | 762 | 741 | 185.4 |
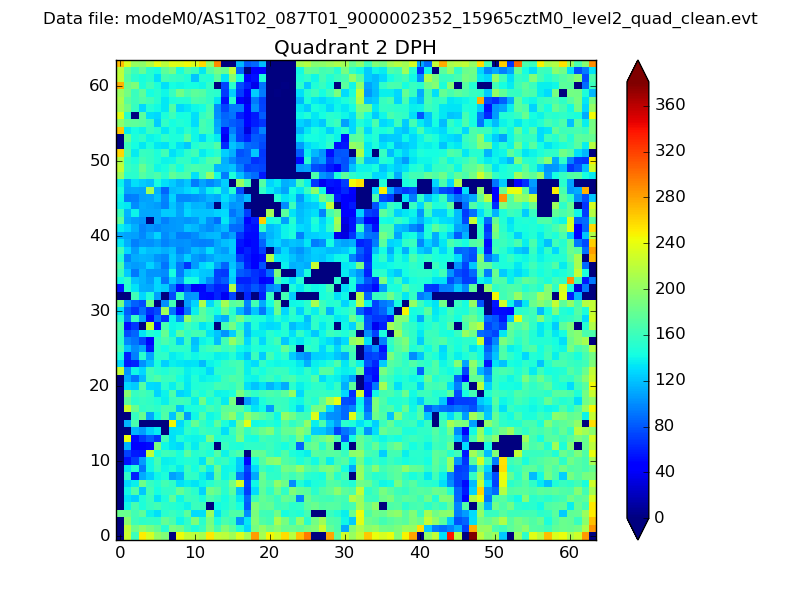
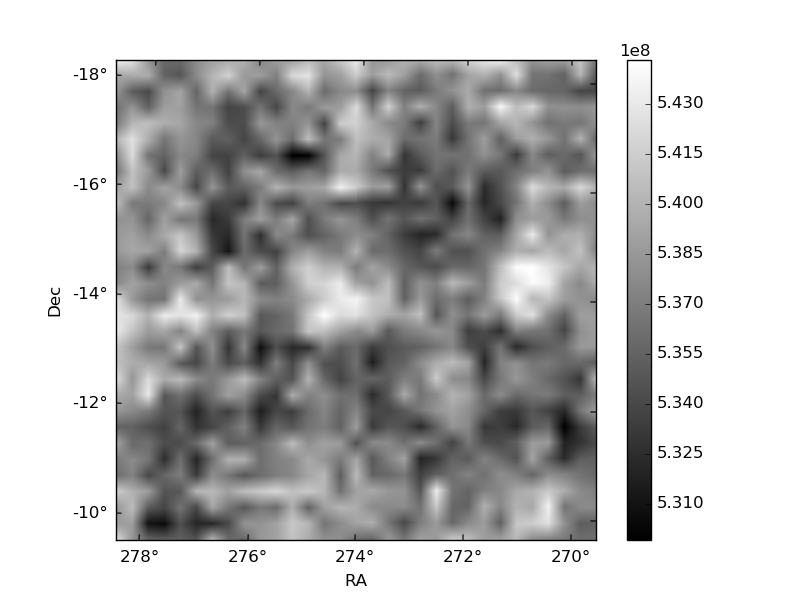
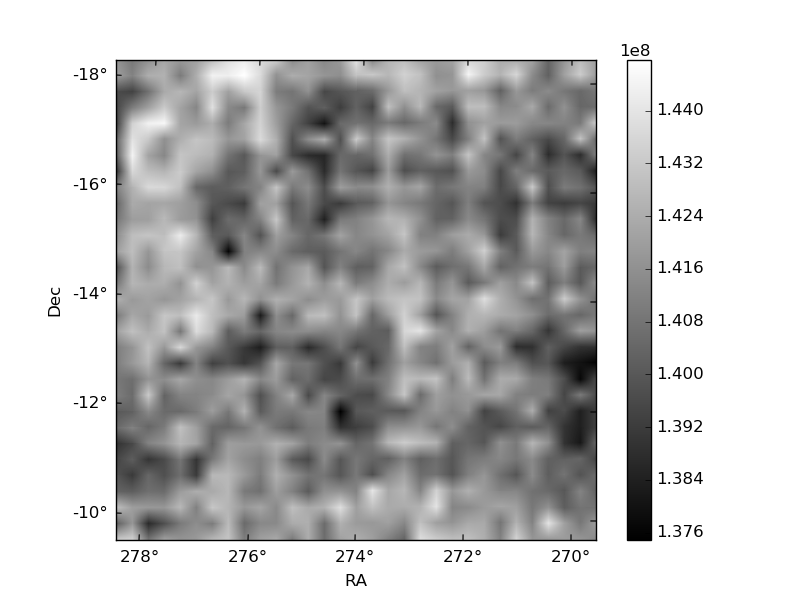
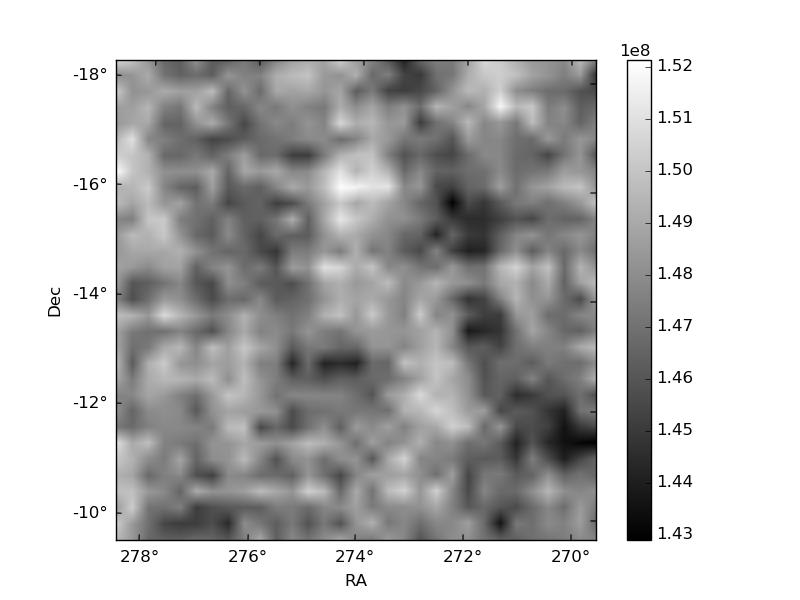
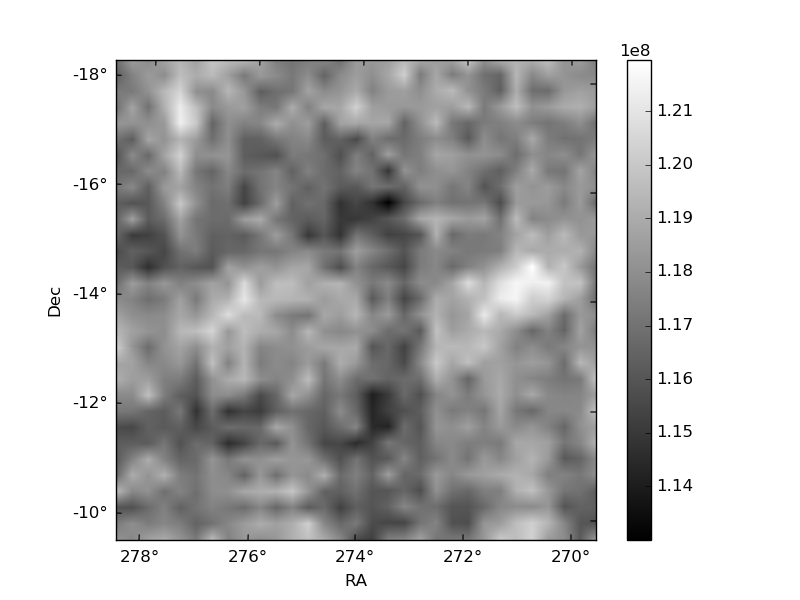
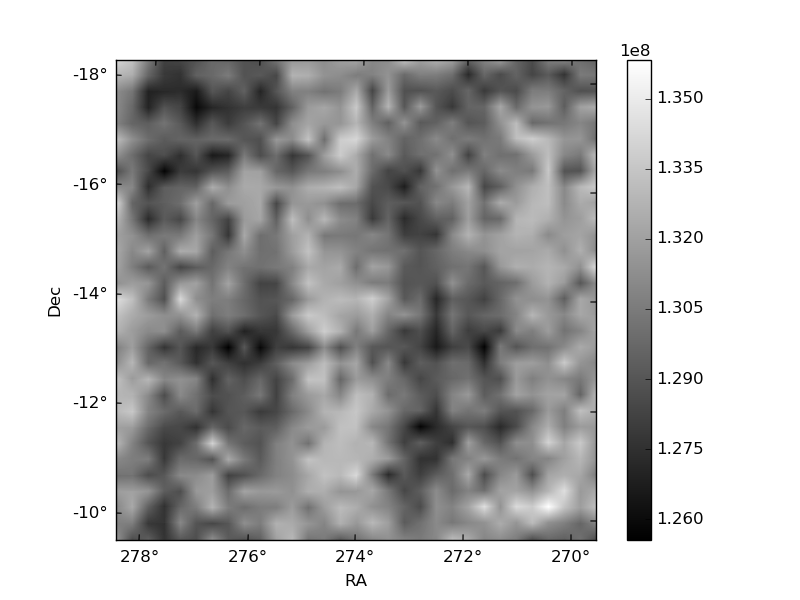
Histogram calculated using DETX and DETY for each event in the final _common_clean file
| Quadrant A | 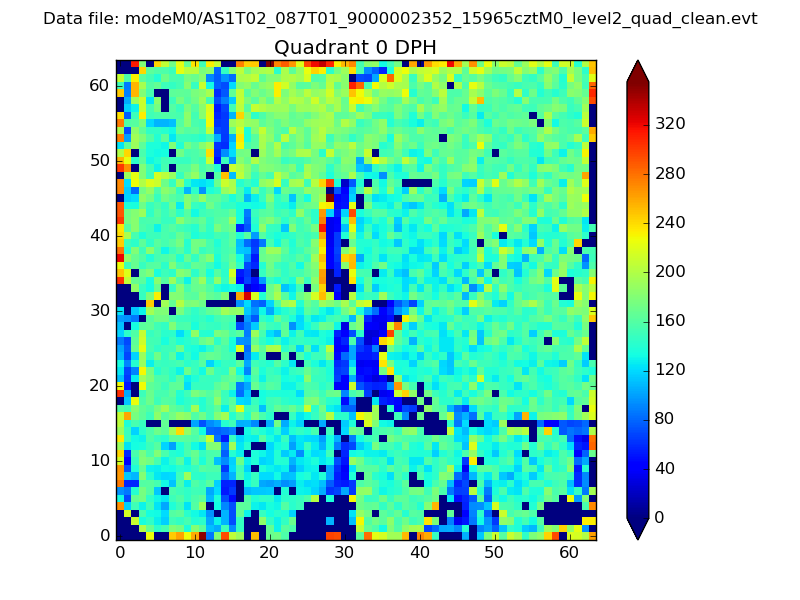 |
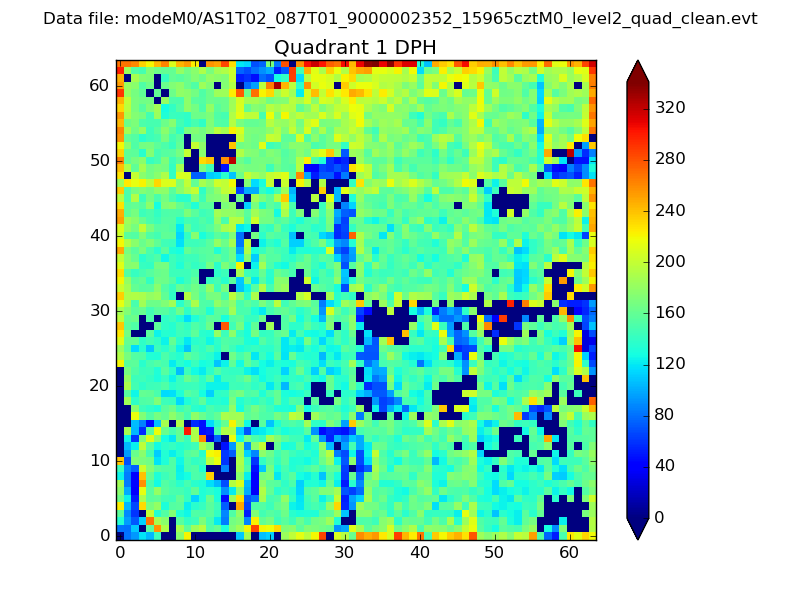 |
Quadrant B |
|---|---|---|---|
| Quadrant D | 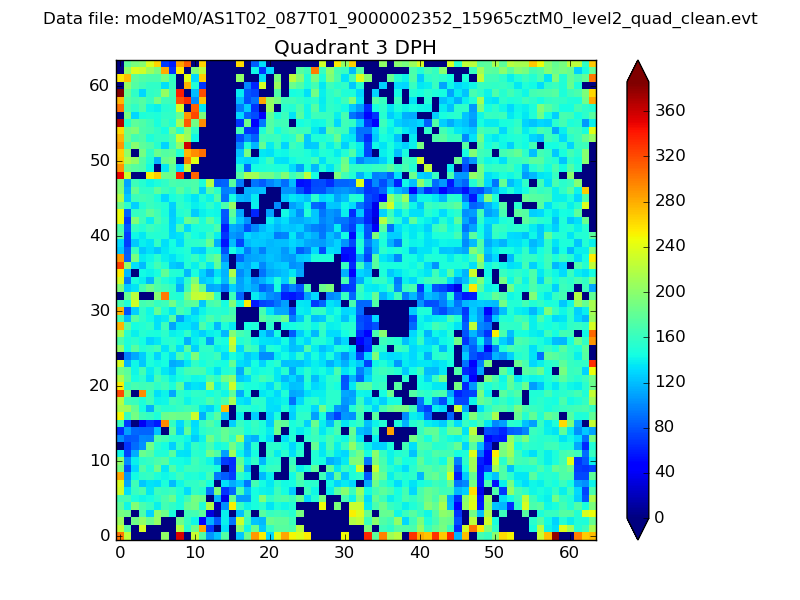 |
 |
Quadrant C |
| Plot type | Count rate plots | Images |
|---|---|---|
| Comparison with Poisson distribution Blue bars denote a histogram of data divided into 1 sec bins. Red curve is a Poisson curve with rate = median count rate of data. |
 |
 |
| Quadrant-wise count rates Data is divided into 100 sec bins |
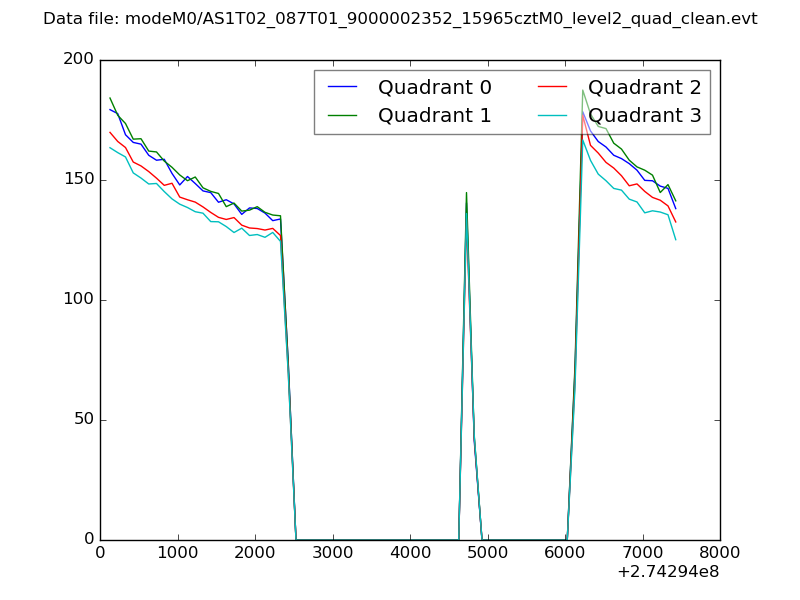 |
|
| Module-wise count rates for Quadrant A Data is divided into 100 sec bins |
 |
 |
| Module-wise count rates for Quadrant B Data is divided into 100 sec bins |
 |
 |
| Module-wise count rates for Quadrant C Data is divided into 100 sec bins |
 |
 |
| Module-wise count rates for Quadrant D Data is divided into 100 sec bins |
 |
 |
| Parameter | Plot |
|---|---|
| CZT HV Monitor |  |
| D_VDD |  |
| Temperature 1 | 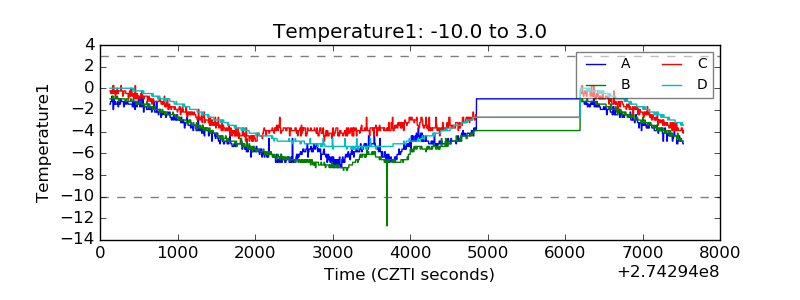 |
| Veto HV Monitor | 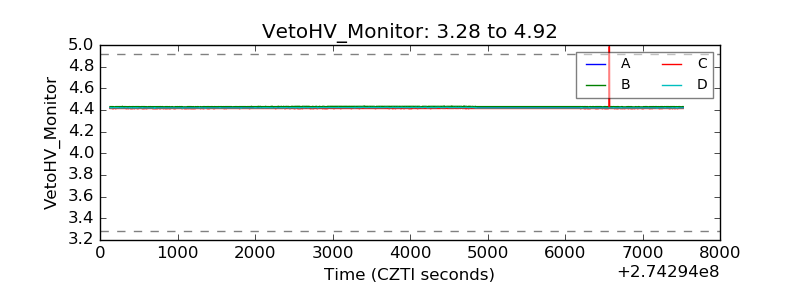 |
| Veto LLD |  |
| Alpha Counter | 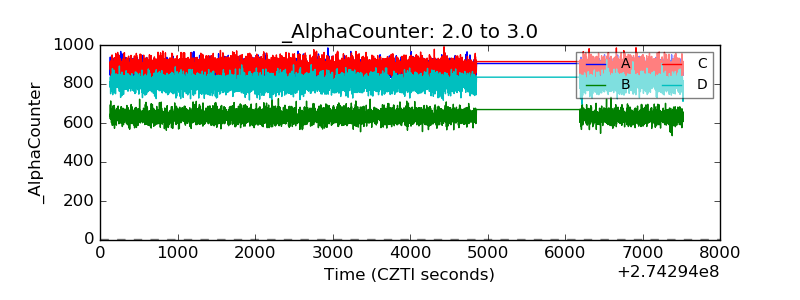 |
| _CPM_Rate | 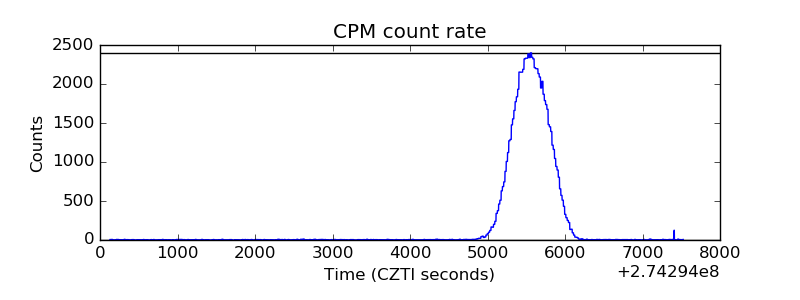 |
| CZT Counter | 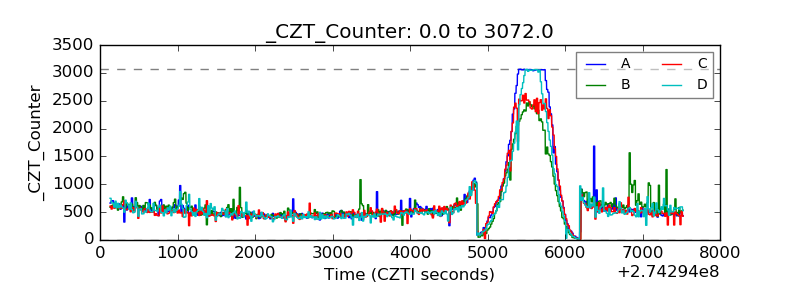 |
| +2.5 Volts monitor |  |
| +5 Volts monitor | 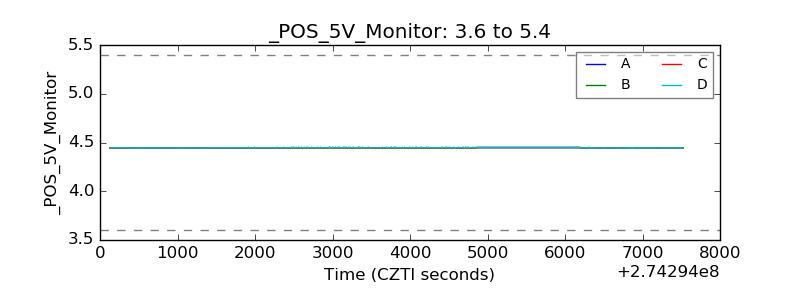 |
| _ROLL_ROT |  |
| _Roll_DEC | 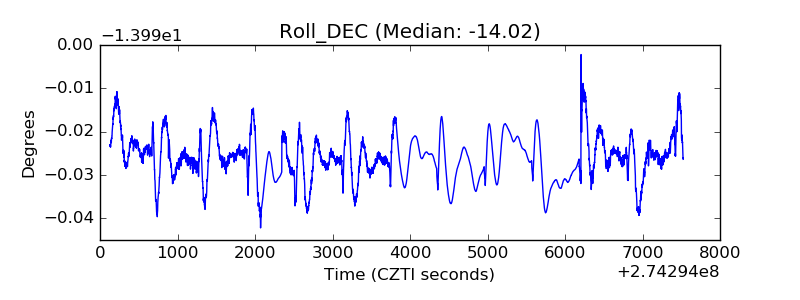 |
| _Roll_RA | 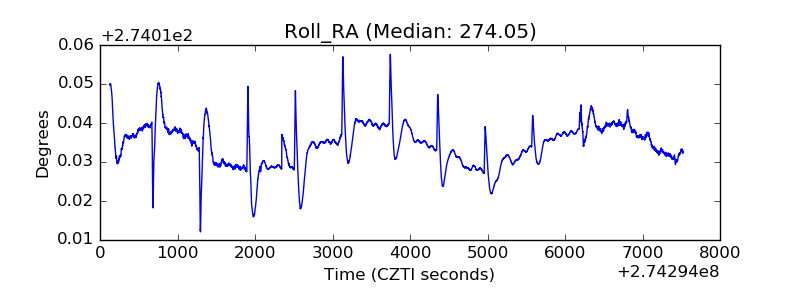 |
| Veto Counter |  |