| Param | Original file | Final file |
|---|---|---|
| Filename | modeM0/AS1T02_087T01_9000002352_15966cztM0_level2.evt | modeM0/AS1T02_087T01_9000002352_15966cztM0_level2_quad_clean.evt |
| Size (bytes) | 453,170,880 | 91,468,800 |
| Size | 432.2 MB | 87.2 MB |
| Events in quadrant A | 3,217,740 | 596,745 |
| Events in quadrant B | 3,658,859 | 608,966 |
| Events in quadrant C | 3,281,465 | 573,004 |
| Events in quadrant D | 3,140,355 | 553,907 |
| Mode M0 | |||
|---|---|---|---|
| Quadrant | BADHDUFLAG | Total packets | Discarded packets |
| A | 0 | 13533 | 3 |
| B | 0 | 14914 | 2 |
| C | 0 | 13649 | 2 |
| D | 0 | 13468 | 2 |
| Mode M9 | |||
|---|---|---|---|
| Quadrant | BADHDUFLAG | Total packets | Discarded packets |
| A | 0 | 23 | 0 |
| B | 0 | 23 | 0 |
| C | 0 | 23 | 0 |
| D | 0 | 24 | 0 |
| Mode SS | |||
|---|---|---|---|
| Quadrant | BADHDUFLAG | Total packets | Discarded packets |
| A | 0 | 126 | 0 |
| B | 0 | 126 | 0 |
| C | 0 | 126 | 0 |
| D | 0 | 126 | 0 |
| Quadrant | Total seconds | Saturated seconds | Saturation percentage |
|---|---|---|---|
| A | 6274 | 73 | 1.163532% |
| B | 6274 | 90 | 1.434492% |
| C | 6274 | 130 | 2.072043% |
| D | 6274 | 36 | 0.573797% |
Noise dominated data is calculated using 1-second bins in cleaned event files. If a bin has >2000 counts, and if more than 50% of those come from <1% of pixels, then it is considered to be noise-dominated and hence unusable.
| Quadrant | # 1 sec bins | Bins with >0 counts | Bins with >2000 counts | High rate bins dominated by noise | Noise dominated (total time) | Noise dominated (detector-on time) | Marked lightcurve |
|---|---|---|---|---|---|---|---|
| A | 7585 | 6276 | 13 | 13 | 0.17% | 0.21% | 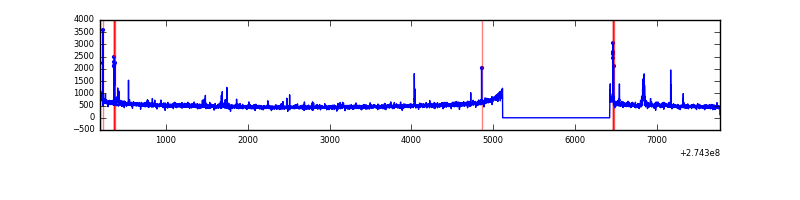 |
| B | 7585 | 6276 | 7 | 7 | 0.09% | 0.11% |  |
| C | 7585 | 6276 | 23 | 23 | 0.30% | 0.37% | 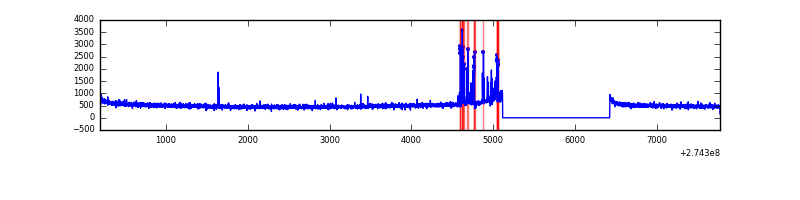 |
| D | 7585 | 6276 | 4 | 4 | 0.05% | 0.06% | 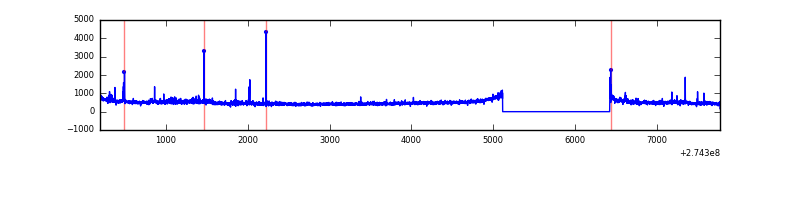 |
Top three noisy pixels from each quadrant. If the there are fewer than three noisy pixels in the level2.evt file, extra rows are filled as -1
| Pixel properties | Quadrant properties | ||||||
|---|---|---|---|---|---|---|---|
| Quadrant | DetID | PixID | Counts | Sigma | Mean | Median | Sigma |
| A | 15 | 239 | 85869 | 517.18 | 808 | 793 | 164.5 |
| A | 13 | 248 | 12103 | 68.75 | 808 | 793 | 164.5 |
| A | 13 | 210 | 9299 | 51.71 | 808 | 793 | 164.5 |
| B | 4 | 216 | 101856 | 654.46 | 816 | 798 | 154.4 |
| B | 5 | 65 | 62518 | 399.7 | 816 | 798 | 154.4 |
| B | 10 | 245 | 60692 | 387.88 | 816 | 798 | 154.4 |
| C | 9 | 236 | 139156 | 766.81 | 767 | 772 | 180.5 |
| C | 14 | 238 | 119318 | 656.88 | 767 | 772 | 180.5 |
| C | 3 | 233 | 24350 | 130.65 | 767 | 772 | 180.5 |
| D | 12 | 110 | 113852 | 588.53 | 775 | 752 | 192.2 |
| D | 2 | 152 | 28528 | 144.53 | 775 | 752 | 192.2 |
| D | 2 | 234 | 21289 | 106.87 | 775 | 752 | 192.2 |
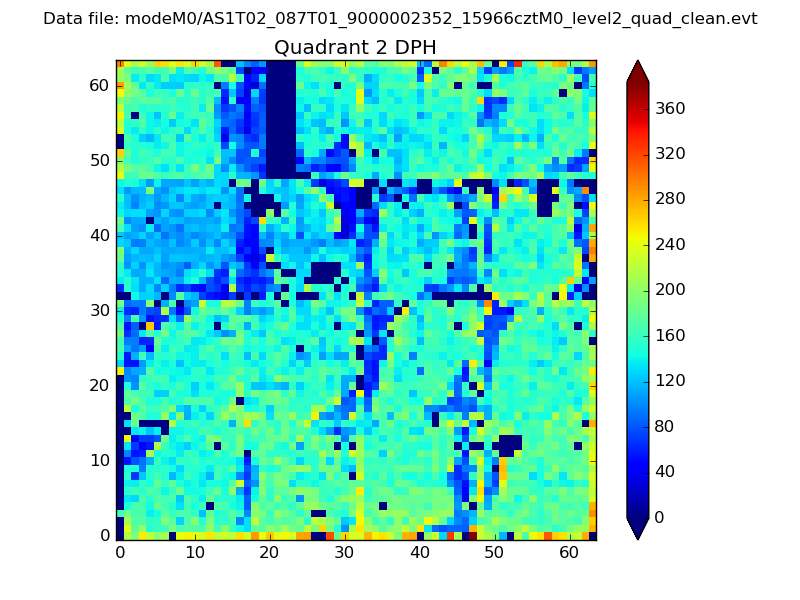
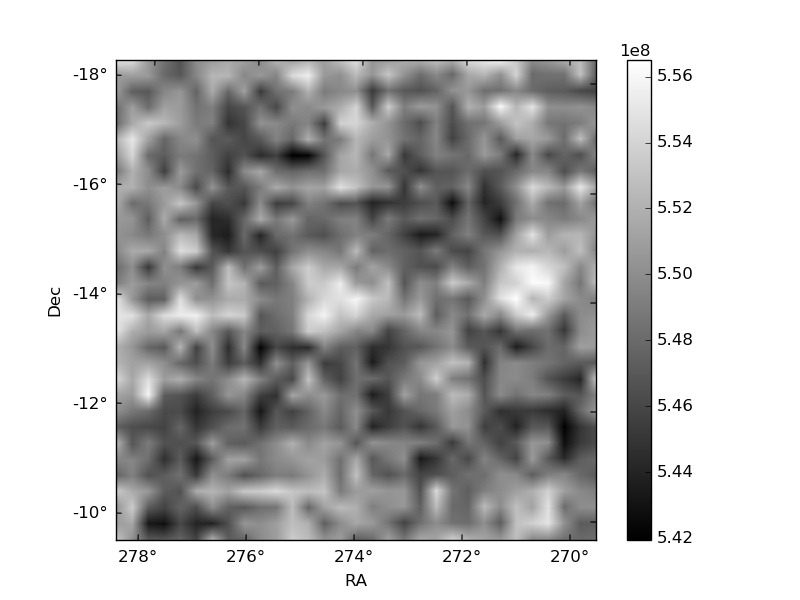
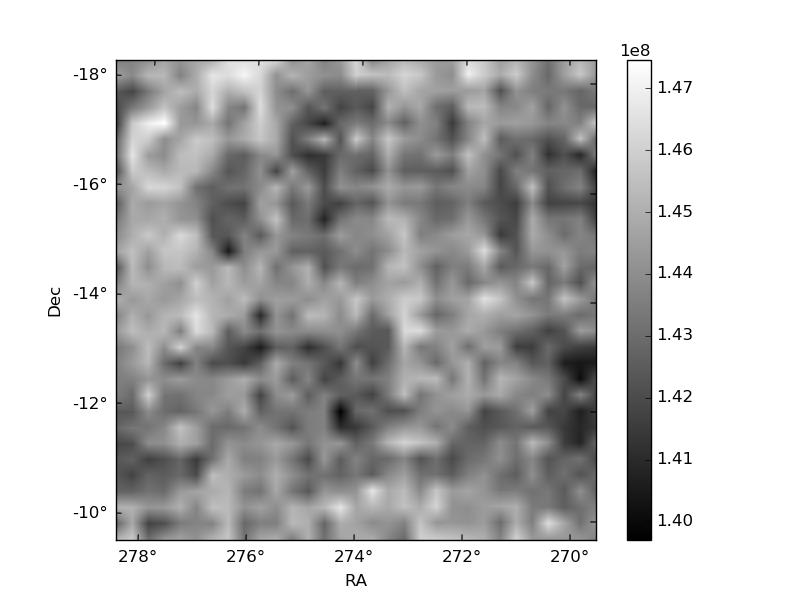
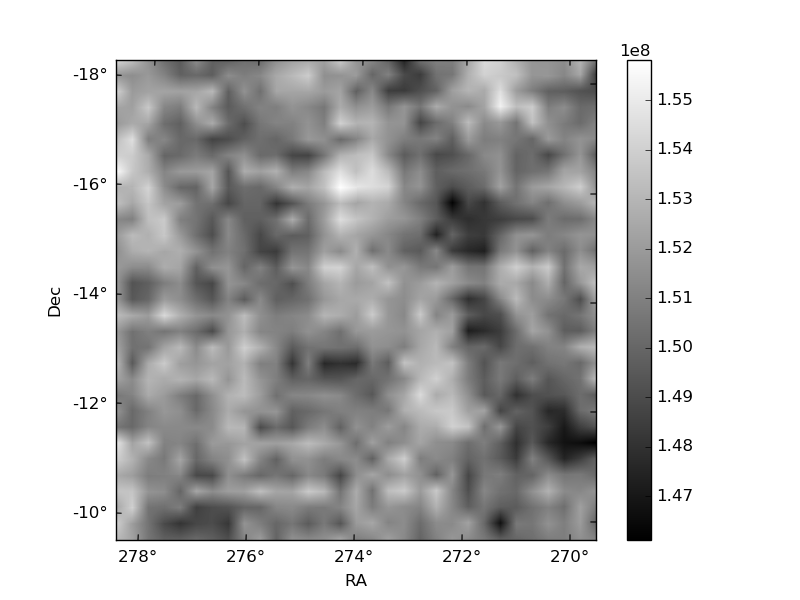
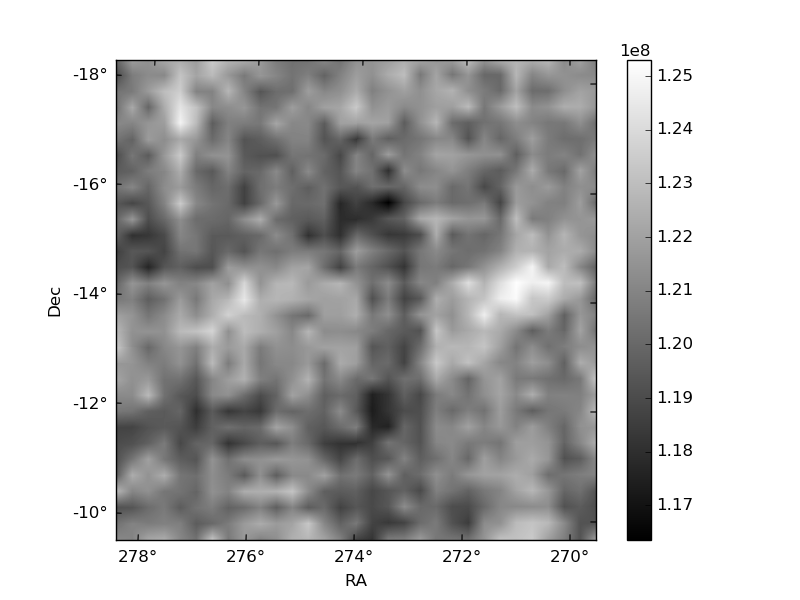
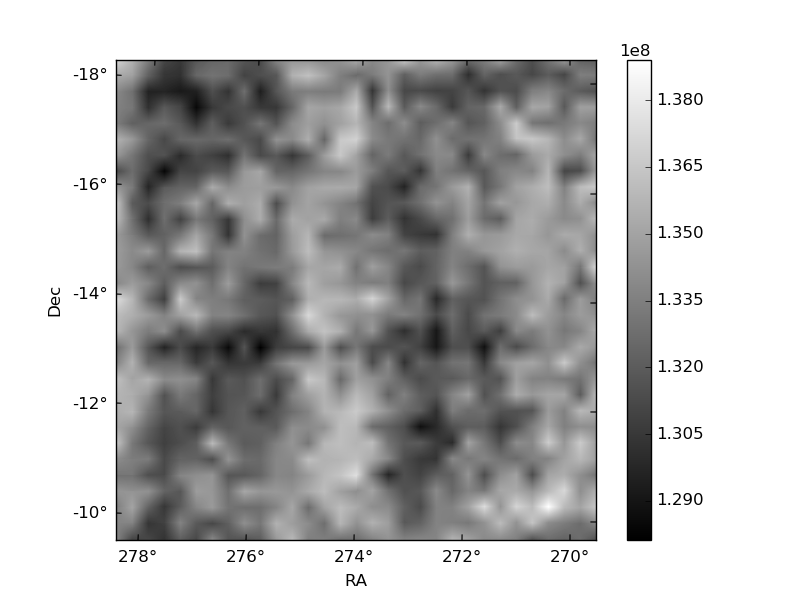
Histogram calculated using DETX and DETY for each event in the final _common_clean file
| Quadrant A |  |
 |
Quadrant B |
|---|---|---|---|
| Quadrant D |  |
 |
Quadrant C |
| Plot type | Count rate plots | Images |
|---|---|---|
| Comparison with Poisson distribution Blue bars denote a histogram of data divided into 1 sec bins. Red curve is a Poisson curve with rate = median count rate of data. |
 |
 |
| Quadrant-wise count rates Data is divided into 100 sec bins |
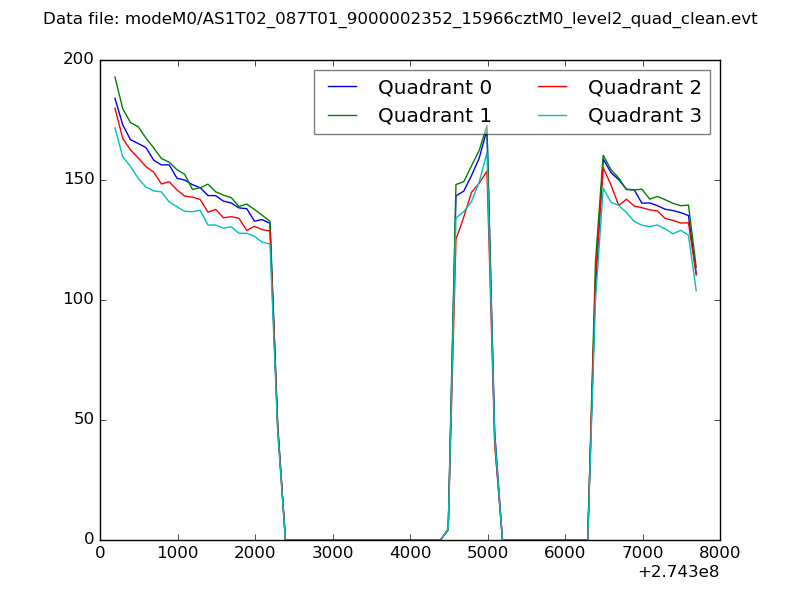 |
|
| Module-wise count rates for Quadrant A Data is divided into 100 sec bins |
 |
 |
| Module-wise count rates for Quadrant B Data is divided into 100 sec bins |
 |
 |
| Module-wise count rates for Quadrant C Data is divided into 100 sec bins |
 |
 |
| Module-wise count rates for Quadrant D Data is divided into 100 sec bins |
 |
 |
| Parameter | Plot |
|---|---|
| CZT HV Monitor |  |
| D_VDD | 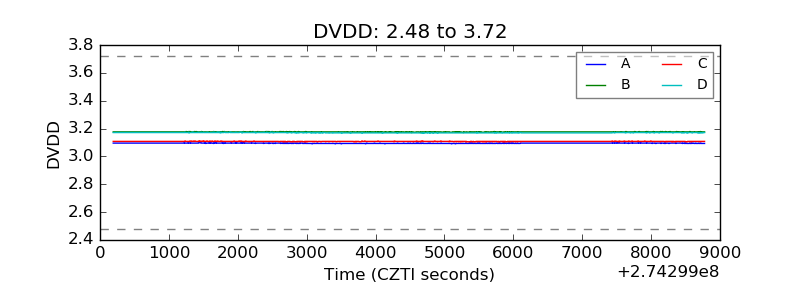 |
| Temperature 1 | 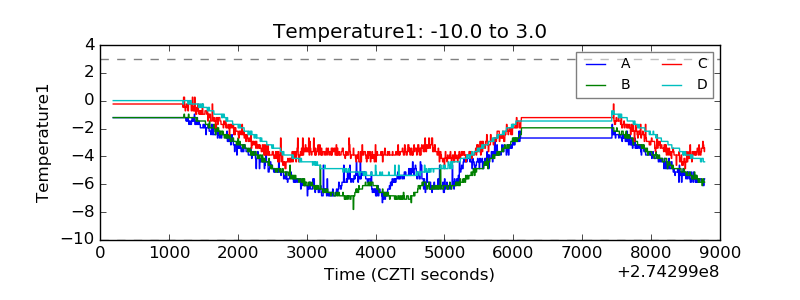 |
| Veto HV Monitor | 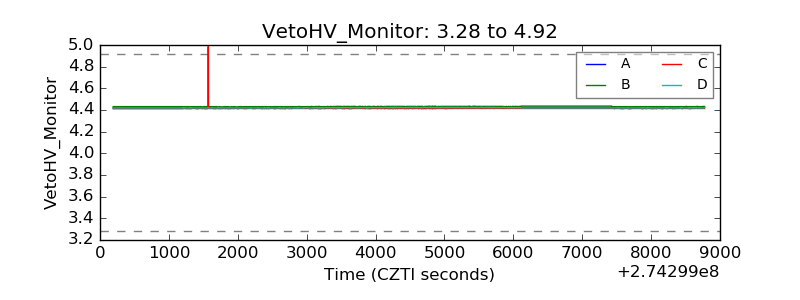 |
| Veto LLD | 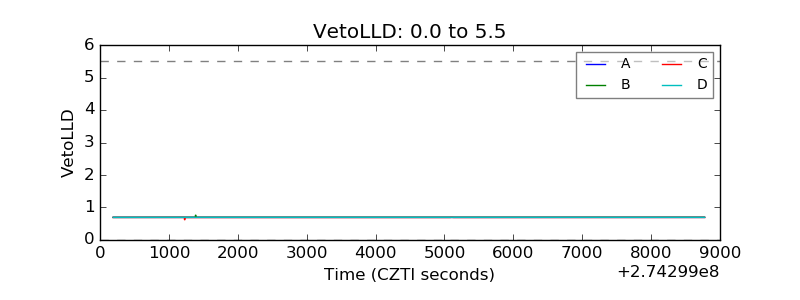 |
| Alpha Counter | 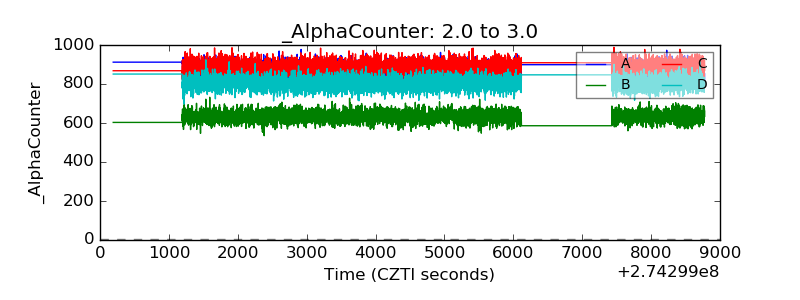 |
| _CPM_Rate | 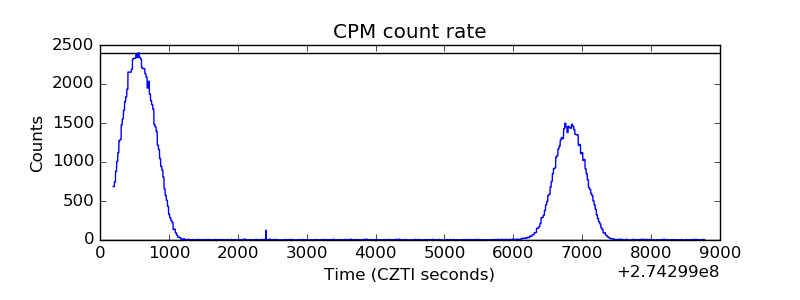 |
| CZT Counter | 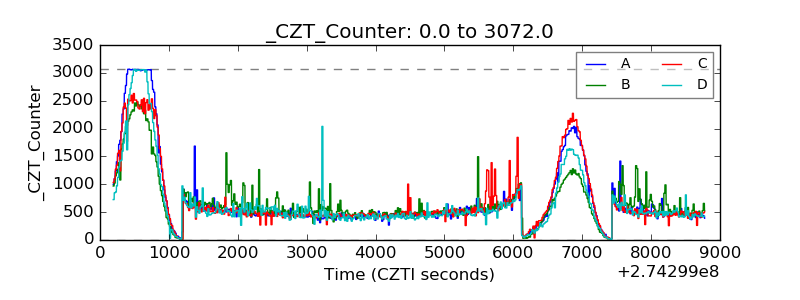 |
| +2.5 Volts monitor | 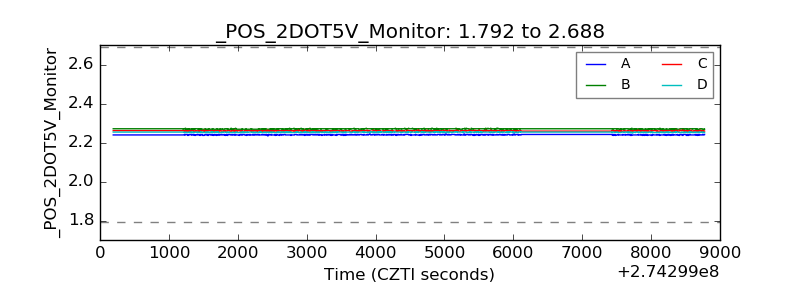 |
| +5 Volts monitor |  |
| _ROLL_ROT | 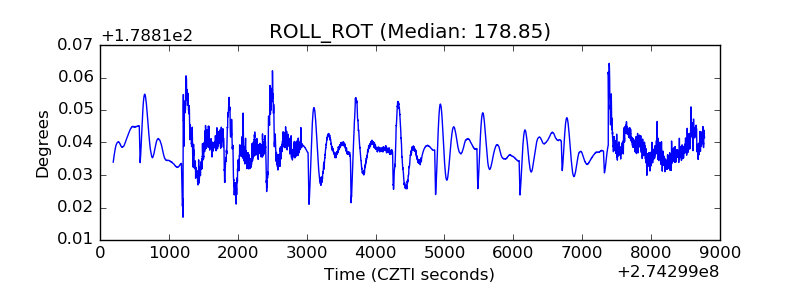 |
| _Roll_DEC | 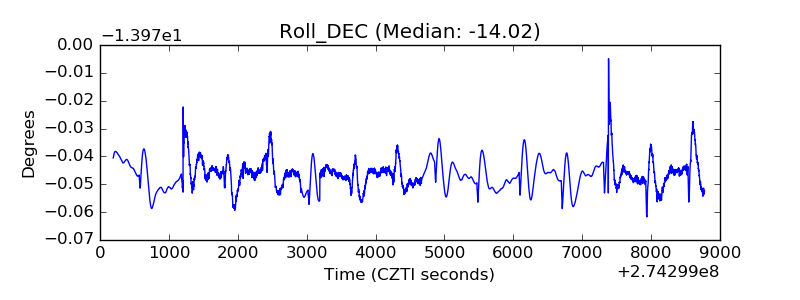 |
| _Roll_RA | 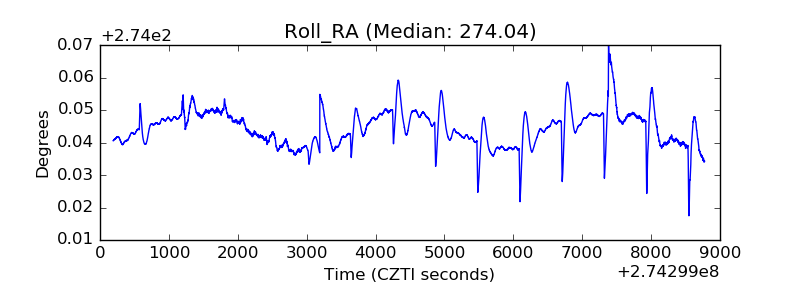 |
| Veto Counter |  |