| Param | Original file | Final file |
|---|---|---|
| Filename | modeM0/AS1T02_087T01_9000002352_15967cztM0_level2.evt | modeM0/AS1T02_087T01_9000002352_15967cztM0_level2_quad_clean.evt |
| Size (bytes) | 456,180,480 | 90,691,200 |
| Size | 435.0 MB | 86.5 MB |
| Events in quadrant A | 3,166,776 | 585,873 |
| Events in quadrant B | 4,007,848 | 593,102 |
| Events in quadrant C | 3,184,923 | 568,044 |
| Events in quadrant D | 3,017,083 | 548,896 |
| Mode M0 | |||
|---|---|---|---|
| Quadrant | BADHDUFLAG | Total packets | Discarded packets |
| A | 0 | 13678 | 3 |
| B | 0 | 16079 | 2 |
| C | 0 | 13547 | 2 |
| D | 0 | 13482 | 2 |
| Mode M9 | |||
|---|---|---|---|
| Quadrant | BADHDUFLAG | Total packets | Discarded packets |
| A | 0 | 22 | 0 |
| B | 0 | 22 | 0 |
| C | 0 | 22 | 0 |
| D | 0 | 23 | 0 |
| Mode SS | |||
|---|---|---|---|
| Quadrant | BADHDUFLAG | Total packets | Discarded packets |
| A | 0 | 132 | 0 |
| B | 0 | 132 | 0 |
| C | 0 | 132 | 0 |
| D | 0 | 132 | 0 |
| Quadrant | Total seconds | Saturated seconds | Saturation percentage |
|---|---|---|---|
| A | 6456 | 41 | 0.635068% |
| B | 6456 | 205 | 3.175341% |
| C | 6456 | 60 | 0.929368% |
| D | 6456 | 16 | 0.247831% |
Noise dominated data is calculated using 1-second bins in cleaned event files. If a bin has >2000 counts, and if more than 50% of those come from <1% of pixels, then it is considered to be noise-dominated and hence unusable.
| Quadrant | # 1 sec bins | Bins with >0 counts | Bins with >2000 counts | High rate bins dominated by noise | Noise dominated (total time) | Noise dominated (detector-on time) | Marked lightcurve |
|---|---|---|---|---|---|---|---|
| A | 7577 | 6458 | 6 | 6 | 0.08% | 0.09% | 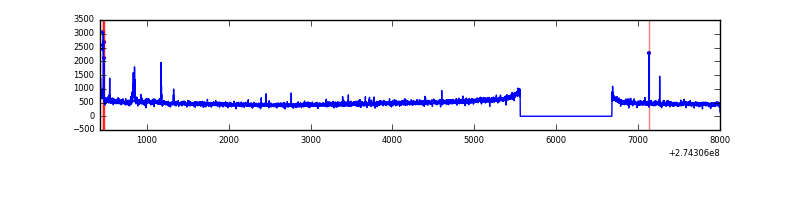 |
| B | 7577 | 6458 | 110 | 110 | 1.45% | 1.70% | 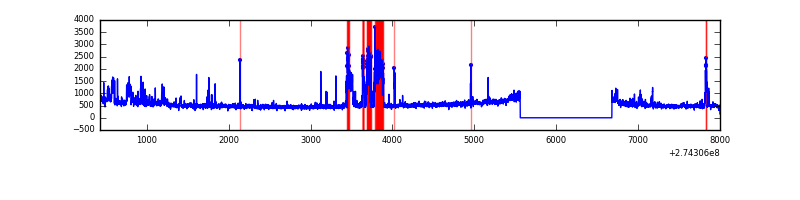 |
| C | 7577 | 6458 | 1 | 1 | 0.01% | 0.02% | 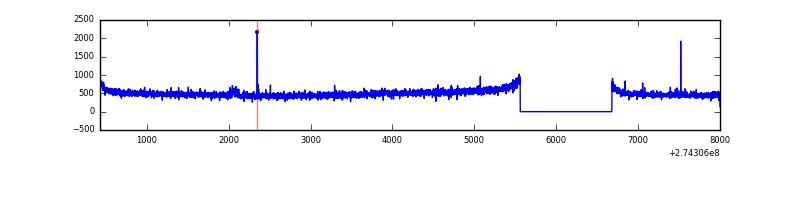 |
| D | 7577 | 6458 | 3 | 3 | 0.04% | 0.05% | 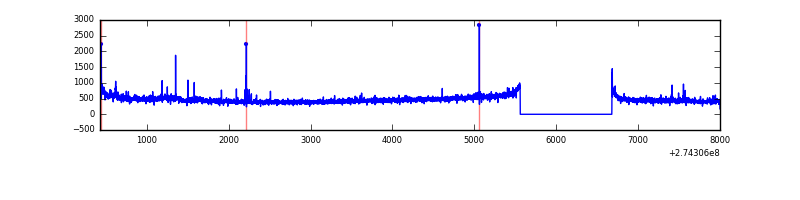 |
Top three noisy pixels from each quadrant. If the there are fewer than three noisy pixels in the level2.evt file, extra rows are filled as -1
| Pixel properties | Quadrant properties | ||||||
|---|---|---|---|---|---|---|---|
| Quadrant | DetID | PixID | Counts | Sigma | Mean | Median | Sigma |
| A | 15 | 239 | 54304 | 324.62 | 806 | 790 | 164.8 |
| A | 9 | 143 | 10074 | 56.32 | 806 | 790 | 164.8 |
| A | 0 | 226 | 7134 | 38.48 | 806 | 790 | 164.8 |
| B | 5 | 65 | 551768 | 3543.91 | 807 | 788 | 155.5 |
| B | 4 | 216 | 98249 | 626.87 | 807 | 788 | 155.5 |
| B | 0 | 189 | 49147 | 311.05 | 807 | 788 | 155.5 |
| C | 14 | 238 | 119223 | 649.98 | 772 | 776 | 182.2 |
| C | 3 | 233 | 35303 | 189.47 | 772 | 776 | 182.2 |
| C | 10 | 22 | 11004 | 56.13 | 772 | 776 | 182.2 |
| D | 12 | 110 | 34523 | 177.28 | 772 | 749 | 190.5 |
| D | 2 | 234 | 22006 | 111.58 | 772 | 749 | 190.5 |
| D | 15 | 145 | 13316 | 65.97 | 772 | 749 | 190.5 |
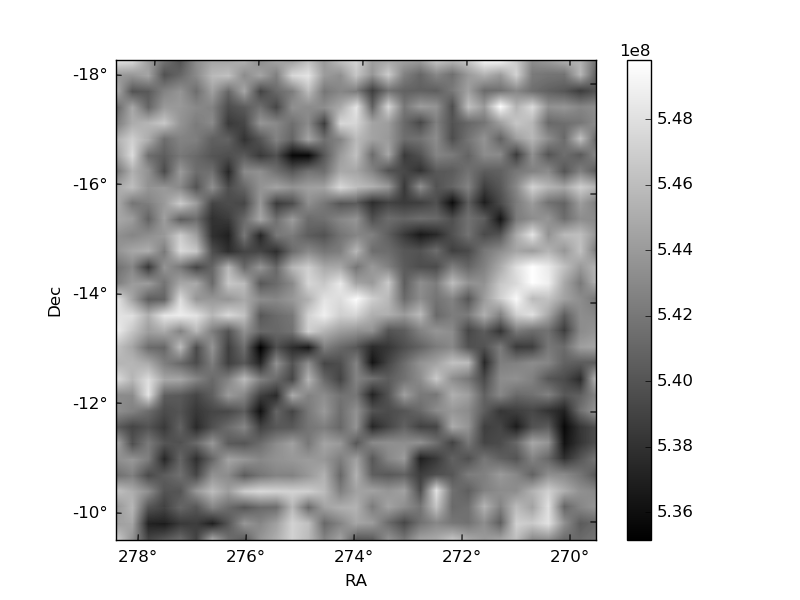
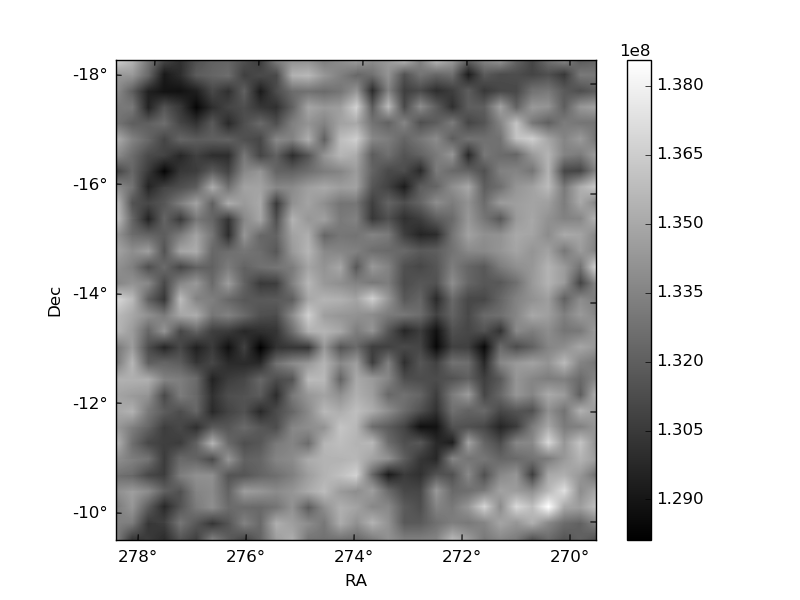
Histogram calculated using DETX and DETY for each event in the final _common_clean file
| Quadrant A | 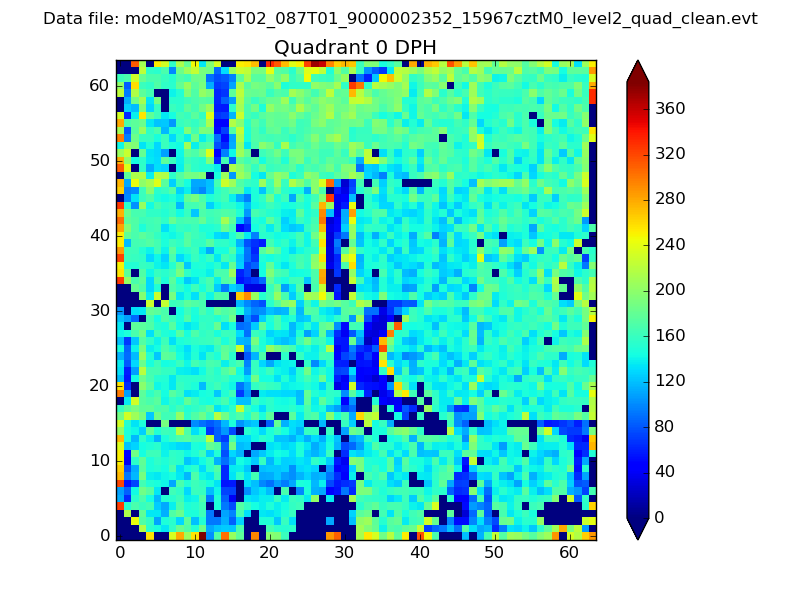 |
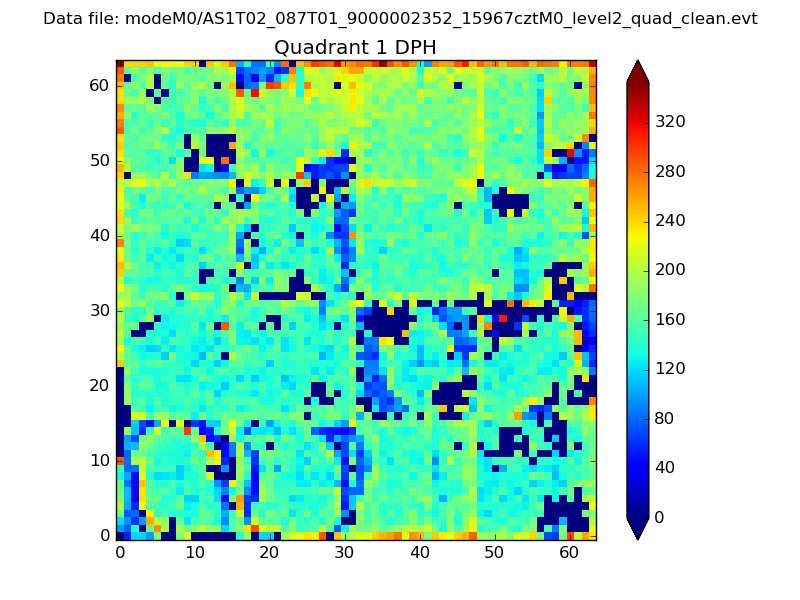 |
Quadrant B |
|---|---|---|---|
| Quadrant D | 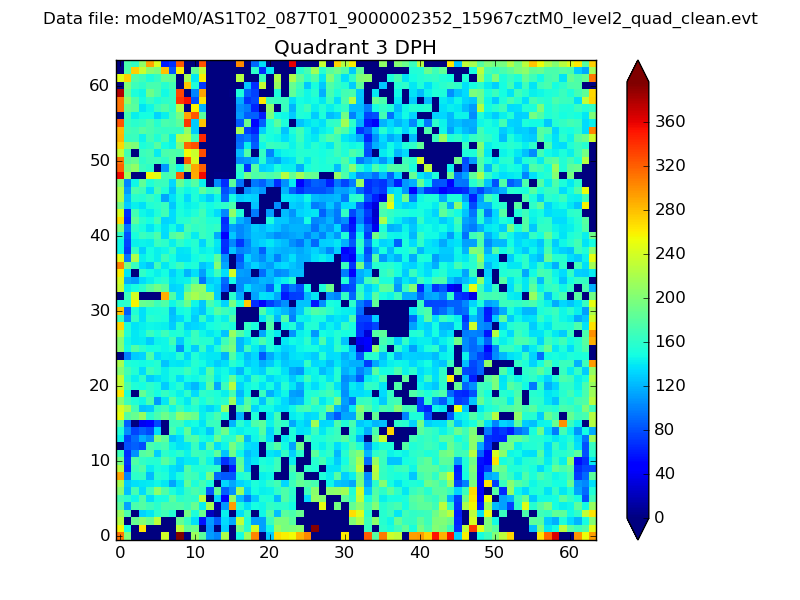 |
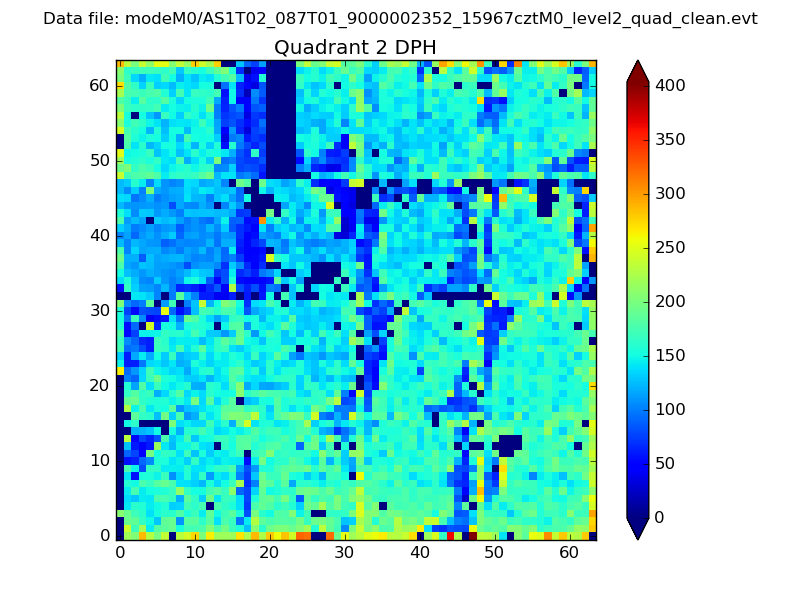 |
Quadrant C |
| Plot type | Count rate plots | Images |
|---|---|---|
| Comparison with Poisson distribution Blue bars denote a histogram of data divided into 1 sec bins. Red curve is a Poisson curve with rate = median count rate of data. |
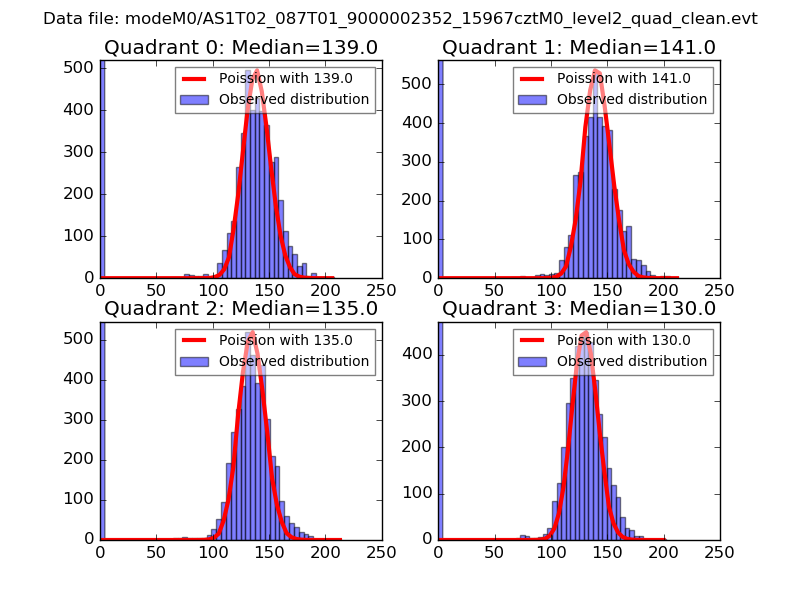 |
 |
| Quadrant-wise count rates Data is divided into 100 sec bins |
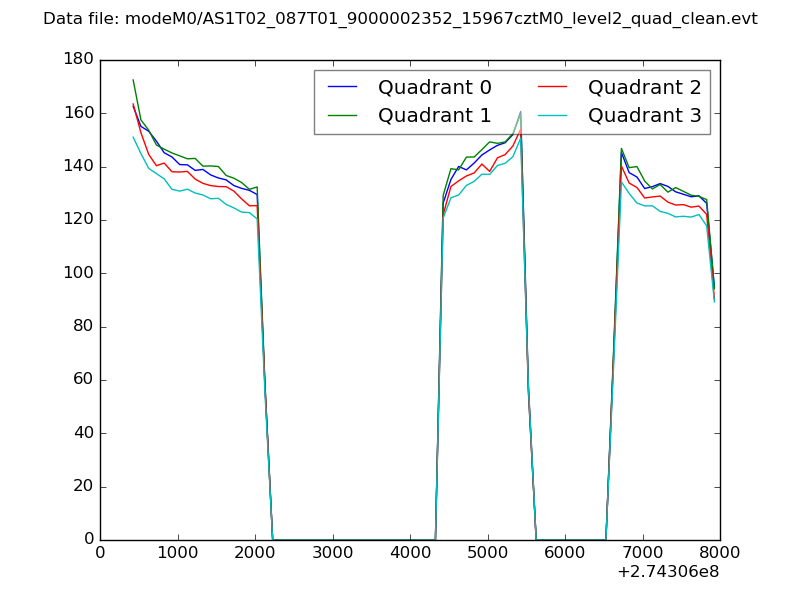 |
|
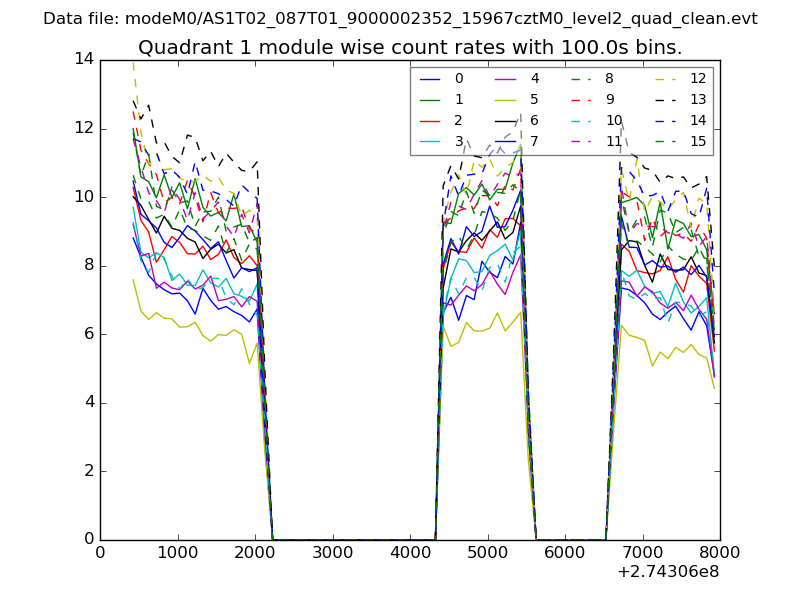
| Module-wise count rates for Quadrant A Data is divided into 100 sec bins |
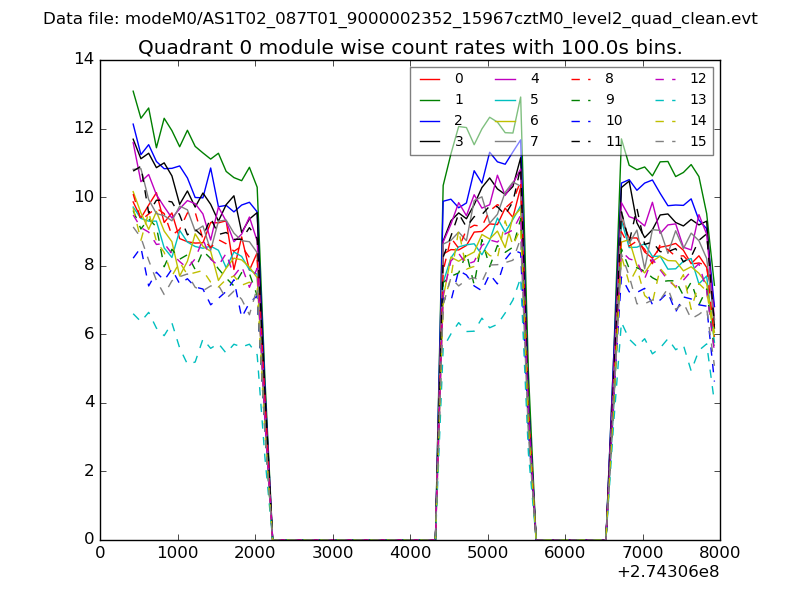 |
 |
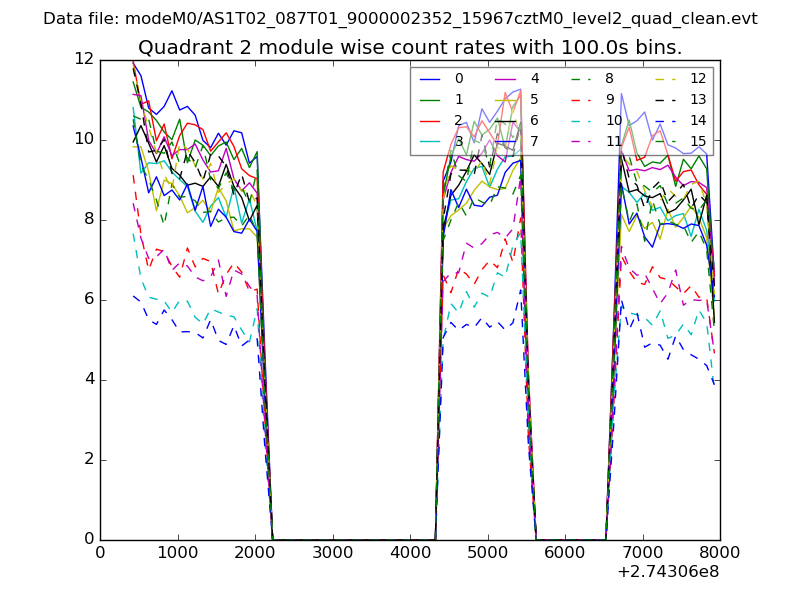
| Module-wise count rates for Quadrant B Data is divided into 100 sec bins |
 |
 |
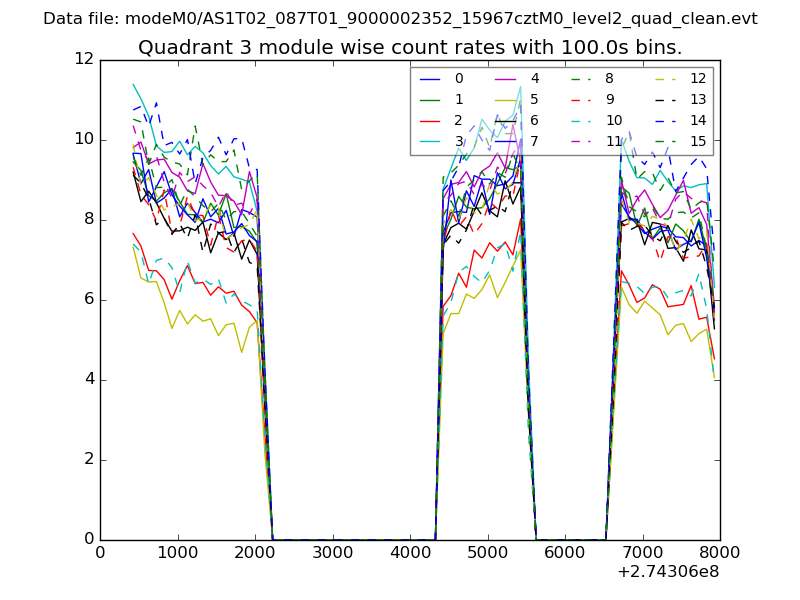
| Module-wise count rates for Quadrant C Data is divided into 100 sec bins |
 |
 |
| Module-wise count rates for Quadrant D Data is divided into 100 sec bins |
 |
 |
| Parameter | Plot |
|---|---|
| CZT HV Monitor | 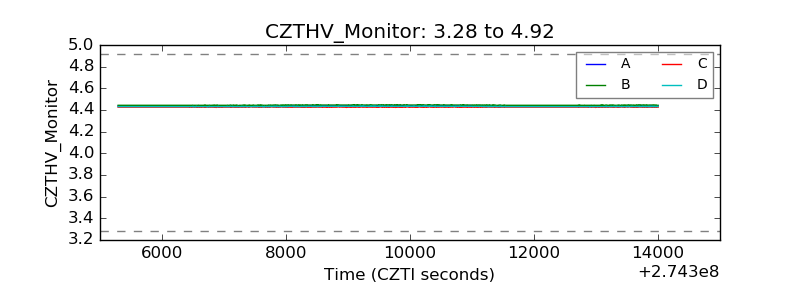 |
| D_VDD | 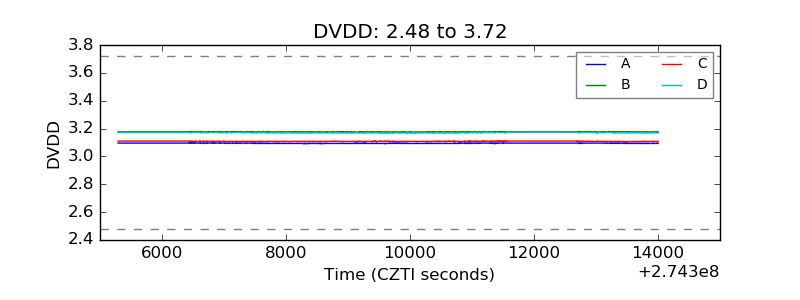 |
| Temperature 1 | 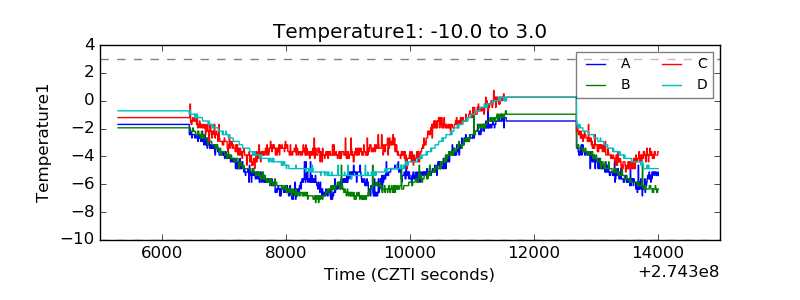 |
| Veto HV Monitor | 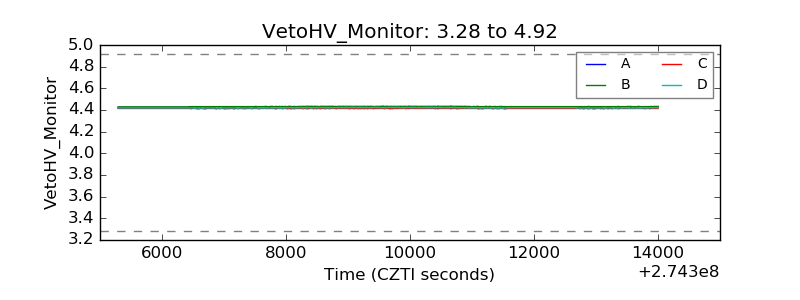 |
| Veto LLD | 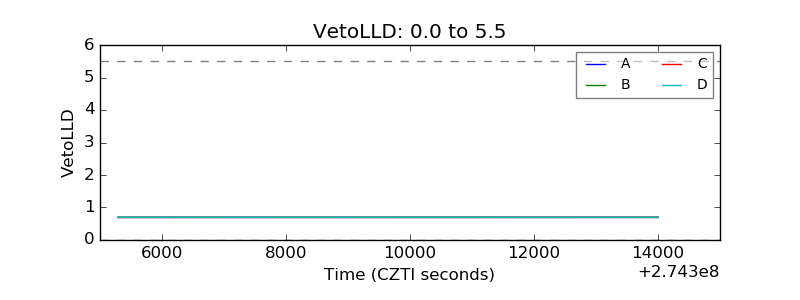 |
| Alpha Counter | 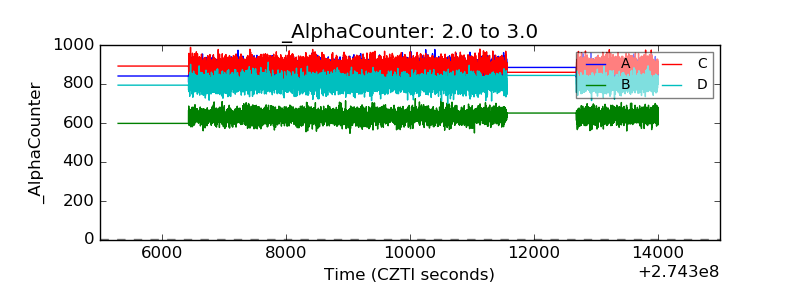 |
| _CPM_Rate |  |
| CZT Counter | 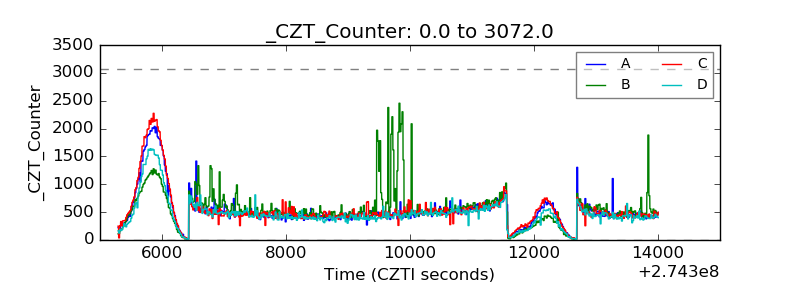 |
| +2.5 Volts monitor |  |
| +5 Volts monitor | 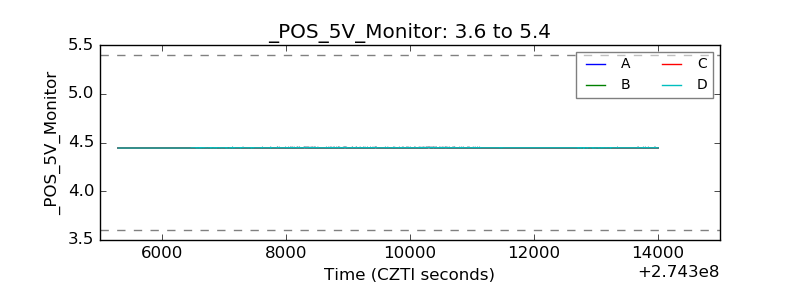 |
| _ROLL_ROT | 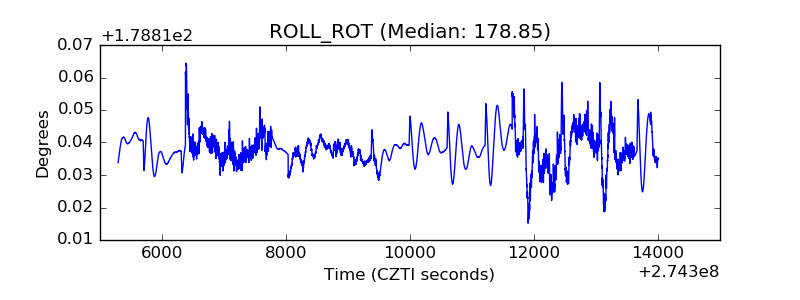 |
| _Roll_DEC | 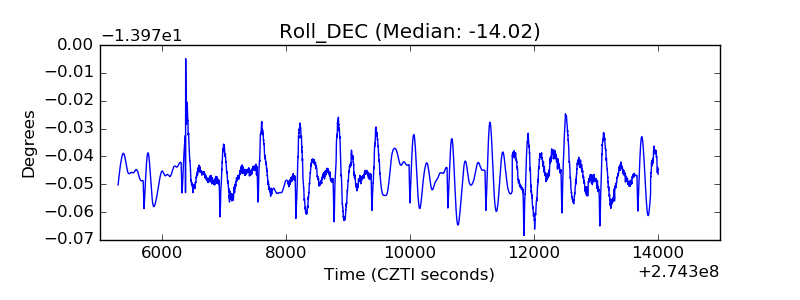 |
| _Roll_RA | 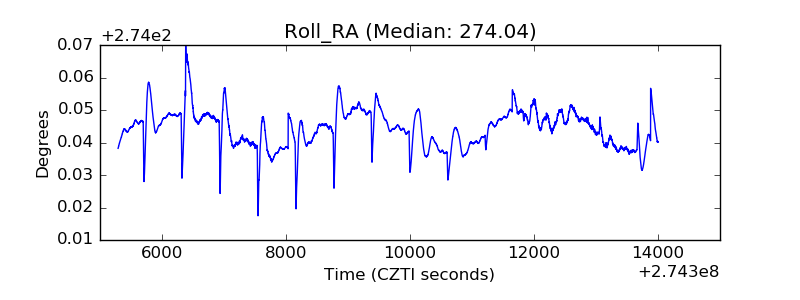 |
| Veto Counter | 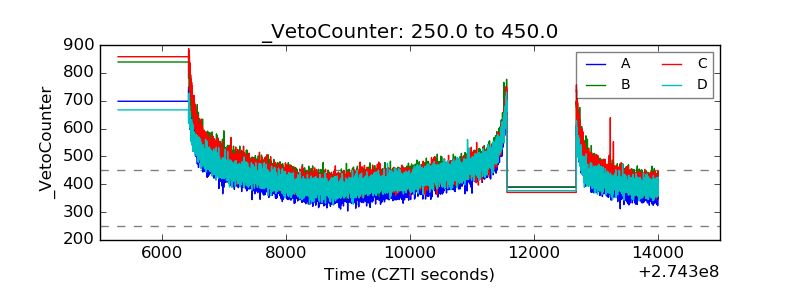 |