| Param | Original file | Final file |
|---|---|---|
| Filename | modeM0/AS1T02_087T01_9000002352_15971cztM0_level2.evt | modeM0/AS1T02_087T01_9000002352_15971cztM0_level2_quad_clean.evt |
| Size (bytes) | 502,692,480 | 75,047,040 |
| Size | 479.4 MB | 71.6 MB |
| Events in quadrant A | 3,524,679 | 450,559 |
| Events in quadrant B | 4,453,228 | 446,139 |
| Events in quadrant C | 3,414,696 | 437,654 |
| Events in quadrant D | 3,337,876 | 432,107 |
| Mode M0 | |||
|---|---|---|---|
| Quadrant | BADHDUFLAG | Total packets | Discarded packets |
| A | 0 | 15334 | 2 |
| B | 0 | 17957 | 1 |
| C | 0 | 14907 | 1 |
| D | 0 | 15081 | 1 |
| Mode M9 | |||
|---|---|---|---|
| Quadrant | BADHDUFLAG | Total packets | Discarded packets |
| A | 0 | 4 | 0 |
| B | 0 | 4 | 0 |
| C | 0 | 4 | 0 |
| D | 0 | 4 | 0 |
| Mode SS | |||
|---|---|---|---|
| Quadrant | BADHDUFLAG | Total packets | Discarded packets |
| A | 0 | 144 | 0 |
| B | 0 | 144 | 0 |
| C | 0 | 144 | 0 |
| D | 0 | 144 | 0 |
| Quadrant | Total seconds | Saturated seconds | Saturation percentage |
|---|---|---|---|
| A | 7277 | 140 | 1.923870% |
| B | 7277 | 314 | 4.314965% |
| C | 7277 | 135 | 1.855160% |
| D | 7277 | 83 | 1.140580% |
Noise dominated data is calculated using 1-second bins in cleaned event files. If a bin has >2000 counts, and if more than 50% of those come from <1% of pixels, then it is considered to be noise-dominated and hence unusable.
| Quadrant | # 1 sec bins | Bins with >0 counts | Bins with >2000 counts | High rate bins dominated by noise | Noise dominated (total time) | Noise dominated (detector-on time) | Marked lightcurve |
|---|---|---|---|---|---|---|---|
| A | 7593 | 7278 | 32 | 32 | 0.42% | 0.44% | 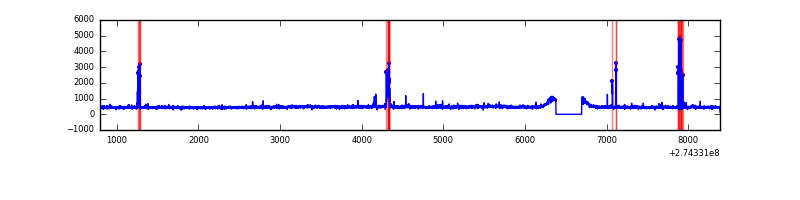 |
| B | 7593 | 7278 | 160 | 160 | 2.11% | 2.20% | 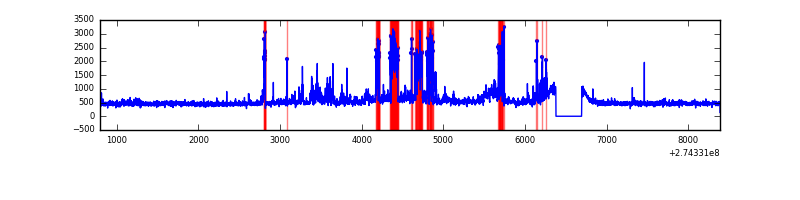 |
| C | 7593 | 7278 | 1 | 1 | 0.01% | 0.01% | 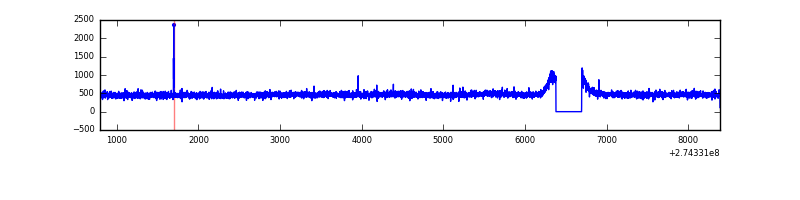 |
| D | 7593 | 7278 | 2 | 2 | 0.03% | 0.03% | 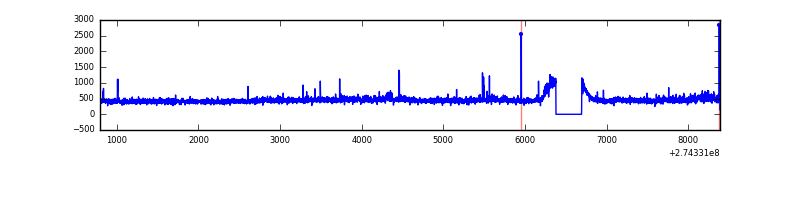 |
Top three noisy pixels from each quadrant. If the there are fewer than three noisy pixels in the level2.evt file, extra rows are filled as -1
| Pixel properties | Quadrant properties | ||||||
|---|---|---|---|---|---|---|---|
| Quadrant | DetID | PixID | Counts | Sigma | Mean | Median | Sigma |
| A | 9 | 143 | 113978 | 637.72 | 870 | 852 | 177.4 |
| A | 15 | 239 | 51907 | 287.81 | 870 | 852 | 177.4 |
| A | 0 | 226 | 7570 | 37.87 | 870 | 852 | 177.4 |
| B | 10 | 245 | 679103 | 4020.01 | 870 | 845 | 168.7 |
| B | 15 | 222 | 138486 | 815.79 | 870 | 845 | 168.7 |
| B | 0 | 182 | 72751 | 426.18 | 870 | 845 | 168.7 |
| C | 14 | 238 | 126992 | 636.28 | 835 | 841 | 198.3 |
| C | 3 | 233 | 16565 | 79.31 | 835 | 841 | 198.3 |
| C | 8 | 222 | 7781 | 35.0 | 835 | 841 | 198.3 |
| D | 12 | 110 | 114806 | 554.0 | 842 | 819 | 205.8 |
| D | 2 | 234 | 28254 | 133.34 | 842 | 819 | 205.8 |
| D | 1 | 52 | 11094 | 49.94 | 842 | 819 | 205.8 |
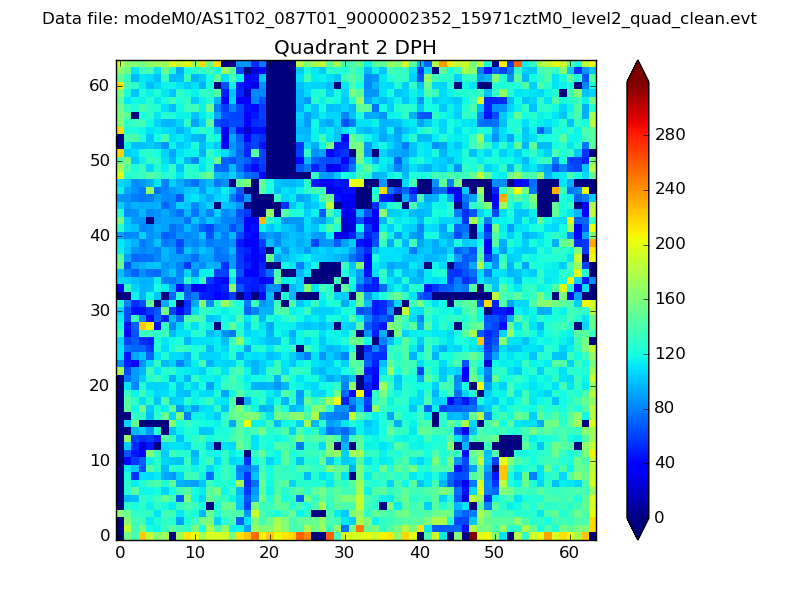
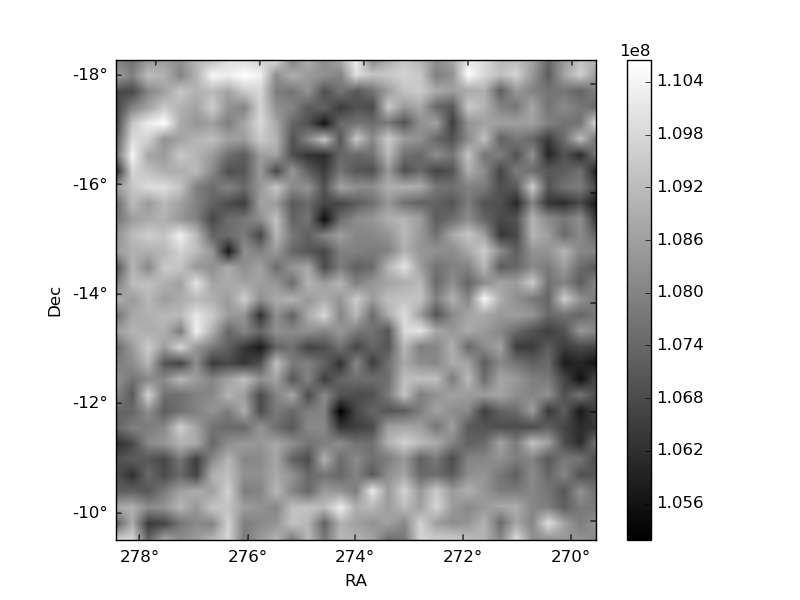
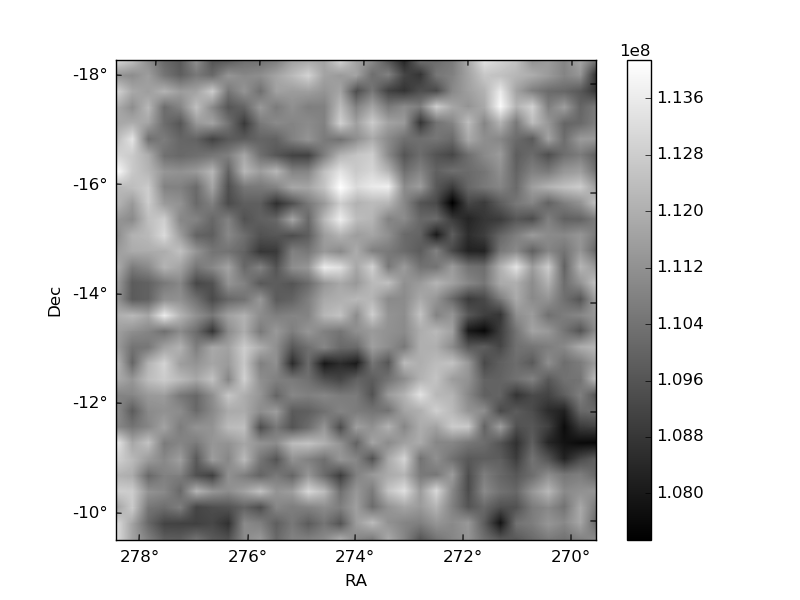
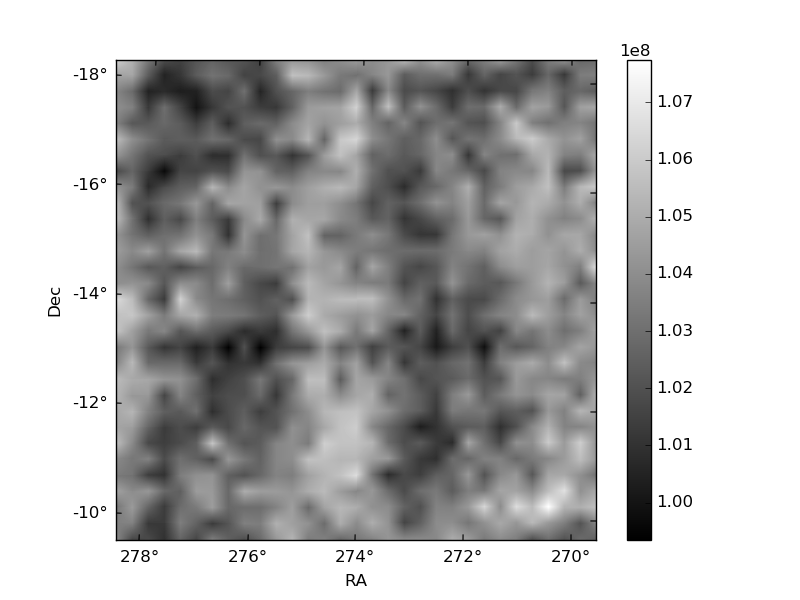
Histogram calculated using DETX and DETY for each event in the final _common_clean file
| Quadrant A | 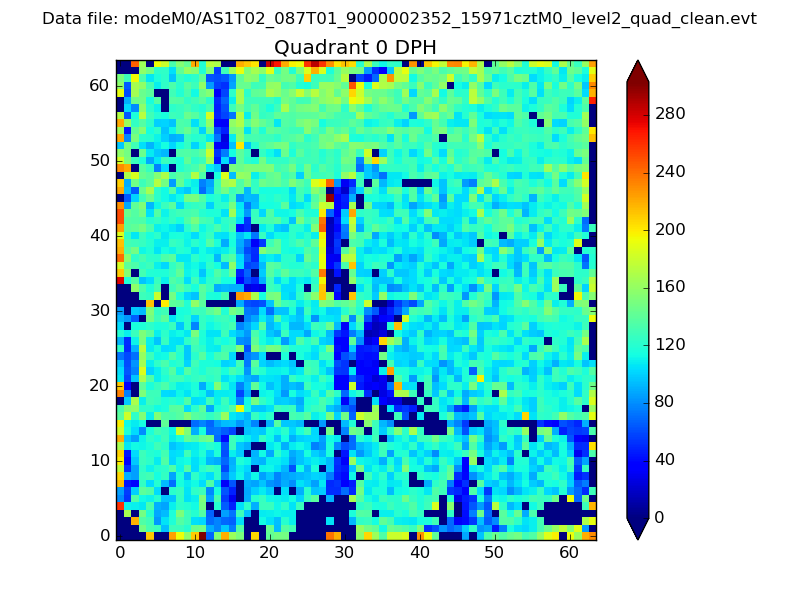 |
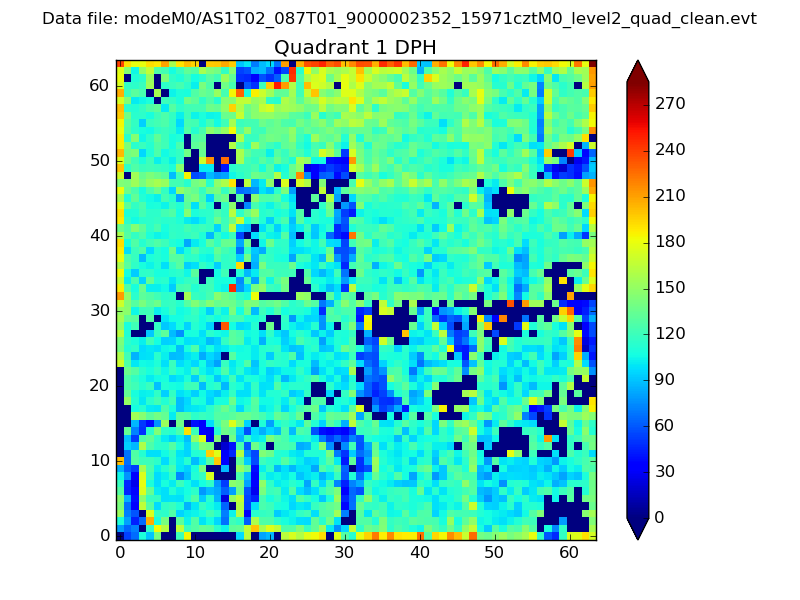 |
Quadrant B |
|---|---|---|---|
| Quadrant D | 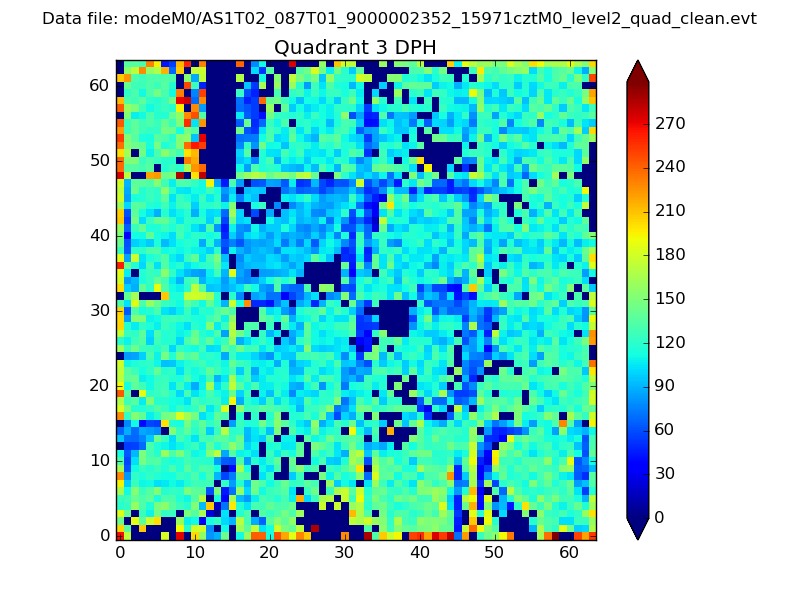 |
 |
Quadrant C |
| Plot type | Count rate plots | Images |
|---|---|---|
| Comparison with Poisson distribution Blue bars denote a histogram of data divided into 1 sec bins. Red curve is a Poisson curve with rate = median count rate of data. |
 |
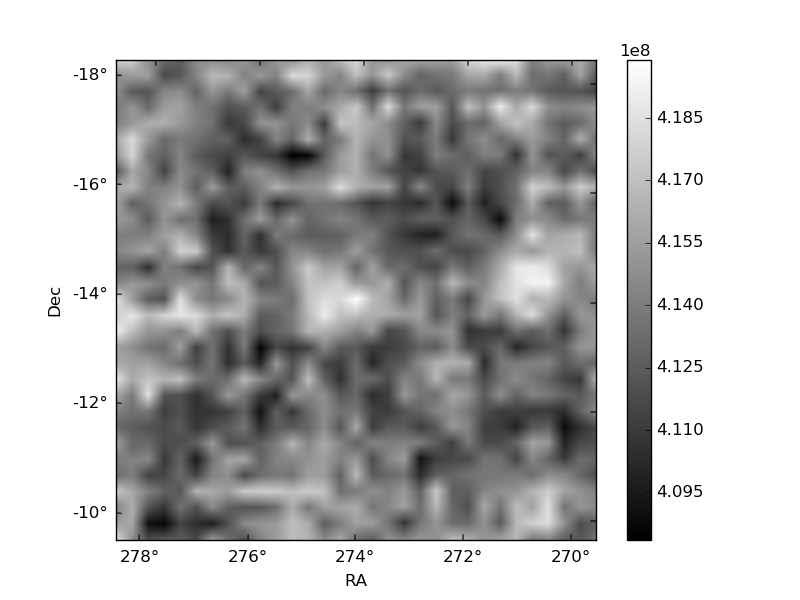 |
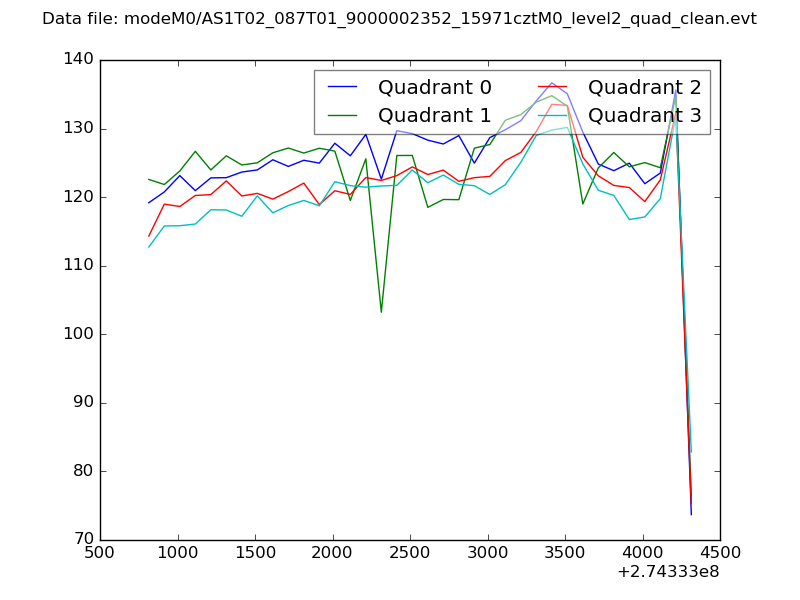
| Quadrant-wise count rates Data is divided into 100 sec bins |
 |
|
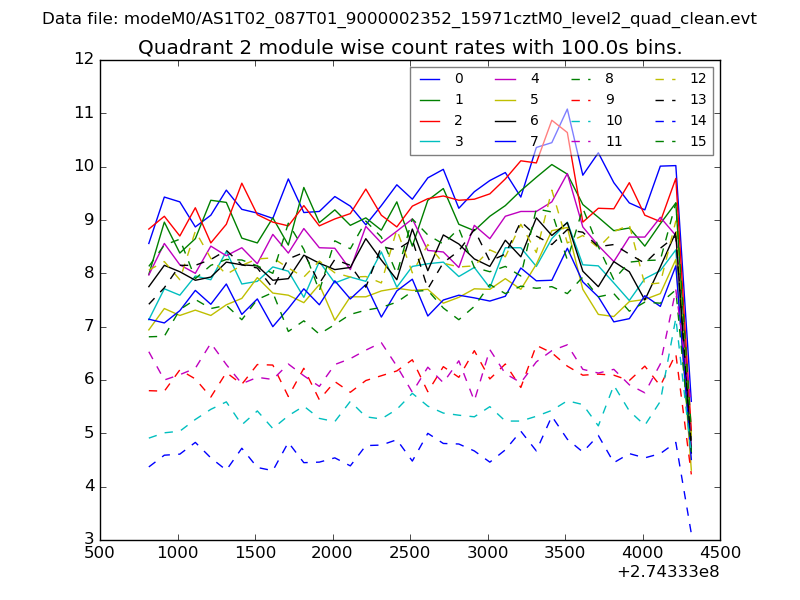
| Module-wise count rates for Quadrant A Data is divided into 100 sec bins |
 |
 |
| Module-wise count rates for Quadrant B Data is divided into 100 sec bins |
 |
 |
| Module-wise count rates for Quadrant C Data is divided into 100 sec bins |
 |
 |
| Module-wise count rates for Quadrant D Data is divided into 100 sec bins |
 |
 |
| Parameter | Plot |
|---|---|
| CZT HV Monitor |  |
| D_VDD | 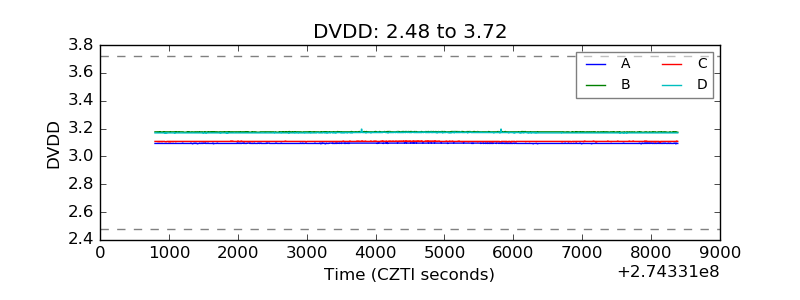 |
| Temperature 1 |  |
| Veto HV Monitor | 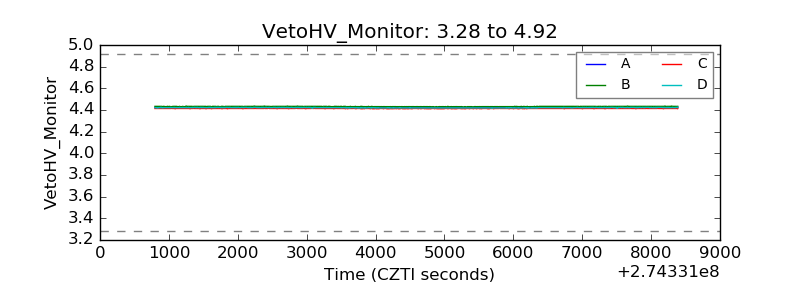 |
| Veto LLD | 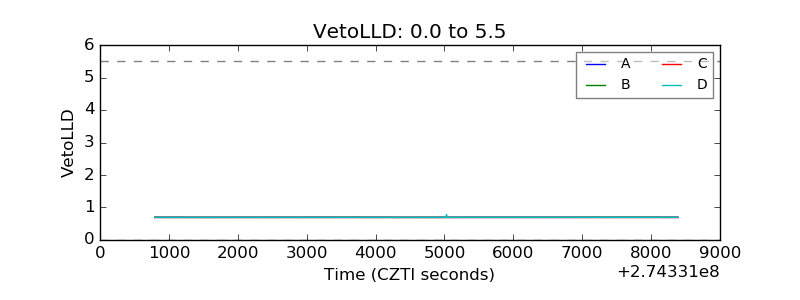 |
| Alpha Counter | 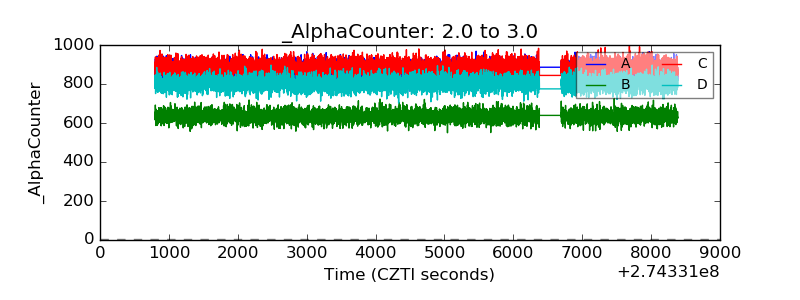 |
| _CPM_Rate | 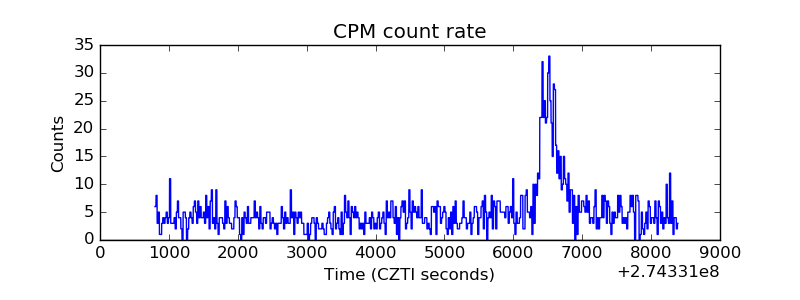 |
| CZT Counter | 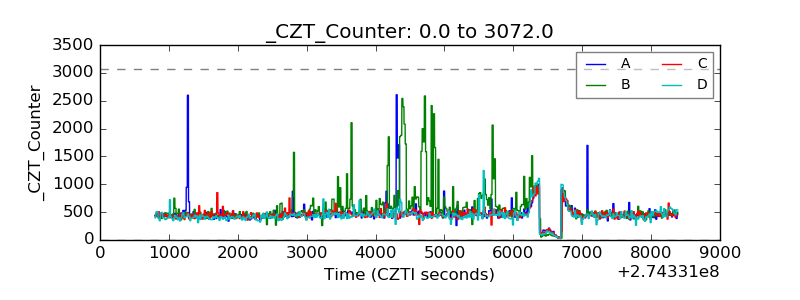 |
| +2.5 Volts monitor |  |
| +5 Volts monitor |  |
| _ROLL_ROT |  |
| _Roll_DEC |  |
| _Roll_RA | 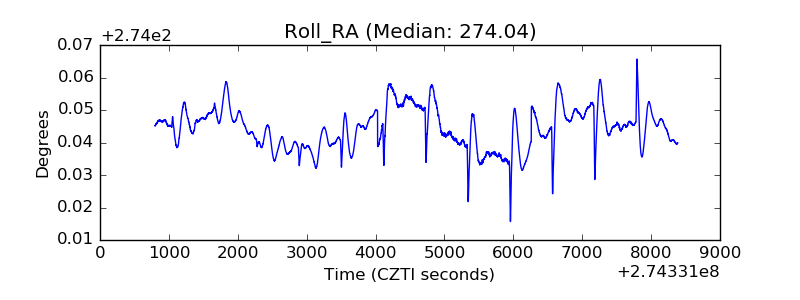 |
| Veto Counter |  |