| Param | Original file | Final file |
|---|---|---|
| Filename | modeM0/AS1T02_087T01_9000002352_15973cztM0_level2.evt | modeM0/AS1T02_087T01_9000002352_15973cztM0_level2_quad_clean.evt |
| Size (bytes) | 923,319,360 | 154,944,000 |
| Size | 880.5 MB | 147.8 MB |
| Events in quadrant A | 6,302,676 | 970,326 |
| Events in quadrant B | 7,727,095 | 961,957 |
| Events in quadrant C | 6,309,271 | 938,211 |
| Events in quadrant D | 6,736,685 | 916,756 |
| Mode M0 | |||
|---|---|---|---|
| Quadrant | BADHDUFLAG | Total packets | Discarded packets |
| A | 0 | 27231 | 4 |
| B | 0 | 31004 | 3 |
| C | 0 | 27161 | 3 |
| D | 0 | 28885 | 3 |
| Mode M9 | |||
|---|---|---|---|
| Quadrant | BADHDUFLAG | Total packets | Discarded packets |
| A | 0 | 16 | 0 |
| B | 0 | 16 | 0 |
| C | 0 | 16 | 0 |
| D | 0 | 16 | 0 |
| Mode SS | |||
|---|---|---|---|
| Quadrant | BADHDUFLAG | Total packets | Discarded packets |
| A | 0 | 266 | 0 |
| B | 0 | 266 | 0 |
| C | 0 | 266 | 0 |
| D | 0 | 266 | 0 |
| Quadrant | Total seconds | Saturated seconds | Saturation percentage |
|---|---|---|---|
| A | 13108 | 284 | 2.166616% |
| B | 13108 | 635 | 4.844370% |
| C | 13108 | 318 | 2.425999% |
| D | 13108 | 214 | 1.632591% |
Noise dominated data is calculated using 1-second bins in cleaned event files. If a bin has >2000 counts, and if more than 50% of those come from <1% of pixels, then it is considered to be noise-dominated and hence unusable.
| Quadrant | # 1 sec bins | Bins with >0 counts | Bins with >2000 counts | High rate bins dominated by noise | Noise dominated (total time) | Noise dominated (detector-on time) | Marked lightcurve |
|---|---|---|---|---|---|---|---|
| A | 14609 | 13109 | 20 | 20 | 0.14% | 0.15% | 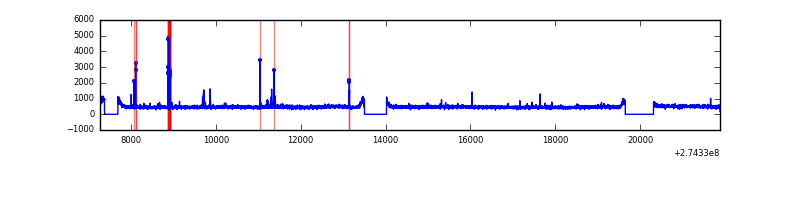 |
| B | 14609 | 13109 | 260 | 260 | 1.78% | 1.98% | 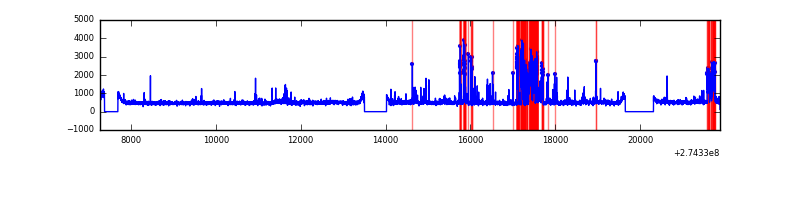 |
| C | 14609 | 13109 | 6 | 6 | 0.04% | 0.05% | 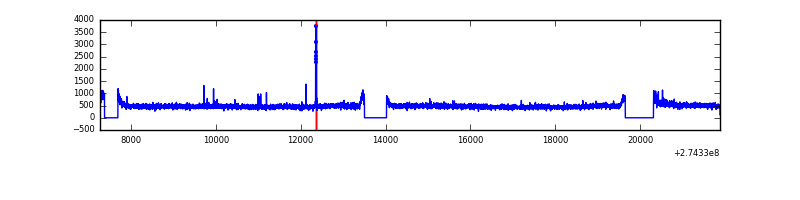 |
| D | 14609 | 13109 | 11 | 11 | 0.08% | 0.08% | 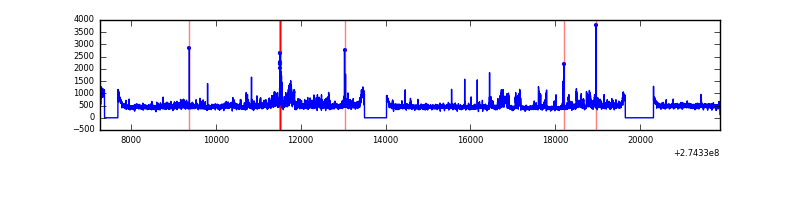 |
Top three noisy pixels from each quadrant. If the there are fewer than three noisy pixels in the level2.evt file, extra rows are filled as -1
| Pixel properties | Quadrant properties | ||||||
|---|---|---|---|---|---|---|---|
| Quadrant | DetID | PixID | Counts | Sigma | Mean | Median | Sigma |
| A | 15 | 239 | 81150 | 245.71 | 1597 | 1563 | 323.9 |
| A | 9 | 143 | 48450 | 144.76 | 1597 | 1563 | 323.9 |
| A | 5 | 98 | 16411 | 45.84 | 1597 | 1563 | 323.9 |
| B | 10 | 245 | 778966 | 2522.33 | 1589 | 1545 | 308.2 |
| B | 15 | 222 | 253306 | 816.83 | 1589 | 1545 | 308.2 |
| B | 4 | 173 | 183203 | 589.39 | 1589 | 1545 | 308.2 |
| C | 14 | 238 | 230631 | 632.58 | 1528 | 1533 | 362.2 |
| C | 3 | 233 | 74328 | 201.0 | 1528 | 1533 | 362.2 |
| C | 9 | 236 | 39344 | 104.4 | 1528 | 1533 | 362.2 |
| D | 12 | 110 | 597464 | 1557.57 | 1552 | 1504 | 382.6 |
| D | 1 | 52 | 170207 | 440.91 | 1552 | 1504 | 382.6 |
| D | 10 | 70 | 53666 | 136.33 | 1552 | 1504 | 382.6 |
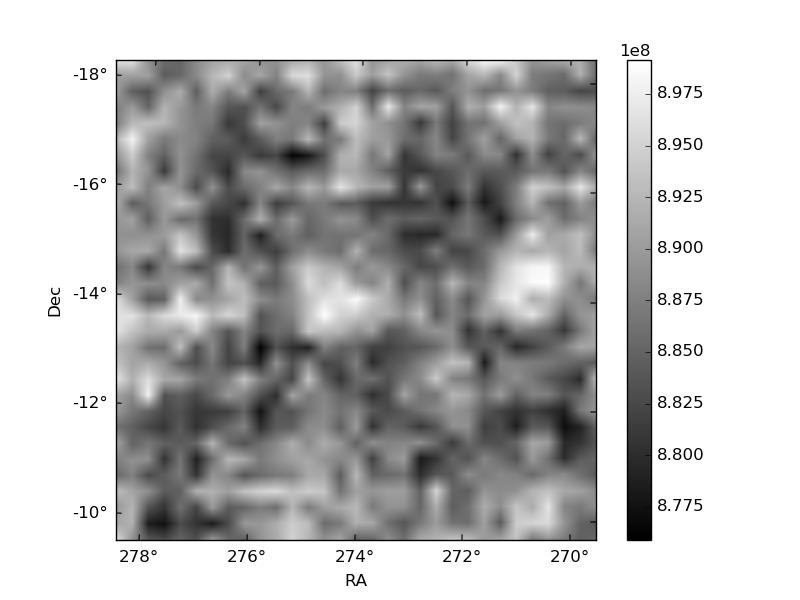
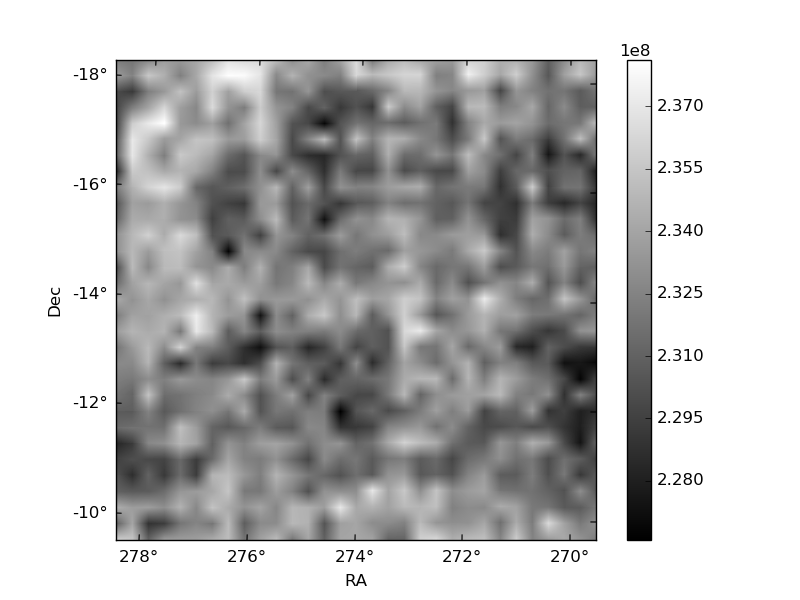
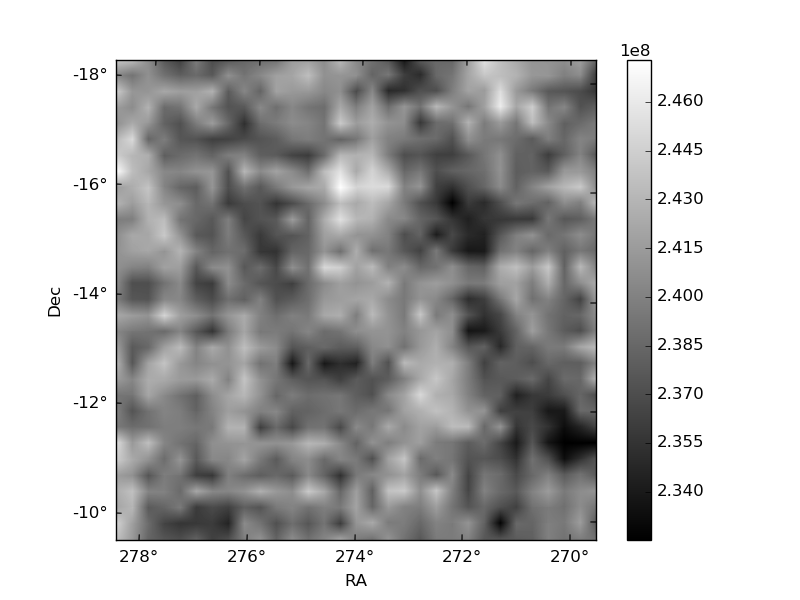
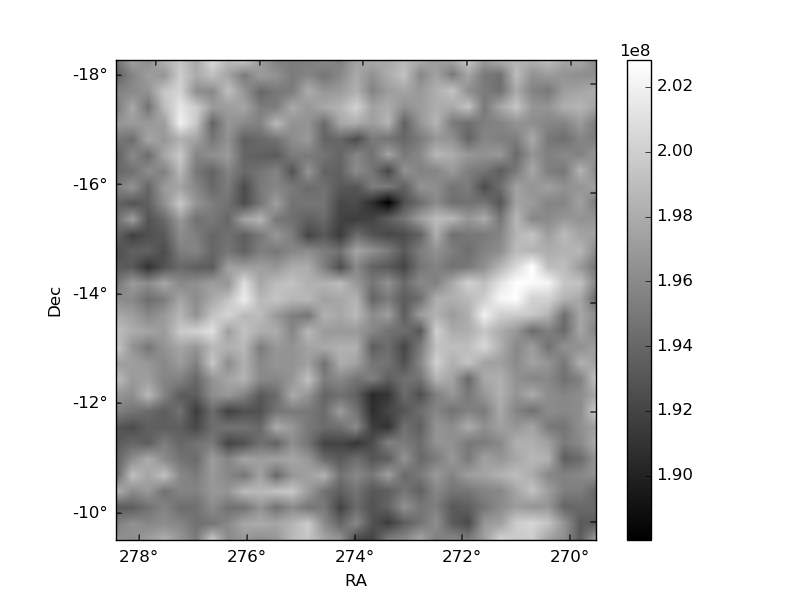
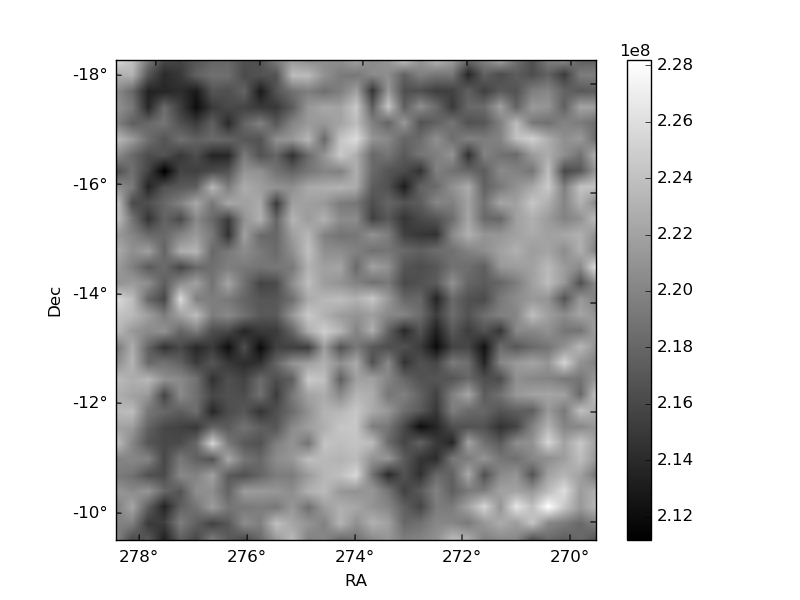
Histogram calculated using DETX and DETY for each event in the final _common_clean file
| Quadrant A | 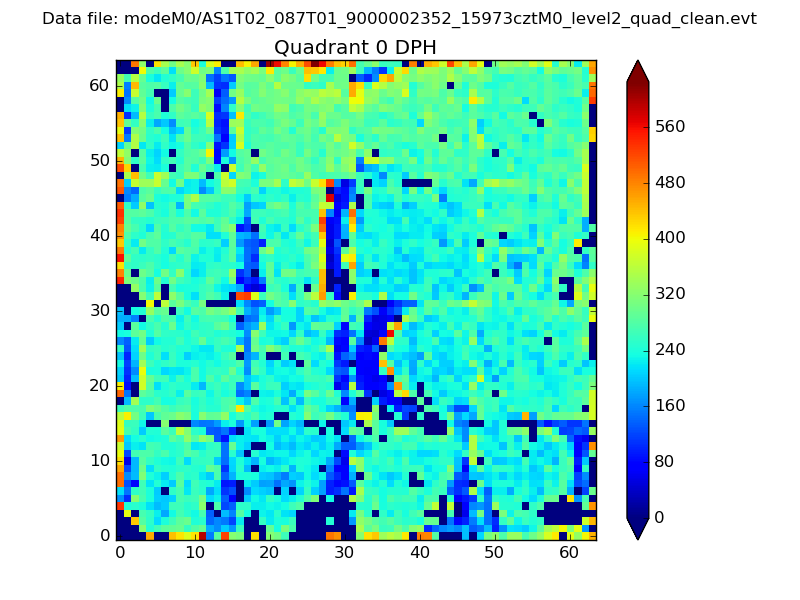 |
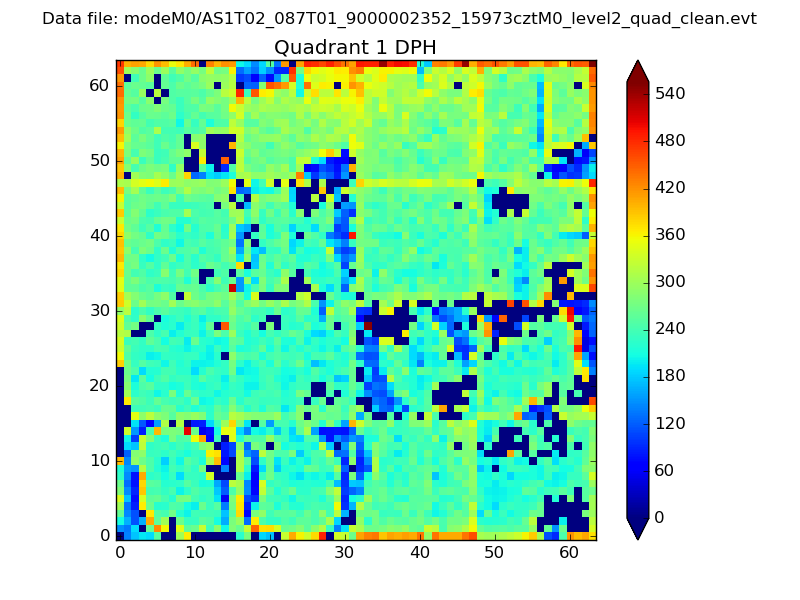 |
Quadrant B |
|---|---|---|---|
| Quadrant D | 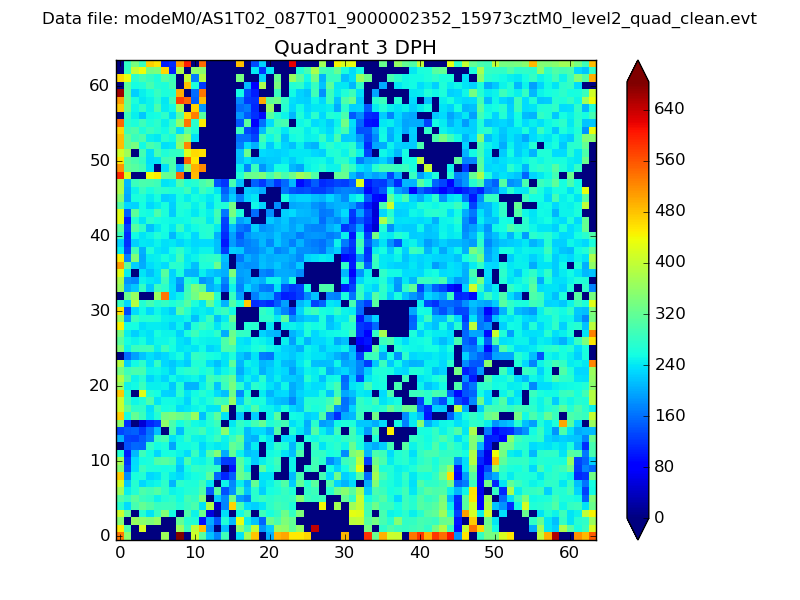 |
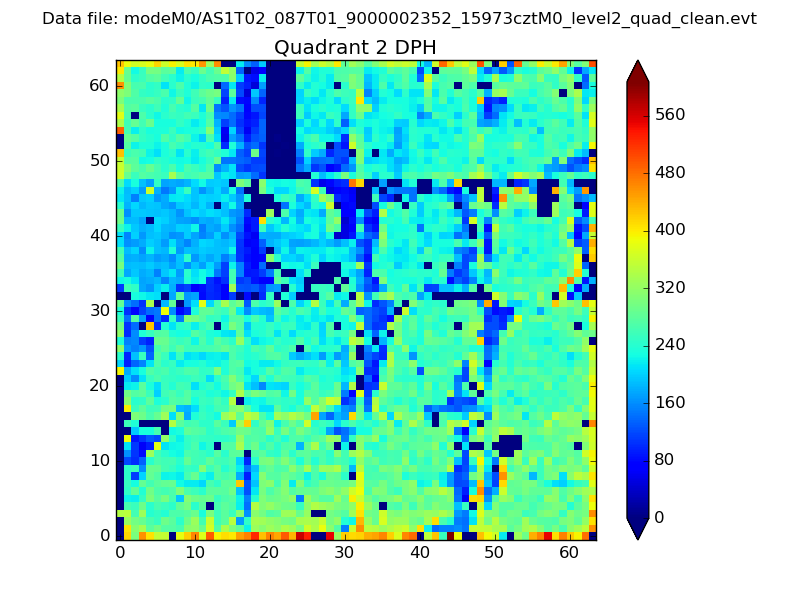 |
Quadrant C |
| Plot type | Count rate plots | Images |
|---|---|---|
| Comparison with Poisson distribution Blue bars denote a histogram of data divided into 1 sec bins. Red curve is a Poisson curve with rate = median count rate of data. |
 |
 |
| Quadrant-wise count rates Data is divided into 100 sec bins |
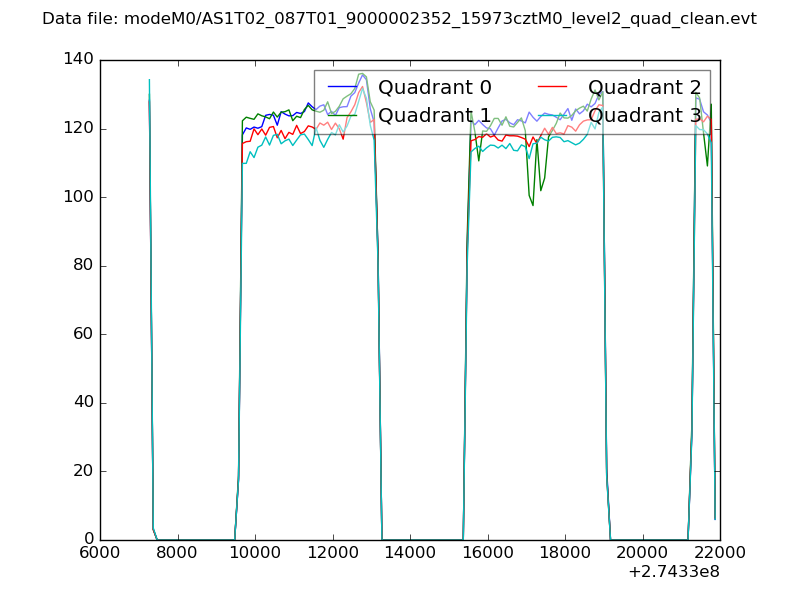 |
|
| Module-wise count rates for Quadrant A Data is divided into 100 sec bins |
 |
 |
| Module-wise count rates for Quadrant B Data is divided into 100 sec bins |
 |
 |
| Module-wise count rates for Quadrant C Data is divided into 100 sec bins |
 |
 |
| Module-wise count rates for Quadrant D Data is divided into 100 sec bins |
 |
 |
| Parameter | Plot |
|---|---|
| CZT HV Monitor | 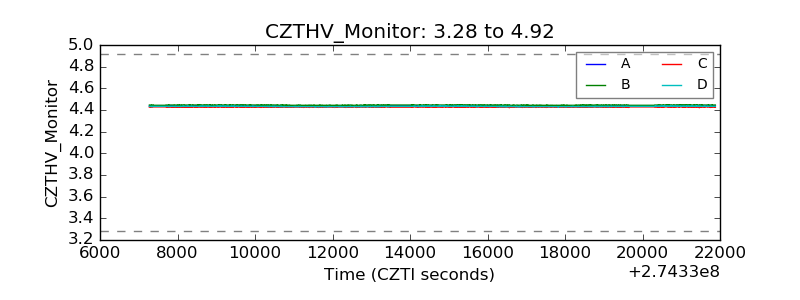 |
| D_VDD | 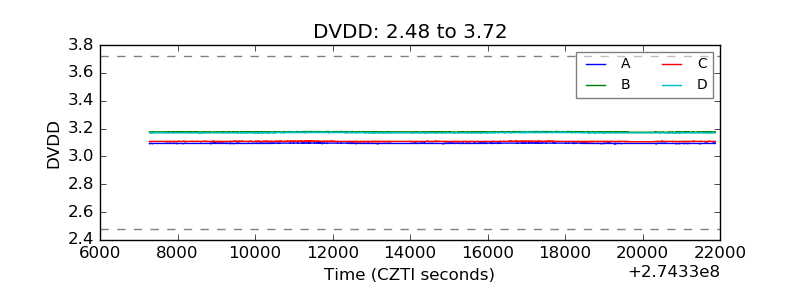 |
| Temperature 1 |  |
| Veto HV Monitor | 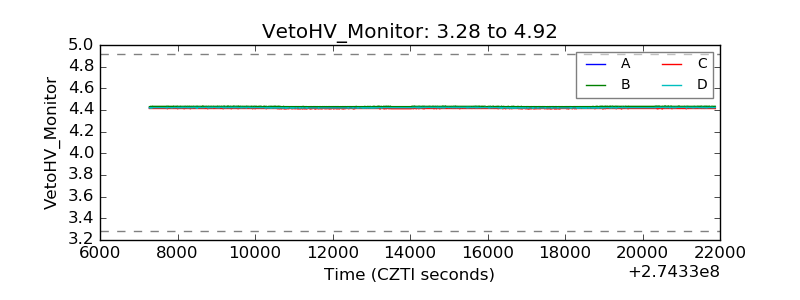 |
| Veto LLD | 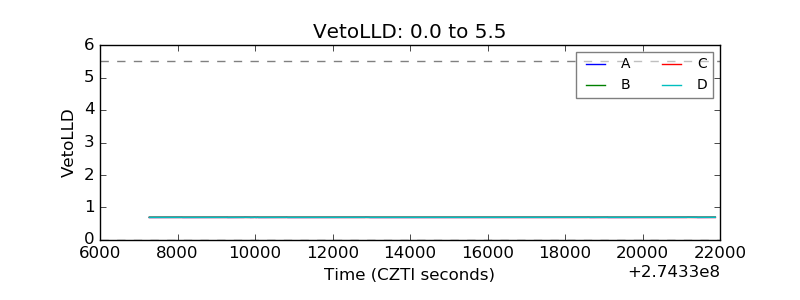 |
| Alpha Counter | 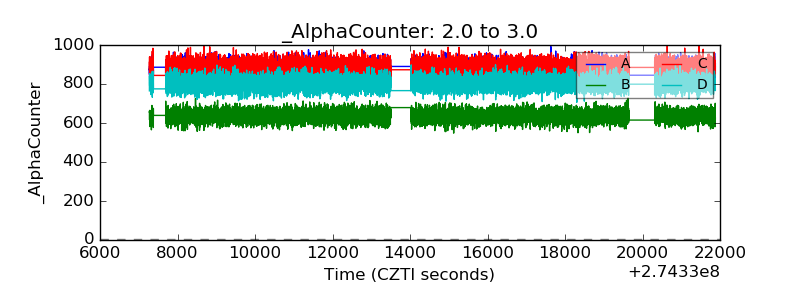 |
| _CPM_Rate | 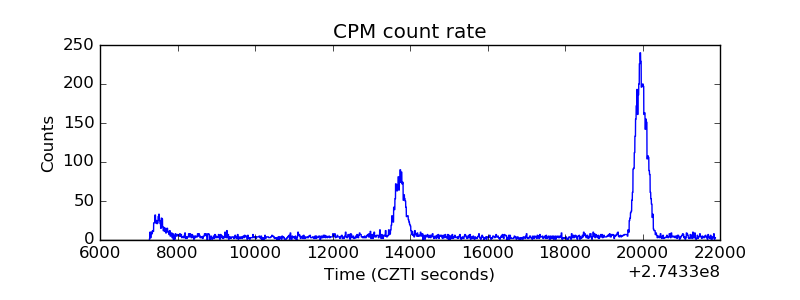 |
| CZT Counter | 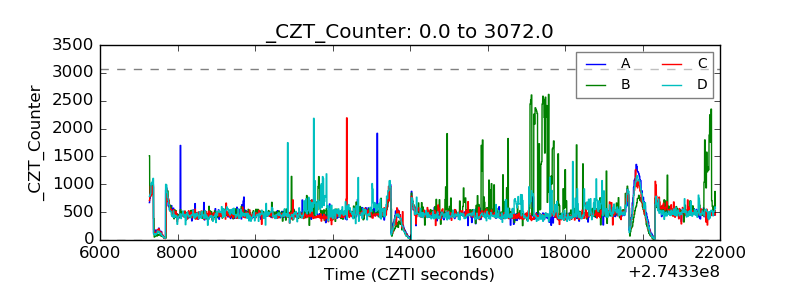 |
| +2.5 Volts monitor |  |
| +5 Volts monitor |  |
| _ROLL_ROT |  |
| _Roll_DEC |  |
| _Roll_RA | 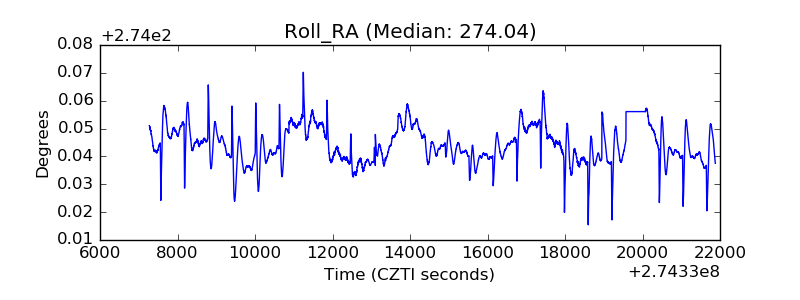 |
| Veto Counter | 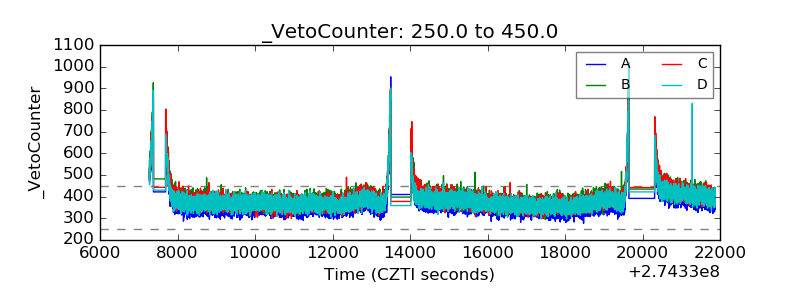 |