| Param | Original file | Final file |
|---|---|---|
| Filename | modeM0/AS1T02_087T01_9000002352_15975cztM0_level2.evt | modeM0/AS1T02_087T01_9000002352_15975cztM0_level2_quad_clean.evt |
| Size (bytes) | 90,204,480 | 25,024,320 |
| Size | 86.0 MB | 23.9 MB |
| Events in quadrant A | 697,971 | 167,478 |
| Events in quadrant B | 662,720 | 170,790 |
| Events in quadrant C | 643,360 | 162,181 |
| Events in quadrant D | 635,814 | 158,759 |
| Mode M0 | |||
|---|---|---|---|
| Quadrant | BADHDUFLAG | Total packets | Discarded packets |
| A | 0 | 2913 | 0 |
| B | 0 | 2695 | 0 |
| C | 0 | 2688 | 0 |
| D | 0 | 2705 | 0 |
| Mode SS | |||
|---|---|---|---|
| Quadrant | BADHDUFLAG | Total packets | Discarded packets |
| A | 0 | 26 | 0 |
| B | 0 | 26 | 0 |
| C | 0 | 26 | 0 |
| D | 0 | 26 | 0 |
| Quadrant | Total seconds | Saturated seconds | Saturation percentage |
|---|---|---|---|
| A | 1308 | 2 | 0.152905% |
| B | 1308 | 2 | 0.152905% |
| C | 1308 | 7 | 0.535168% |
| D | 1308 | 7 | 0.535168% |
Noise dominated data is calculated using 1-second bins in cleaned event files. If a bin has >2000 counts, and if more than 50% of those come from <1% of pixels, then it is considered to be noise-dominated and hence unusable.
| Quadrant | # 1 sec bins | Bins with >0 counts | Bins with >2000 counts | High rate bins dominated by noise | Noise dominated (total time) | Noise dominated (detector-on time) | Marked lightcurve |
|---|---|---|---|---|---|---|---|
| A | 1309 | 1309 | 0 | 0 | 0.00% | 0.00% | 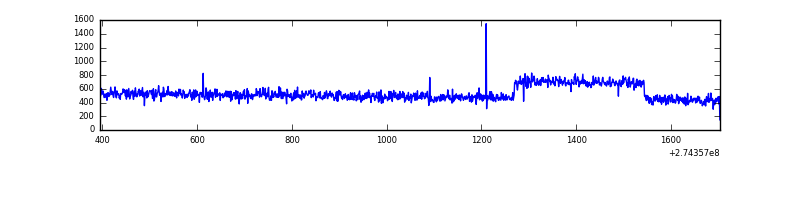 |
| B | 1309 | 1309 | 0 | 0 | 0.00% | 0.00% | 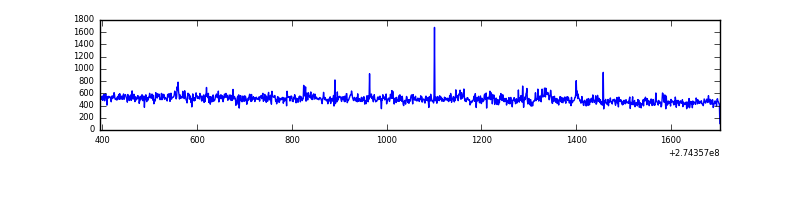 |
| C | 1309 | 1309 | 3 | 3 | 0.23% | 0.23% | 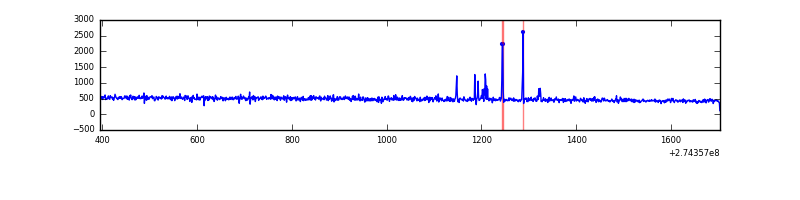 |
| D | 1309 | 1309 | 6 | 6 | 0.46% | 0.46% | 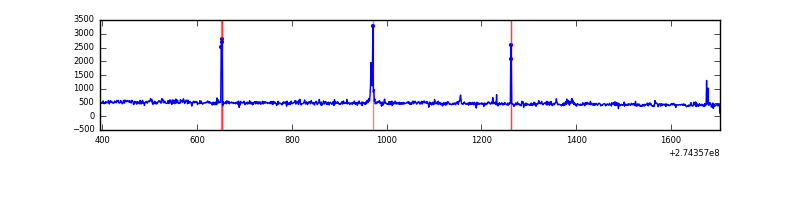 |
Top three noisy pixels from each quadrant. If the there are fewer than three noisy pixels in the level2.evt file, extra rows are filled as -1
| Pixel properties | Quadrant properties | ||||||
|---|---|---|---|---|---|---|---|
| Quadrant | DetID | PixID | Counts | Sigma | Mean | Median | Sigma |
| A | 11 | 29 | 68074 | 1903.19 | 163 | 160 | 35.7 |
| A | 0 | 226 | 1461 | 36.46 | 163 | 160 | 35.7 |
| A | 12 | 194 | 1214 | 29.54 | 163 | 160 | 35.7 |
| B | 0 | 219 | 17352 | 515.14 | 160 | 155 | 33.4 |
| B | 15 | 222 | 5695 | 165.95 | 160 | 155 | 33.4 |
| B | 0 | 229 | 3767 | 108.2 | 160 | 155 | 33.4 |
| C | 14 | 238 | 23457 | 620.49 | 153 | 154 | 37.6 |
| C | 0 | 207 | 18045 | 476.38 | 153 | 154 | 37.6 |
| C | 3 | 233 | 3509 | 89.33 | 153 | 154 | 37.6 |
| D | 2 | 120 | 14433 | 357.31 | 157 | 152 | 40.0 |
| D | 10 | 70 | 11460 | 282.92 | 157 | 152 | 40.0 |
| D | 2 | 152 | 9623 | 236.96 | 157 | 152 | 40.0 |
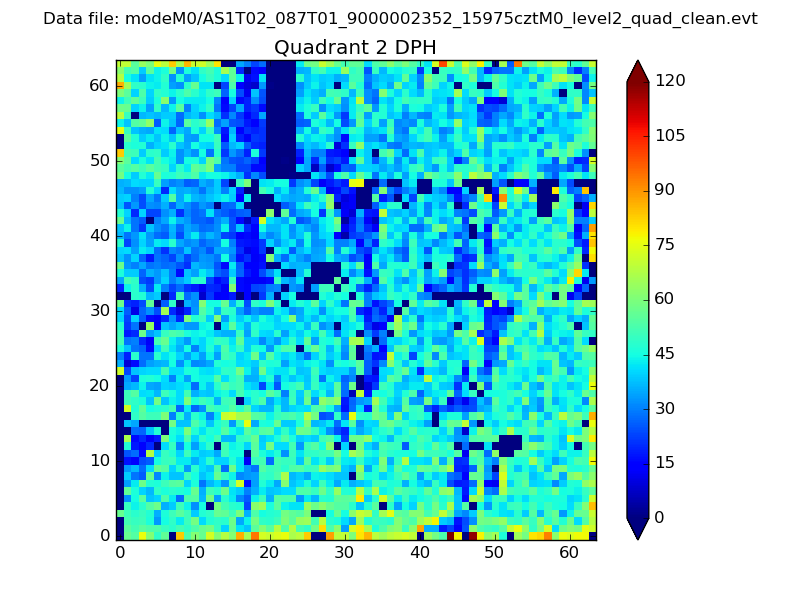
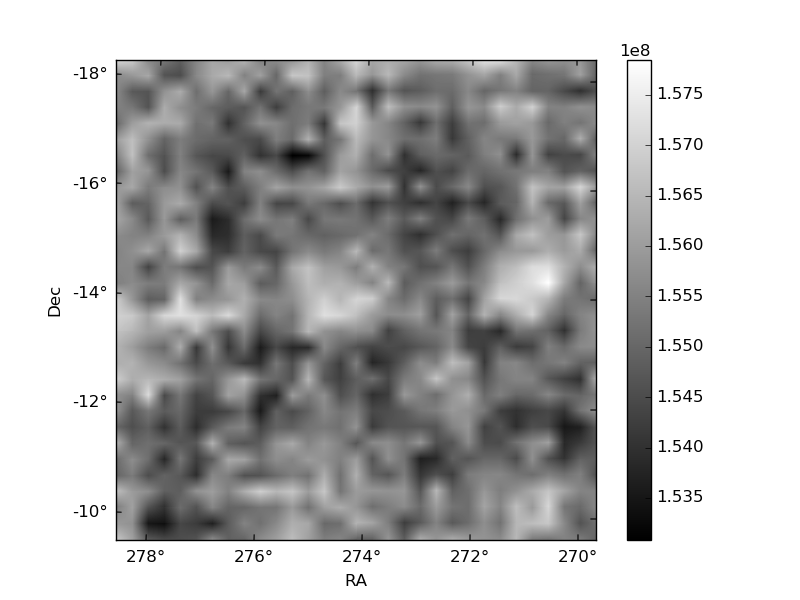
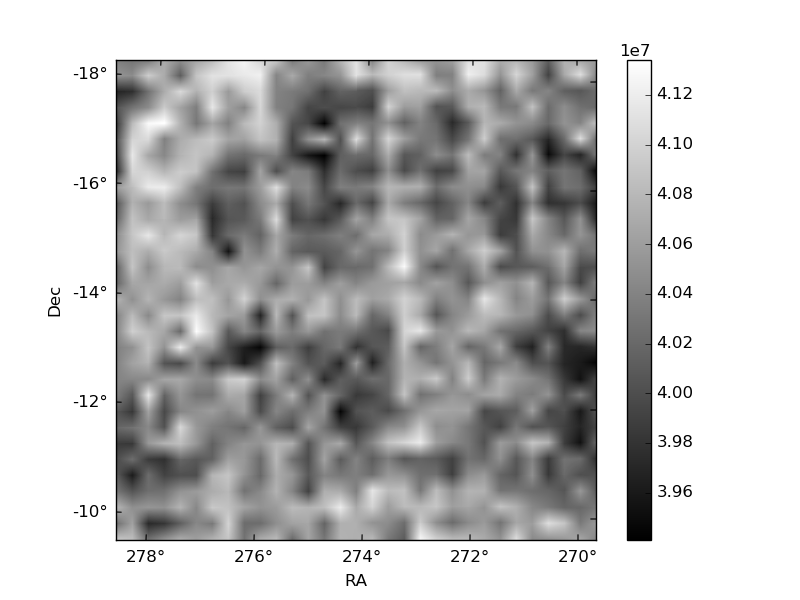
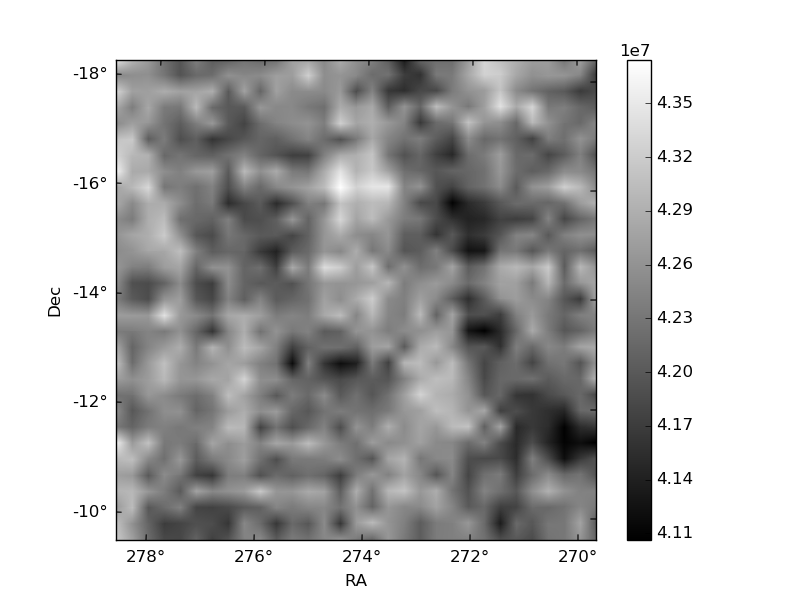
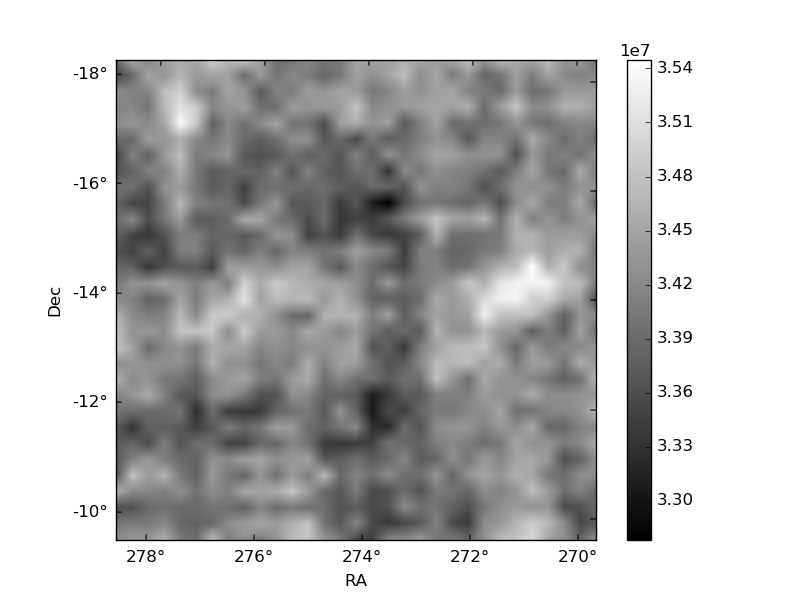
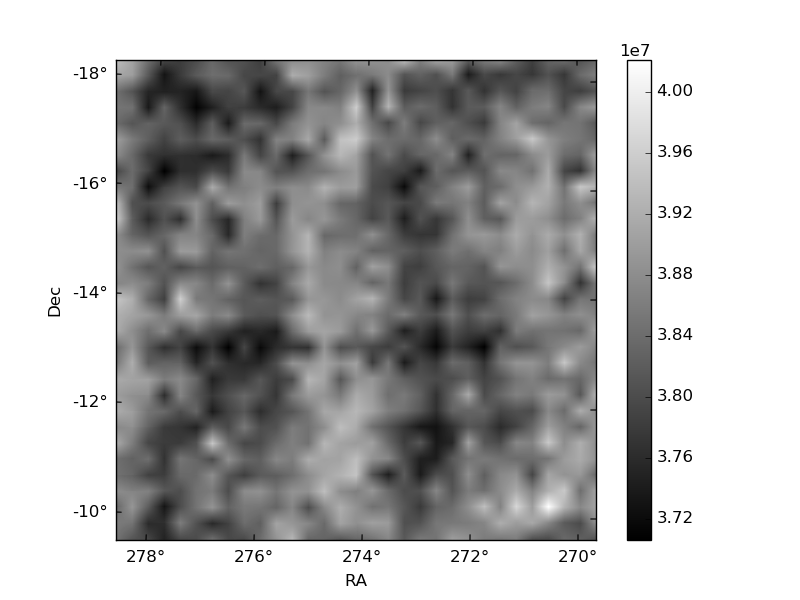
Histogram calculated using DETX and DETY for each event in the final _common_clean file
| Quadrant A | 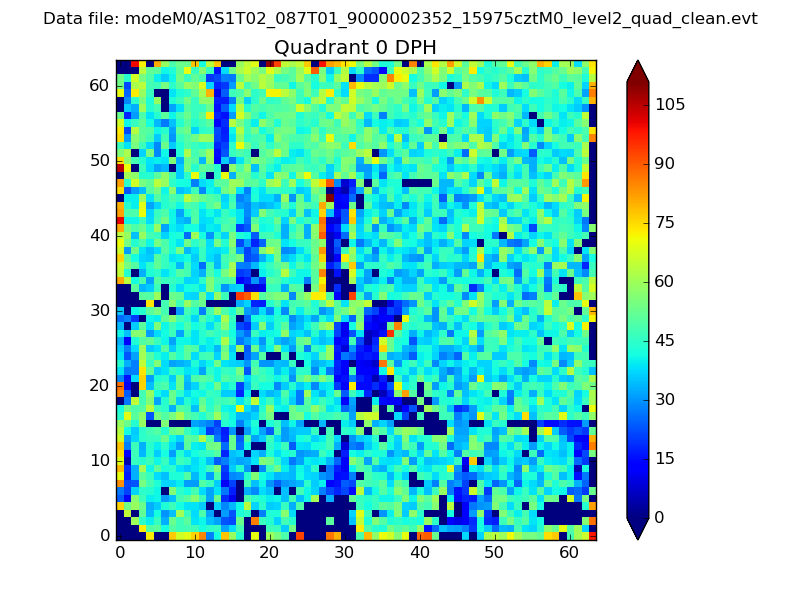 |
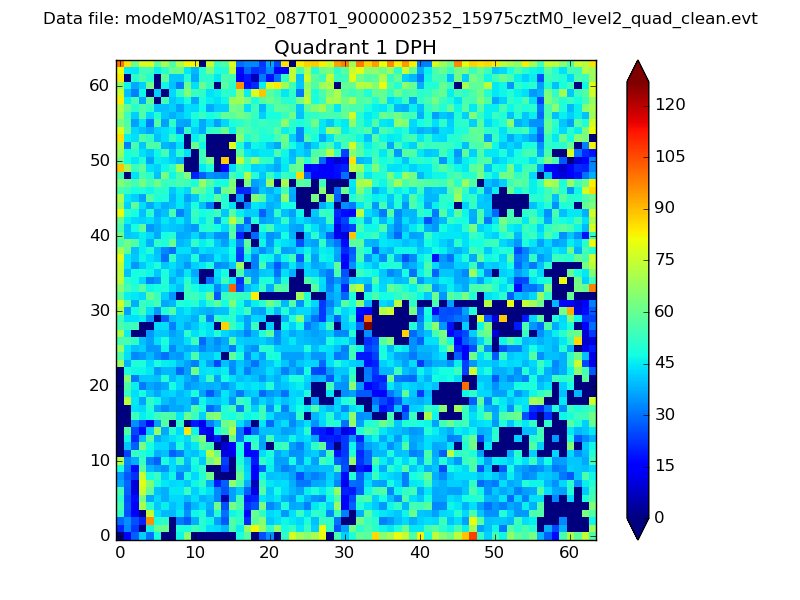 |
Quadrant B |
|---|---|---|---|
| Quadrant D | 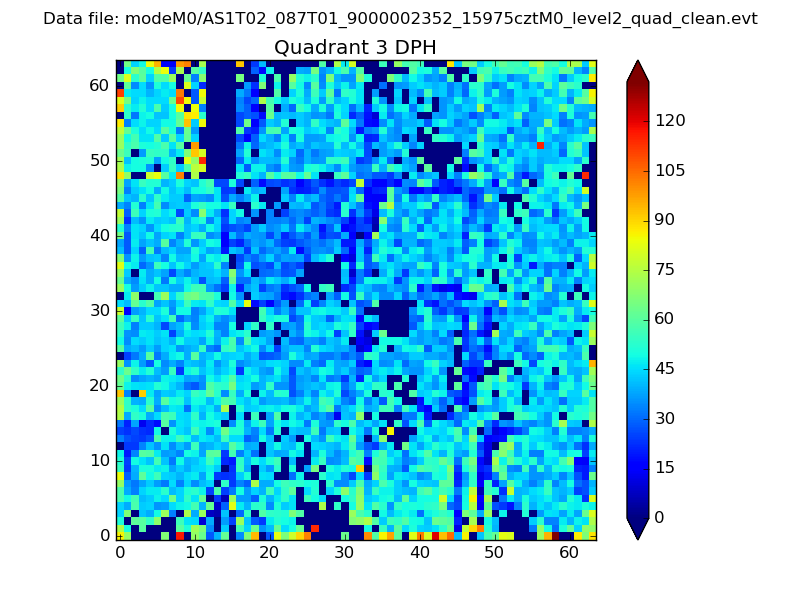 |
 |
Quadrant C |
| Plot type | Count rate plots | Images |
|---|---|---|
| Comparison with Poisson distribution Blue bars denote a histogram of data divided into 1 sec bins. Red curve is a Poisson curve with rate = median count rate of data. |
 |
 |
| Quadrant-wise count rates Data is divided into 100 sec bins |
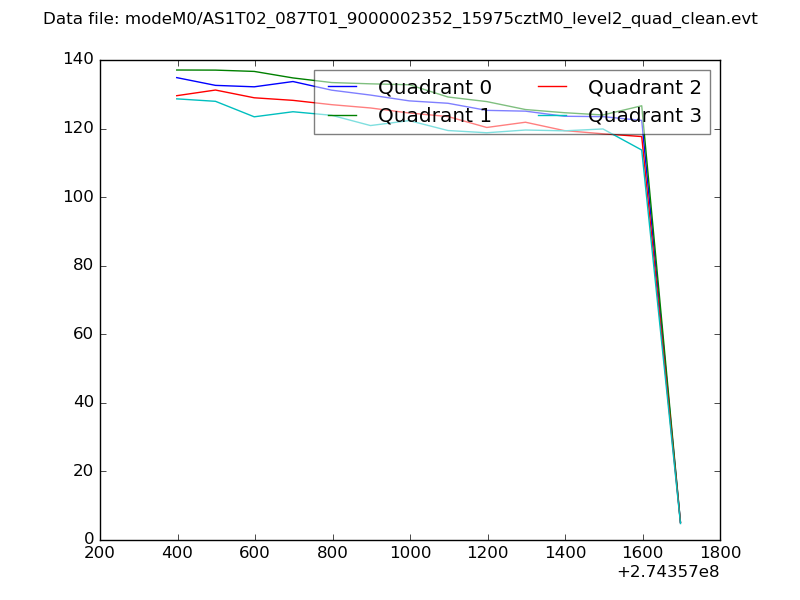 |
|
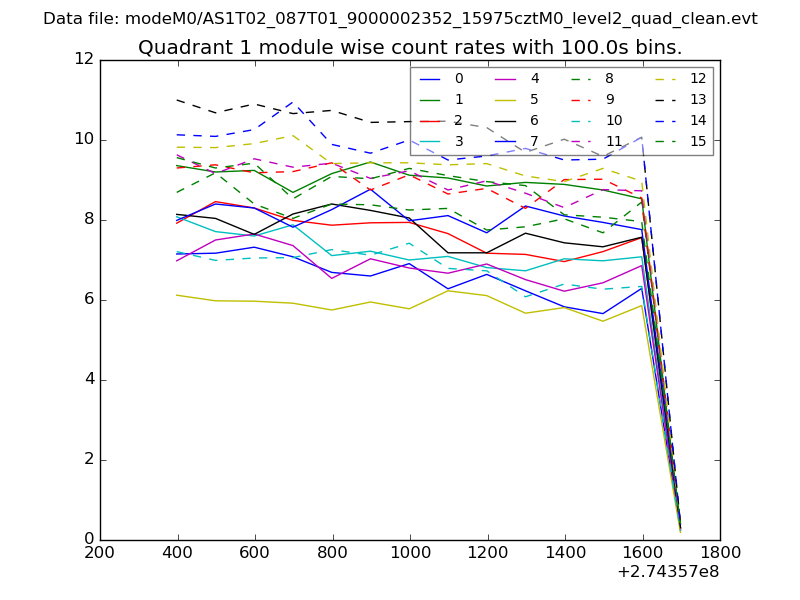
| Module-wise count rates for Quadrant A Data is divided into 100 sec bins |
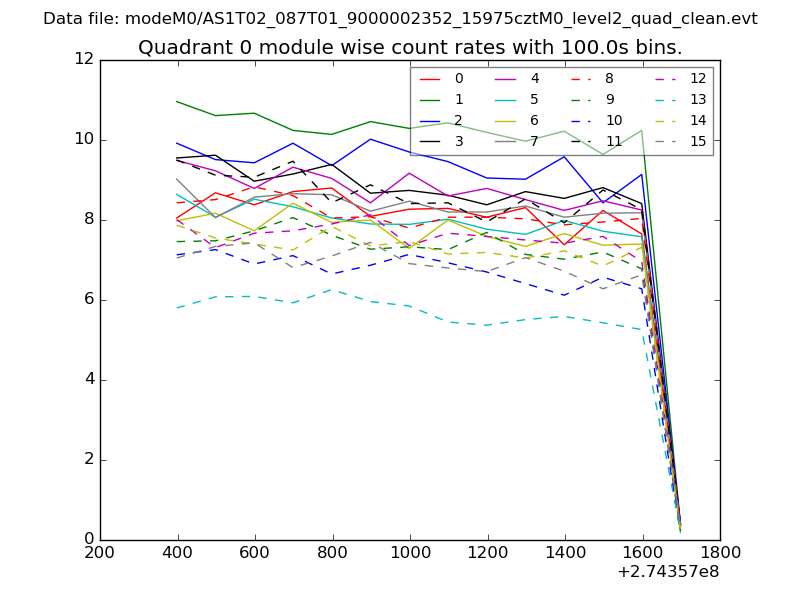 |
 |
| Module-wise count rates for Quadrant B Data is divided into 100 sec bins |
 |
 |
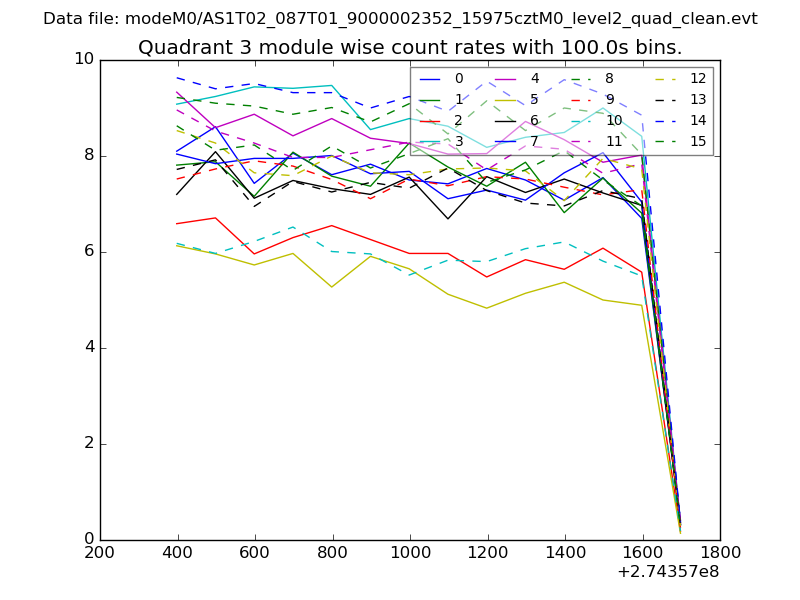
| Module-wise count rates for Quadrant C Data is divided into 100 sec bins |
 |
 |
| Module-wise count rates for Quadrant D Data is divided into 100 sec bins |
 |
 |
| Parameter | Plot |
|---|---|
| CZT HV Monitor |  |
| D_VDD | 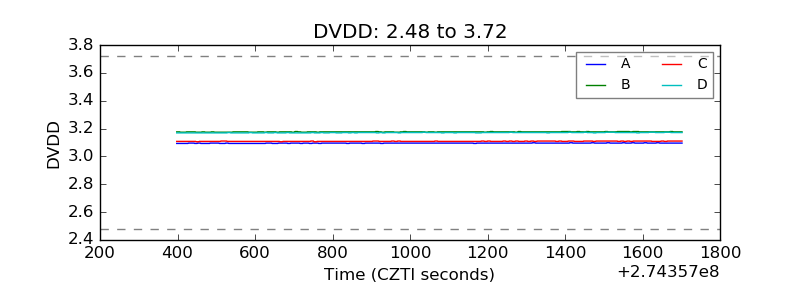 |
| Temperature 1 | 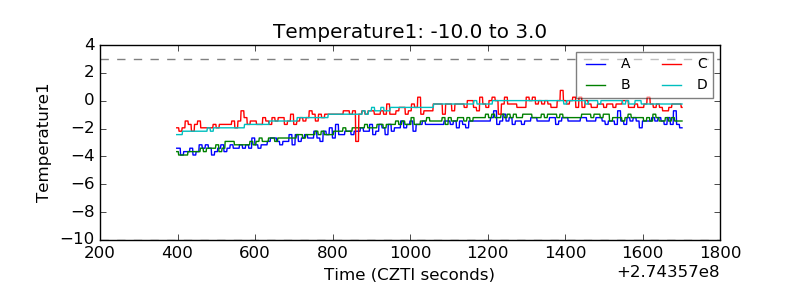 |
| Veto HV Monitor | 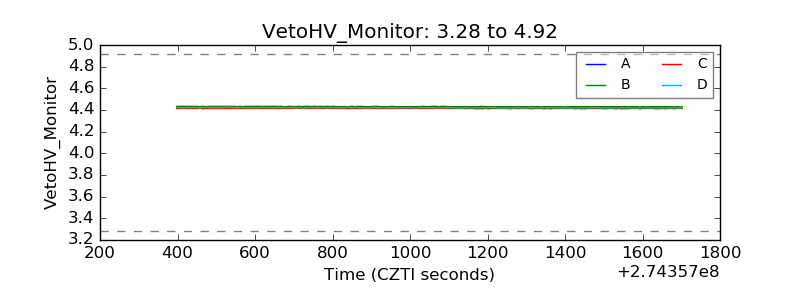 |
| Veto LLD | 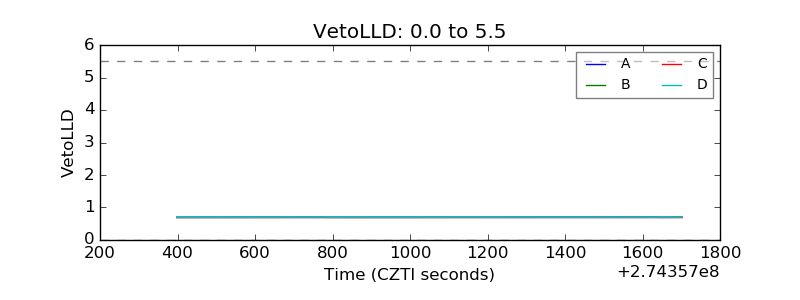 |
| Alpha Counter | 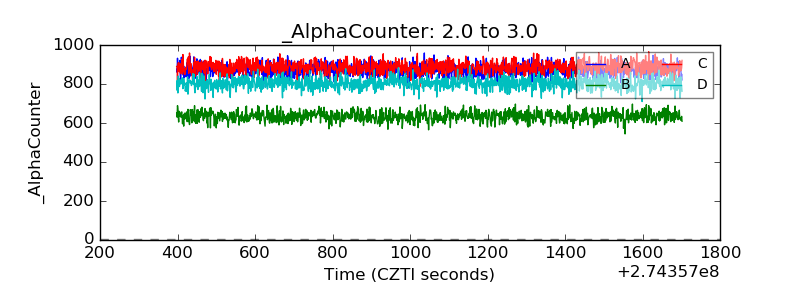 |
| _CPM_Rate | 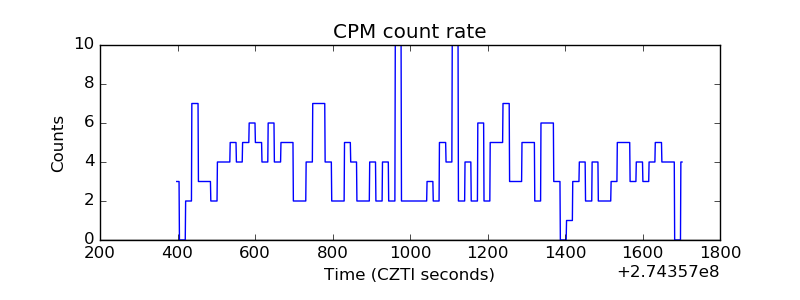 |
| CZT Counter | 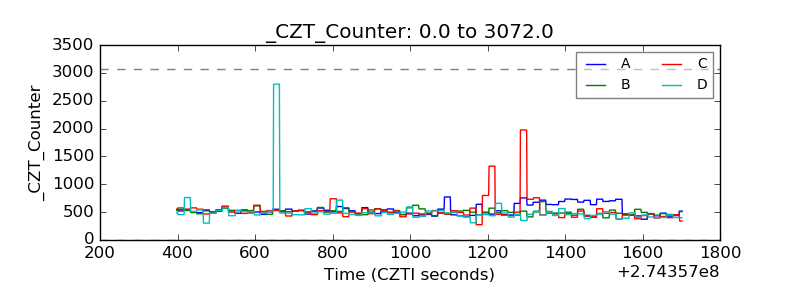 |
| +2.5 Volts monitor | 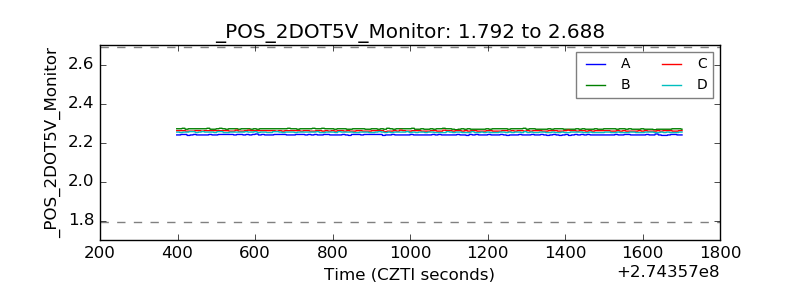 |
| +5 Volts monitor |  |
| _ROLL_ROT | 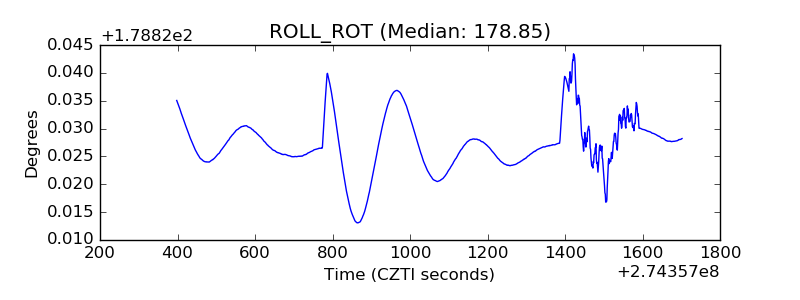 |
| _Roll_DEC | 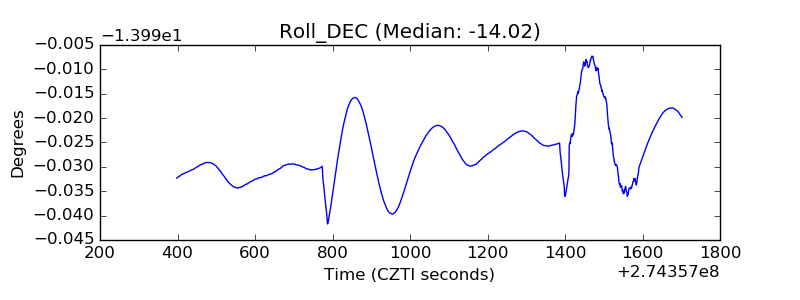 |
| _Roll_RA | 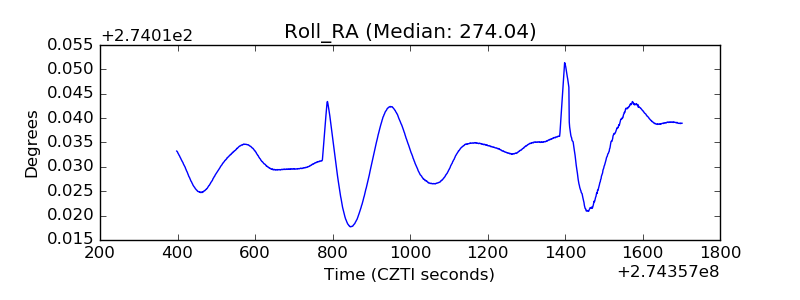 |
| Veto Counter | 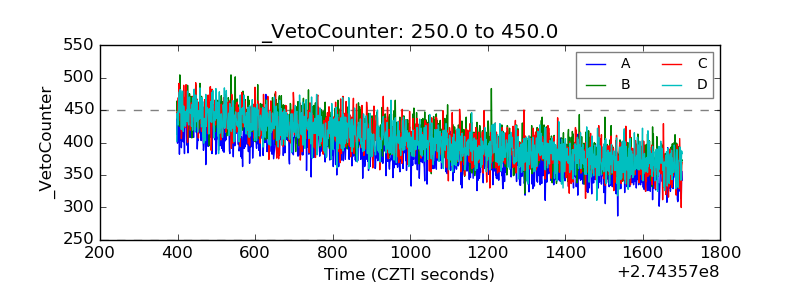 |