| Param | Original file | Final file |
|---|---|---|
| Filename | modeM0/AS1T02_100T01_9000002354cztM0_level2.fits | modeM0/AS1T02_100T01_9000002354cztM0_level2_quad_clean.evt |
| Size (bytes) | 193,464,000 | 122,788,800 |
| Size | 184.5 MB | 117.1 MB |
| Events in quadrant A | 1,207,264 | 622,614 |
| Events in quadrant B | 1,147,848 | 614,526 |
| Events in quadrant C | 1,154,446 | 592,593 |
| Events in quadrant D | 1,011,998 | 549,365 |
| Mode M0 | |||
|---|---|---|---|
| Quadrant | BADHDUFLAG | Total packets | Discarded packets |
| A | 0 | 40917 | 0 |
| B | 0 | 44369 | 0 |
| C | 0 | 40886 | 0 |
| D | 0 | 42527 | 0 |
| Mode SS | |||
|---|---|---|---|
| Quadrant | BADHDUFLAG | Total packets | Discarded packets |
| A | 0 | 396 | 0 |
| B | 0 | 396 | 0 |
| C | 0 | 396 | 0 |
| D | 0 | 396 | 0 |
| Mode M9 | |||
|---|---|---|---|
| Quadrant | BADHDUFLAG | Total packets | Discarded packets |
| A | 0 | 48 | 0 |
| B | 0 | 48 | 0 |
| C | 0 | 48 | 0 |
| D | 0 | 48 | 0 |
| Quadrant | Total seconds | Saturated seconds | Saturation percentage |
|---|---|---|---|
| A | 19422 | 190 | 0.978272% |
| B | 19422 | 243 | 1.251158% |
| C | 19422 | 254 | 1.307795% |
| D | 19422 | 251 | 1.292349% |
Noise dominated data is calculated using 1-second bins in cleaned event files. If a bin has >2000 counts, and if more than 50% of those come from <1% of pixels, then it is considered to be noise-dominated and hence unusable.
| Quadrant | # 1 sec bins | Bins with >0 counts | Bins with >2000 counts | High rate bins dominated by noise | Noise dominated (total time) | Noise dominated (detector-on time) | Marked lightcurve |
|---|---|---|---|---|---|---|---|
| A | 24222 | 19419 | 0 | 0 | 0.00% | 0.00% |  |
| B | 24222 | 19420 | 0 | 0 | 0.00% | 0.00% | 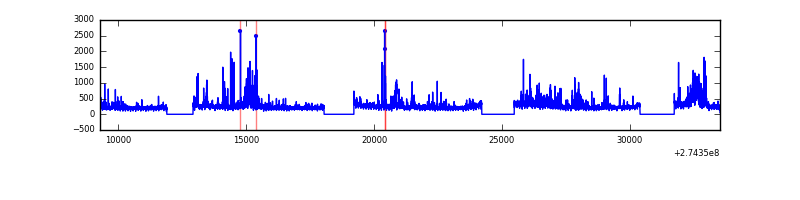 |
| C | 24222 | 19421 | 0 | 0 | 0.00% | 0.00% |  |
| D | 24222 | 19419 | 0 | 0 | 0.00% | 0.00% |  |
Top three noisy pixels from each quadrant. If the there are fewer than three noisy pixels in the level2.evt file, extra rows are filled as -1
| Pixel properties | Quadrant properties | ||||||
|---|---|---|---|---|---|---|---|
| Quadrant | DetID | PixID | Counts | Sigma | Mean | Median | Sigma |
| A | 0 | 29 | 1179 | 11.22 | 314 | 296 | 78.7 |
| A | 7 | 110 | 937 | 8.15 | 314 | 296 | 78.7 |
| A | 0 | 30 | 931 | 8.07 | 314 | 296 | 78.7 |
| B | 2 | 9 | 925 | 10.31 | 304 | 291 | 61.5 |
| B | 14 | 254 | 777 | 7.9 | 304 | 291 | 61.5 |
| B | 5 | 128 | 772 | 7.82 | 304 | 291 | 61.5 |
| C | 1 | 80 | 875 | 7.36 | 304 | 286 | 80.0 |
| C | 1 | 81 | 870 | 7.3 | 304 | 286 | 80.0 |
| C | 2 | 191 | 807 | 6.51 | 304 | 286 | 80.0 |
| D | 6 | 38 | 768 | 6.49 | 288 | 263 | 77.8 |
| D | 6 | 67 | 741 | 6.15 | 288 | 263 | 77.8 |
| D | 10 | 189 | 737 | 6.1 | 288 | 263 | 77.8 |
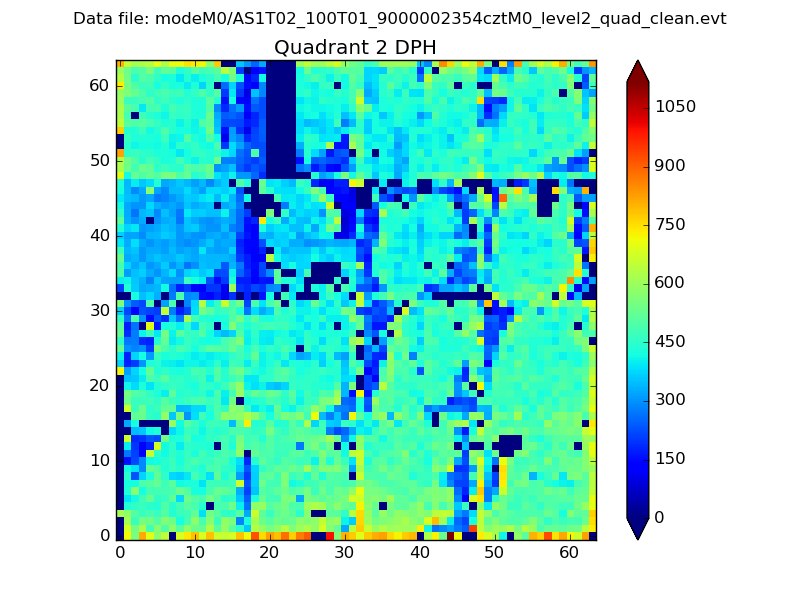
Histogram calculated using DETX and DETY for each event in the final _common_clean file
| Quadrant A |  |
 |
Quadrant B |
|---|---|---|---|
| Quadrant D |  |
 |
Quadrant C |
| Plot type | Count rate plots | Images |
|---|---|---|
| Comparison with Poisson distribution Blue bars denote a histogram of data divided into 1 sec bins. Red curve is a Poisson curve with rate = median count rate of data. |
 |
 |
| Quadrant-wise count rates Data is divided into 100 sec bins |
 |
|
| Module-wise count rates for Quadrant A Data is divided into 100 sec bins |
 |
 |
| Module-wise count rates for Quadrant B Data is divided into 100 sec bins |
 |
 |
| Module-wise count rates for Quadrant C Data is divided into 100 sec bins |
 |
 |
| Module-wise count rates for Quadrant D Data is divided into 100 sec bins |
 |
 |
| Parameter | Plot |
|---|---|
| CZT HV Monitor |  |
| D_VDD | 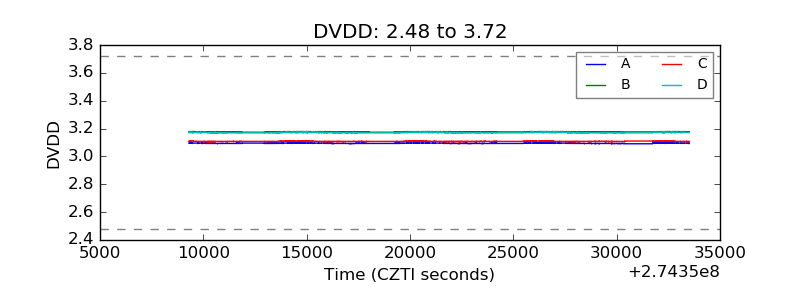 |
| Temperature 1 |  |
| Veto HV Monitor |  |
| Veto LLD | 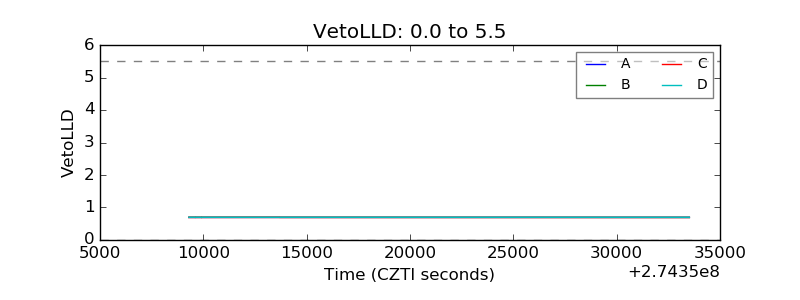 |
| Alpha Counter |  |
| _CPM_Rate |  |
| CZT Counter | 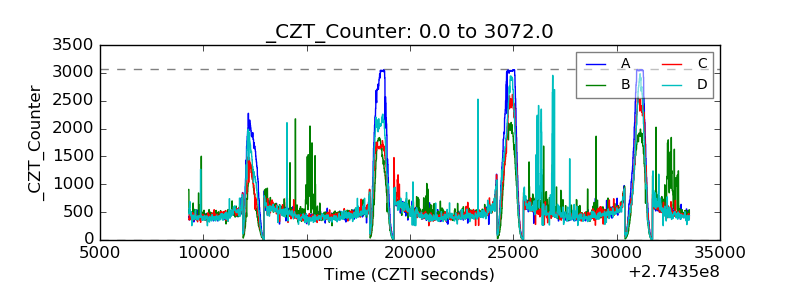 |
| +2.5 Volts monitor |  |
| +5 Volts monitor |  |
| _ROLL_ROT |  |
| _Roll_DEC |  |
| _Roll_RA |  |
| Veto Counter |  |