| Param | Original file | Final file |
|---|---|---|
| Filename | modeM0/AS1T02_100T01_9000002354_15977cztM0_level2.evt | modeM0/AS1T02_100T01_9000002354_15977cztM0_level2_quad_clean.evt |
| Size (bytes) | 433,992,960 | 97,473,600 |
| Size | 413.9 MB | 93.0 MB |
| Events in quadrant A | 3,085,945 | 640,535 |
| Events in quadrant B | 3,494,615 | 640,977 |
| Events in quadrant C | 3,116,590 | 615,116 |
| Events in quadrant D | 3,014,227 | 611,782 |
| Mode M0 | |||
|---|---|---|---|
| Quadrant | BADHDUFLAG | Total packets | Discarded packets |
| A | 0 | 13371 | 2 |
| B | 0 | 14357 | 1 |
| C | 0 | 13479 | 1 |
| D | 0 | 13403 | 1 |
| Mode SS | |||
|---|---|---|---|
| Quadrant | BADHDUFLAG | Total packets | Discarded packets |
| A | 0 | 128 | 0 |
| B | 0 | 128 | 0 |
| C | 0 | 128 | 0 |
| D | 0 | 128 | 0 |
| Mode M9 | |||
|---|---|---|---|
| Quadrant | BADHDUFLAG | Total packets | Discarded packets |
| A | 0 | 12 | 0 |
| B | 0 | 12 | 0 |
| C | 0 | 12 | 0 |
| D | 0 | 12 | 0 |
| Quadrant | Total seconds | Saturated seconds | Saturation percentage |
|---|---|---|---|
| A | 6359 | 53 | 0.833464% |
| B | 6359 | 65 | 1.022173% |
| C | 6359 | 73 | 1.147979% |
| D | 6359 | 37 | 0.581852% |
Noise dominated data is calculated using 1-second bins in cleaned event files. If a bin has >2000 counts, and if more than 50% of those come from <1% of pixels, then it is considered to be noise-dominated and hence unusable.
| Quadrant | # 1 sec bins | Bins with >0 counts | Bins with >2000 counts | High rate bins dominated by noise | Noise dominated (total time) | Noise dominated (detector-on time) | Marked lightcurve |
|---|---|---|---|---|---|---|---|
| A | 7525 | 6360 | 0 | 0 | 0.00% | 0.00% | 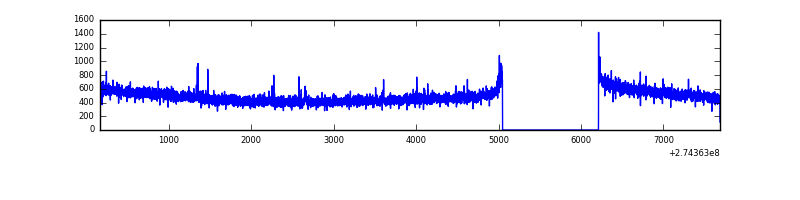 |
| B | 7525 | 6360 | 15 | 15 | 0.20% | 0.24% | 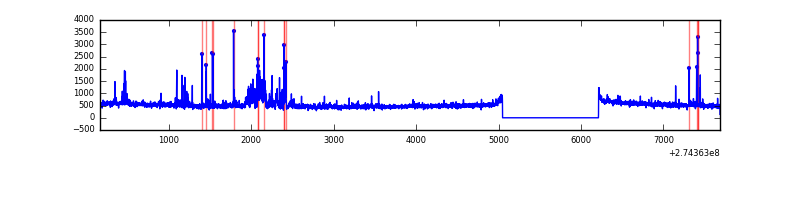 |
| C | 7525 | 6361 | 0 | 0 | 0.00% | 0.00% | 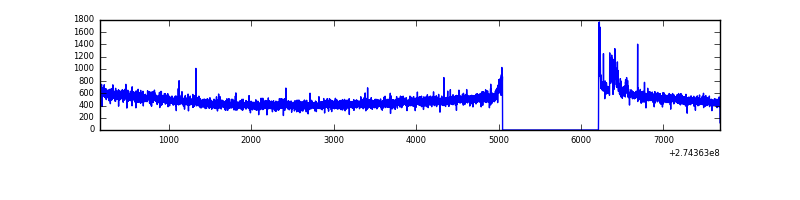 |
| D | 7525 | 6360 | 3 | 3 | 0.04% | 0.05% | 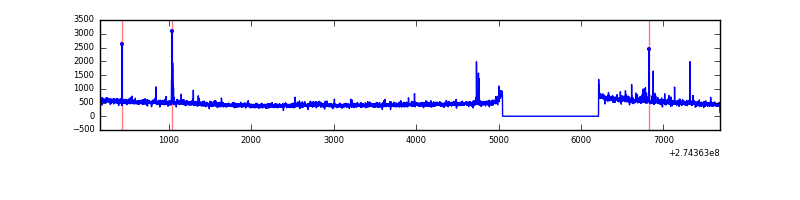 |
Top three noisy pixels from each quadrant. If the there are fewer than three noisy pixels in the level2.evt file, extra rows are filled as -1
| Pixel properties | Quadrant properties | ||||||
|---|---|---|---|---|---|---|---|
| Quadrant | DetID | PixID | Counts | Sigma | Mean | Median | Sigma |
| A | 9 | 143 | 11085 | 63.57 | 797 | 781 | 162.1 |
| A | 0 | 226 | 7182 | 39.49 | 797 | 781 | 162.1 |
| A | 12 | 194 | 6058 | 32.55 | 797 | 781 | 162.1 |
| B | 4 | 216 | 120188 | 802.03 | 787 | 770 | 148.9 |
| B | 7 | 220 | 89462 | 595.67 | 787 | 770 | 148.9 |
| B | 4 | 173 | 41286 | 272.11 | 787 | 770 | 148.9 |
| C | 14 | 238 | 114826 | 651.45 | 747 | 753 | 175.1 |
| C | 3 | 233 | 77779 | 439.88 | 747 | 753 | 175.1 |
| C | 0 | 207 | 8255 | 42.84 | 747 | 753 | 175.1 |
| D | 10 | 70 | 34644 | 183.93 | 766 | 745 | 184.3 |
| D | 1 | 52 | 29351 | 155.21 | 766 | 745 | 184.3 |
| D | 2 | 234 | 28249 | 149.23 | 766 | 745 | 184.3 |
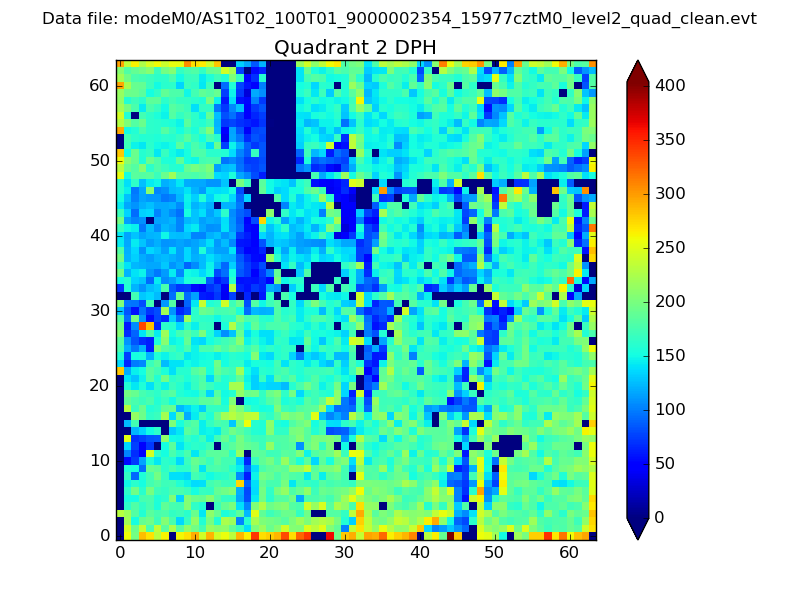
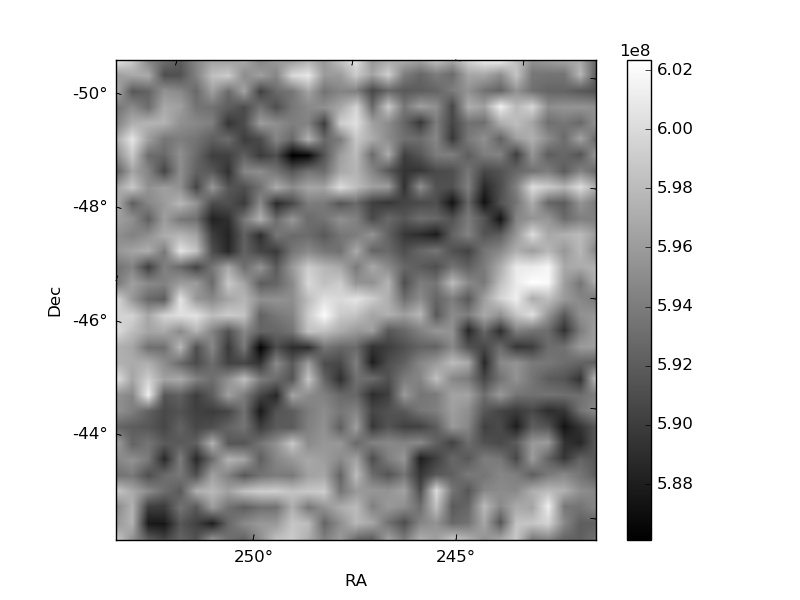
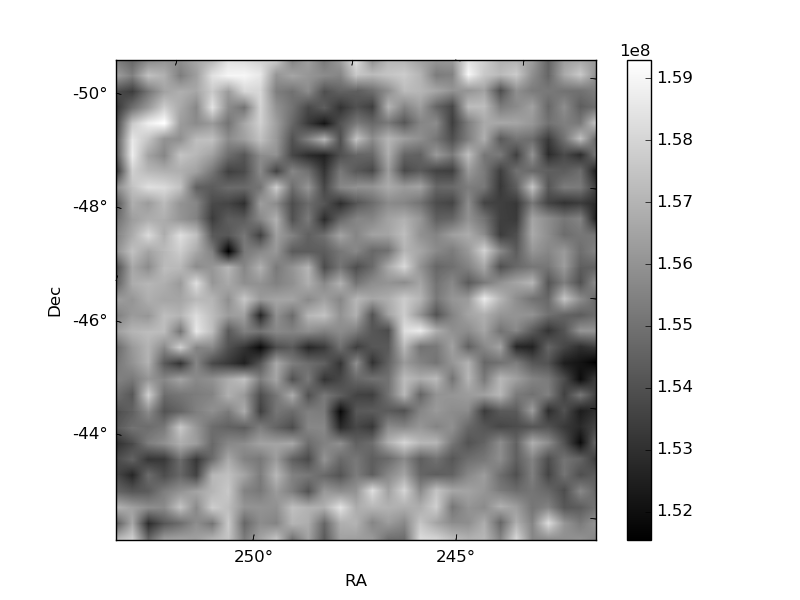
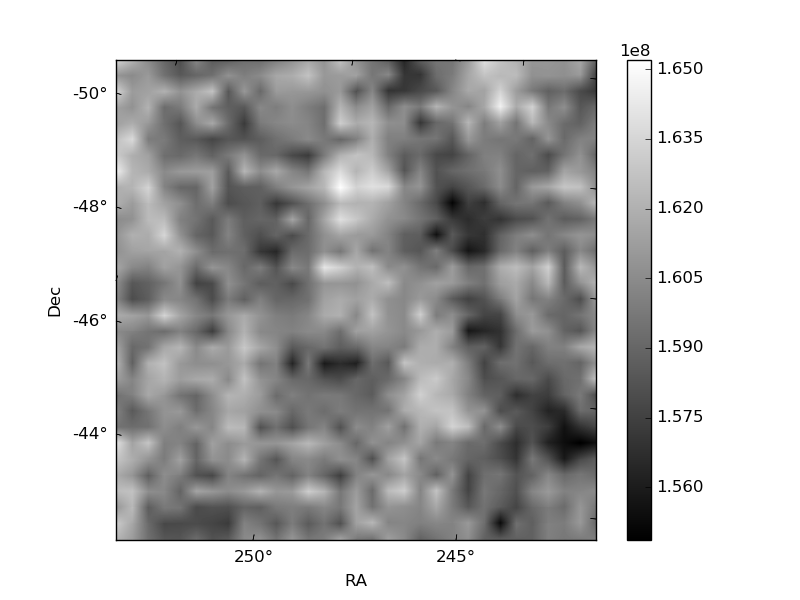
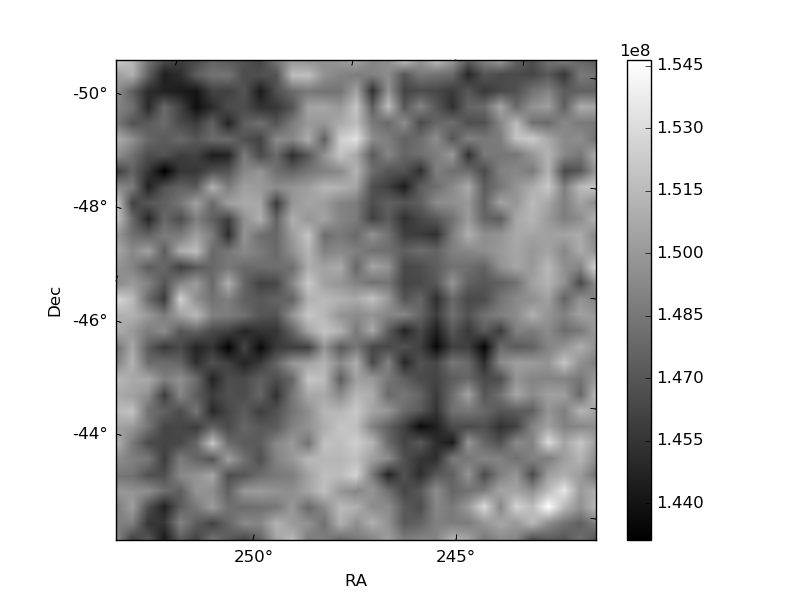
Histogram calculated using DETX and DETY for each event in the final _common_clean file
| Quadrant A | 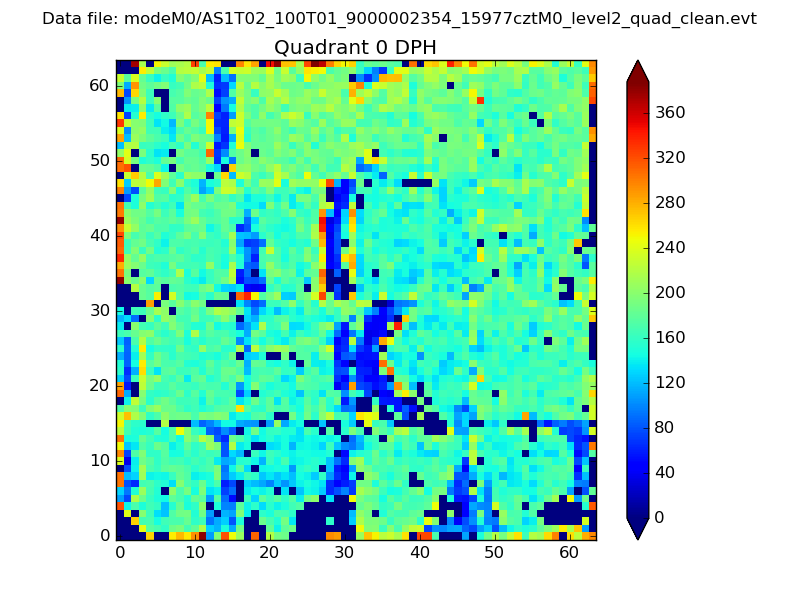 |
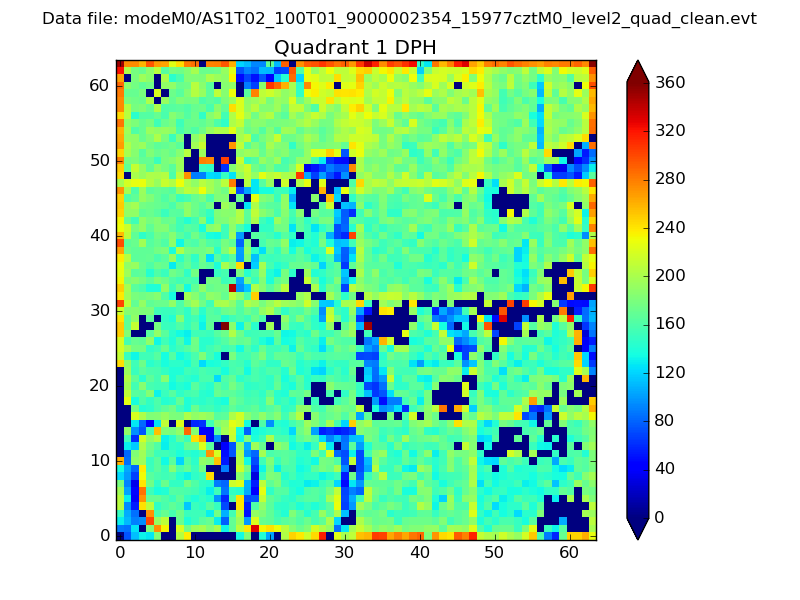 |
Quadrant B |
|---|---|---|---|
| Quadrant D | 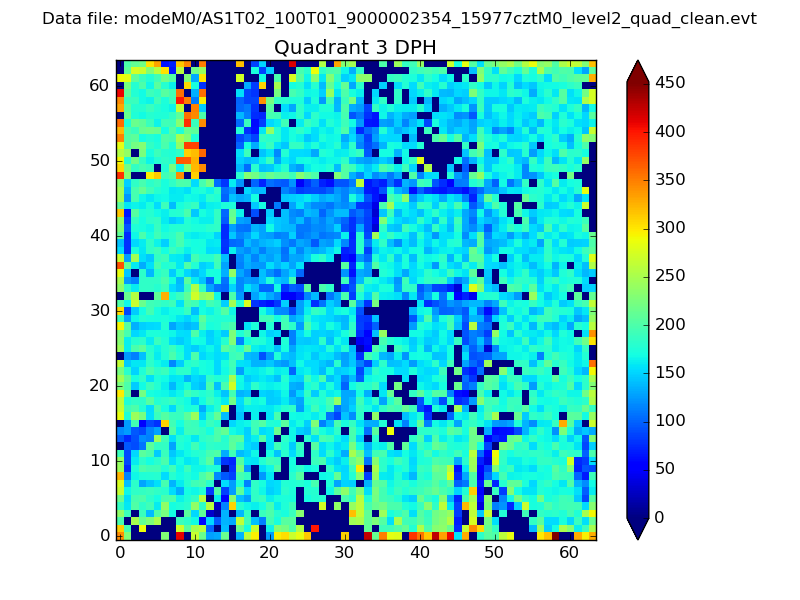 |
 |
Quadrant C |
| Plot type | Count rate plots | Images |
|---|---|---|
| Comparison with Poisson distribution Blue bars denote a histogram of data divided into 1 sec bins. Red curve is a Poisson curve with rate = median count rate of data. |
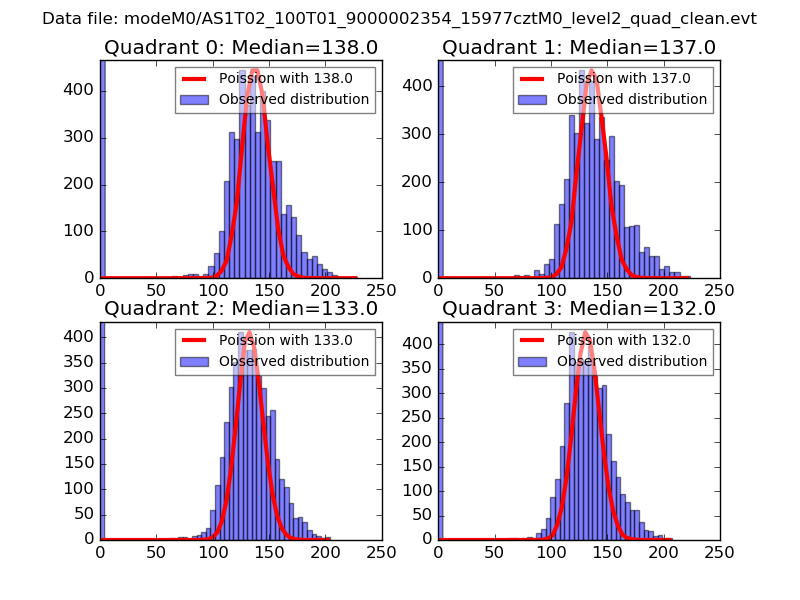 |
 |
| Quadrant-wise count rates Data is divided into 100 sec bins |
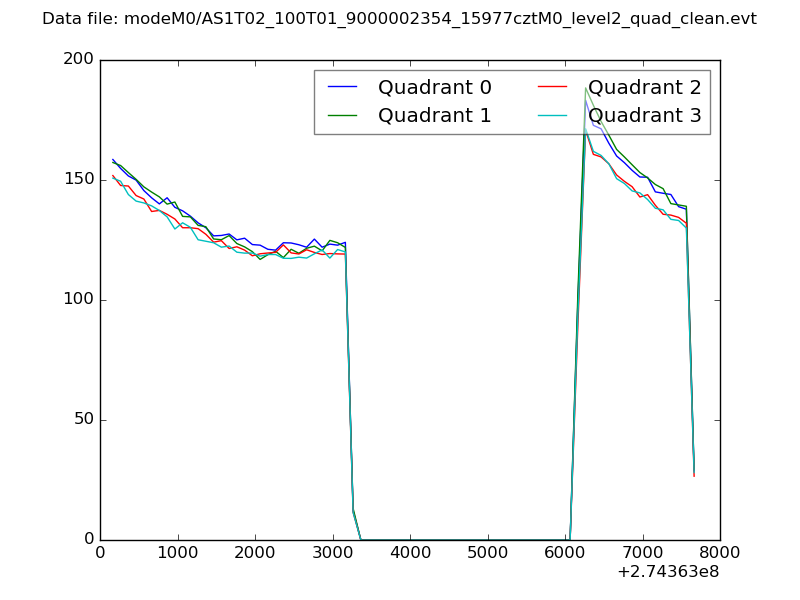 |
|
| Module-wise count rates for Quadrant A Data is divided into 100 sec bins |
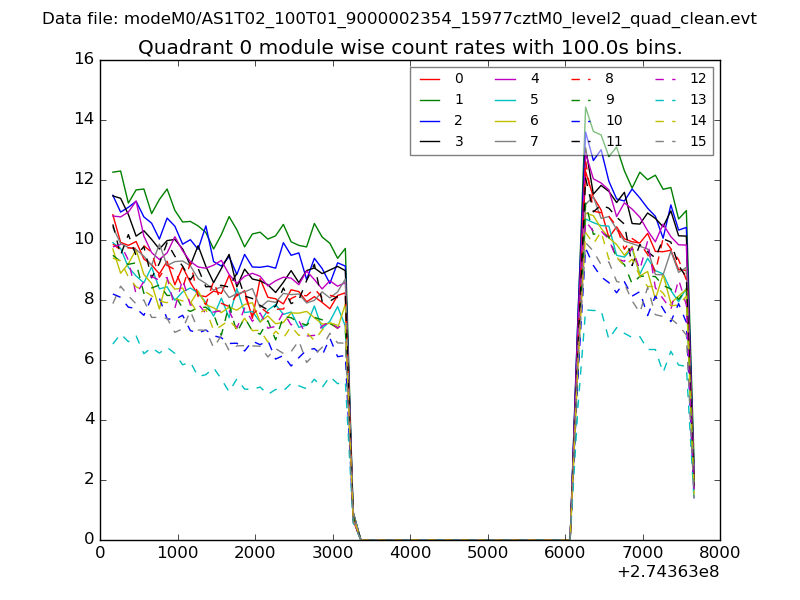 |
 |
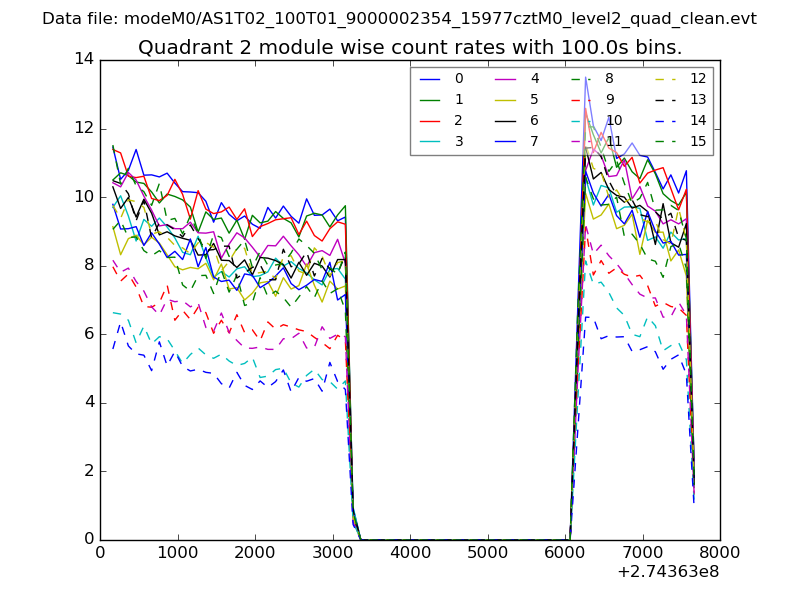
| Module-wise count rates for Quadrant B Data is divided into 100 sec bins |
 |
 |
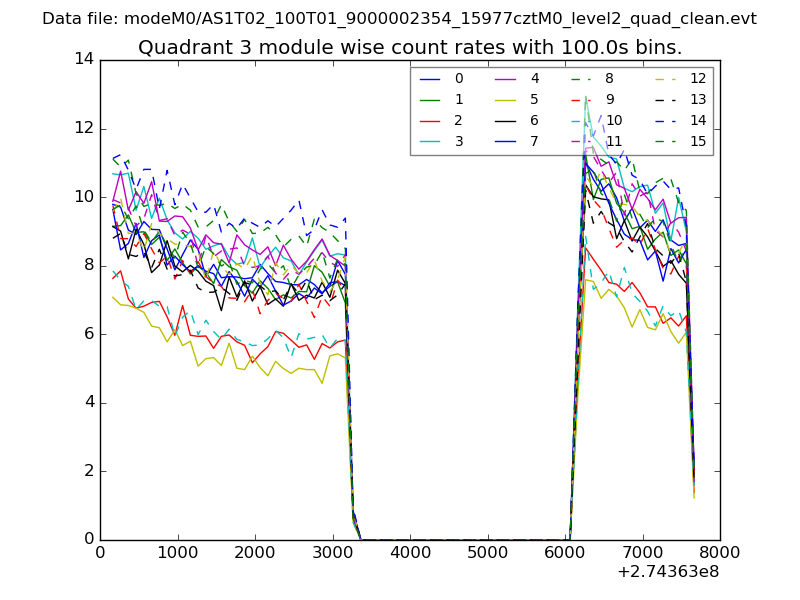
| Module-wise count rates for Quadrant C Data is divided into 100 sec bins |
 |
 |
| Module-wise count rates for Quadrant D Data is divided into 100 sec bins |
 |
 |
| Parameter | Plot |
|---|---|
| CZT HV Monitor | 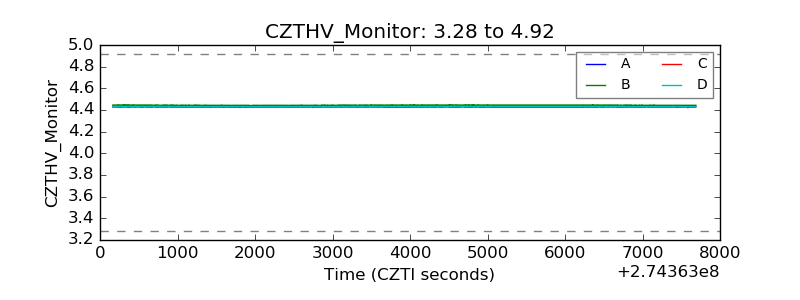 |
| D_VDD | 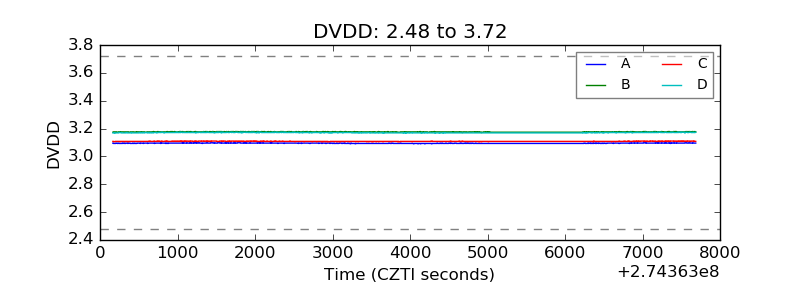 |
| Temperature 1 | 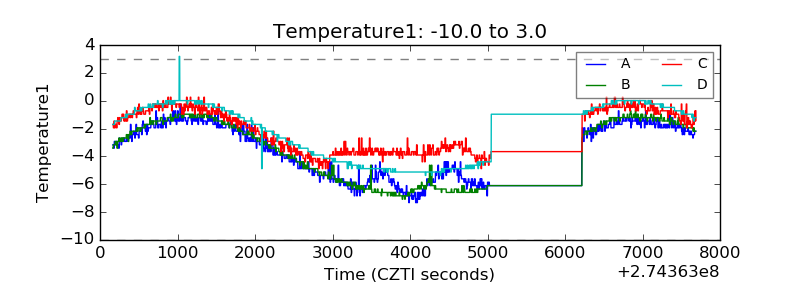 |
| Veto HV Monitor |  |
| Veto LLD | 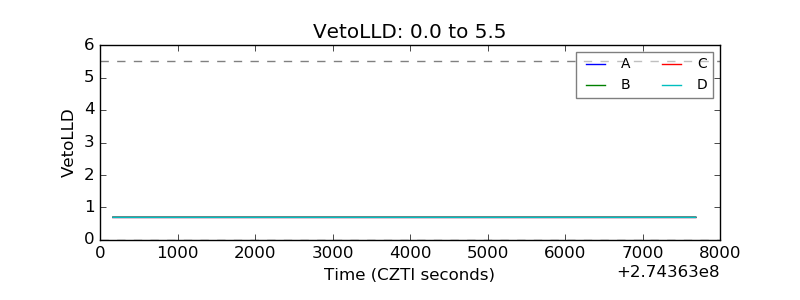 |
| Alpha Counter | 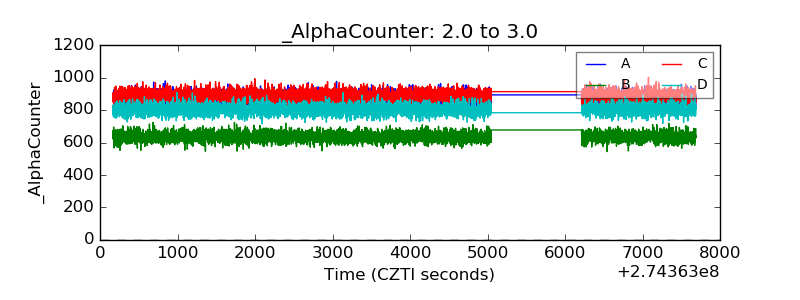 |
| _CPM_Rate | 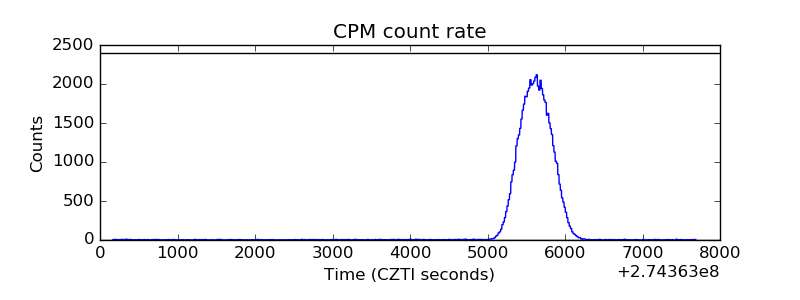 |
| CZT Counter | 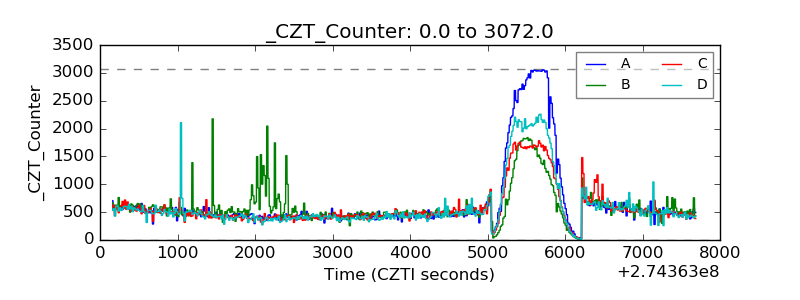 |
| +2.5 Volts monitor |  |
| +5 Volts monitor |  |
| _ROLL_ROT | 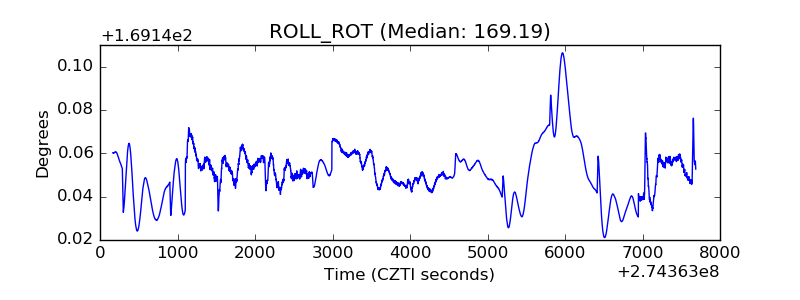 |
| _Roll_DEC | 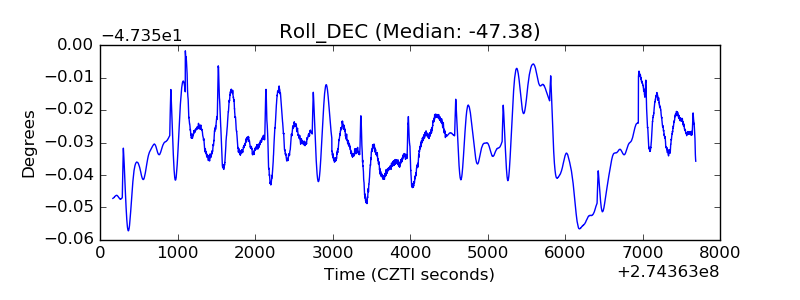 |
| _Roll_RA |  |
| Veto Counter | 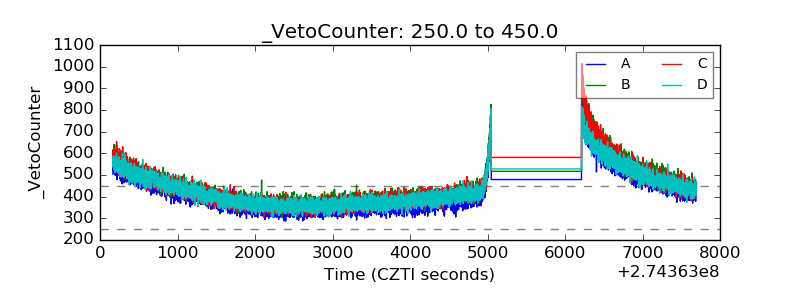 |