| Param | Original file | Final file |
|---|---|---|
| Filename | modeM0/AS1T02_100T01_9000002354_15978cztM0_level2.evt | modeM0/AS1T02_100T01_9000002354_15978cztM0_level2_quad_clean.evt |
| Size (bytes) | 438,865,920 | 94,167,360 |
| Size | 418.5 MB | 89.8 MB |
| Events in quadrant A | 3,060,634 | 623,128 |
| Events in quadrant B | 3,398,450 | 625,398 |
| Events in quadrant C | 3,034,072 | 593,507 |
| Events in quadrant D | 3,380,089 | 580,400 |
| Mode M0 | |||
|---|---|---|---|
| Quadrant | BADHDUFLAG | Total packets | Discarded packets |
| A | 0 | 13118 | 2 |
| B | 0 | 14093 | 1 |
| C | 0 | 12982 | 1 |
| D | 0 | 14418 | 1 |
| Mode SS | |||
|---|---|---|---|
| Quadrant | BADHDUFLAG | Total packets | Discarded packets |
| A | 0 | 126 | 0 |
| B | 0 | 126 | 0 |
| C | 0 | 126 | 0 |
| D | 0 | 126 | 0 |
| Mode M9 | |||
|---|---|---|---|
| Quadrant | BADHDUFLAG | Total packets | Discarded packets |
| A | 0 | 12 | 0 |
| B | 0 | 12 | 0 |
| C | 0 | 12 | 0 |
| D | 0 | 12 | 0 |
| Quadrant | Total seconds | Saturated seconds | Saturation percentage |
|---|---|---|---|
| A | 6145 | 58 | 0.943857% |
| B | 6145 | 63 | 1.025224% |
| C | 6145 | 70 | 1.139138% |
| D | 6145 | 148 | 2.408462% |
Noise dominated data is calculated using 1-second bins in cleaned event files. If a bin has >2000 counts, and if more than 50% of those come from <1% of pixels, then it is considered to be noise-dominated and hence unusable.
| Quadrant | # 1 sec bins | Bins with >0 counts | Bins with >2000 counts | High rate bins dominated by noise | Noise dominated (total time) | Noise dominated (detector-on time) | Marked lightcurve |
|---|---|---|---|---|---|---|---|
| A | 7416 | 6146 | 0 | 0 | 0.00% | 0.00% | 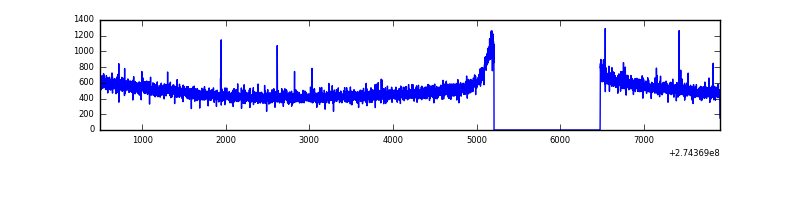 |
| B | 7416 | 6147 | 7 | 7 | 0.09% | 0.11% | 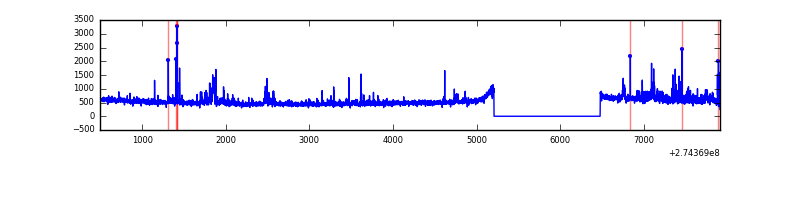 |
| C | 7416 | 6147 | 0 | 0 | 0.00% | 0.00% | 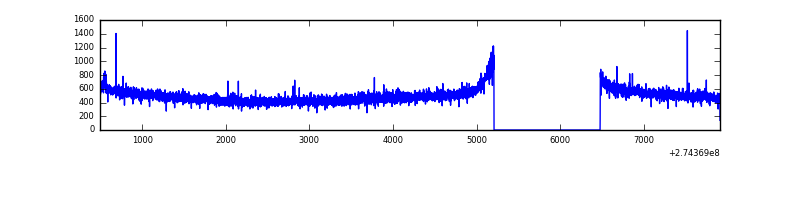 |
| D | 7416 | 6146 | 108 | 108 | 1.46% | 1.76% | 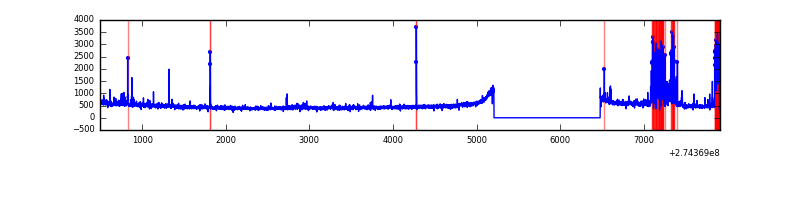 |
Top three noisy pixels from each quadrant. If the there are fewer than three noisy pixels in the level2.evt file, extra rows are filled as -1
| Pixel properties | Quadrant properties | ||||||
|---|---|---|---|---|---|---|---|
| Quadrant | DetID | PixID | Counts | Sigma | Mean | Median | Sigma |
| A | 0 | 226 | 7225 | 40.02 | 795 | 782 | 161.0 |
| A | 12 | 194 | 6092 | 32.98 | 795 | 782 | 161.0 |
| A | 3 | 137 | 4831 | 25.15 | 795 | 782 | 161.0 |
| B | 7 | 220 | 73921 | 497.75 | 783 | 766 | 147.0 |
| B | 0 | 189 | 69085 | 464.85 | 783 | 766 | 147.0 |
| B | 4 | 216 | 47352 | 316.98 | 783 | 766 | 147.0 |
| C | 14 | 238 | 114491 | 658.12 | 737 | 743 | 172.8 |
| C | 3 | 233 | 35492 | 201.05 | 737 | 743 | 172.8 |
| C | 0 | 207 | 11105 | 59.95 | 737 | 743 | 172.8 |
| D | 12 | 218 | 253274 | 1387.1 | 752 | 734 | 182.1 |
| D | 7 | 55 | 122770 | 670.29 | 752 | 734 | 182.1 |
| D | 2 | 152 | 53015 | 287.16 | 752 | 734 | 182.1 |
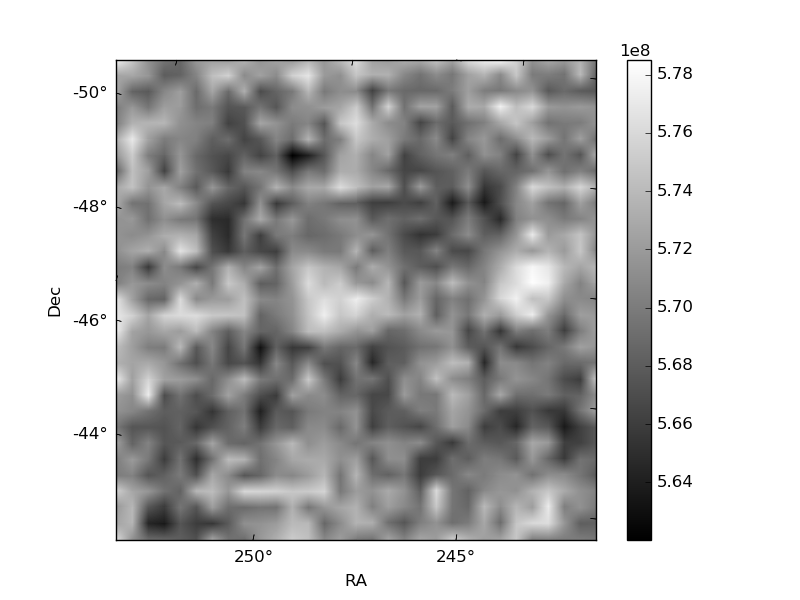
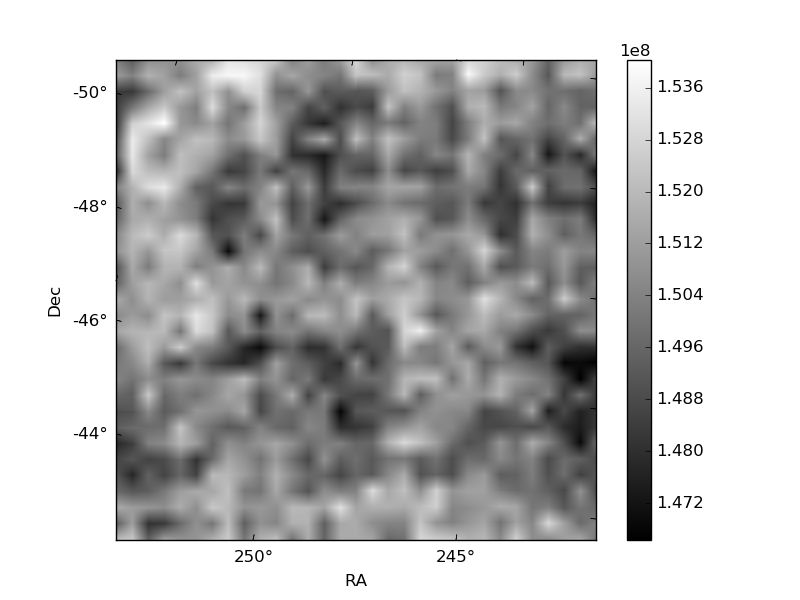
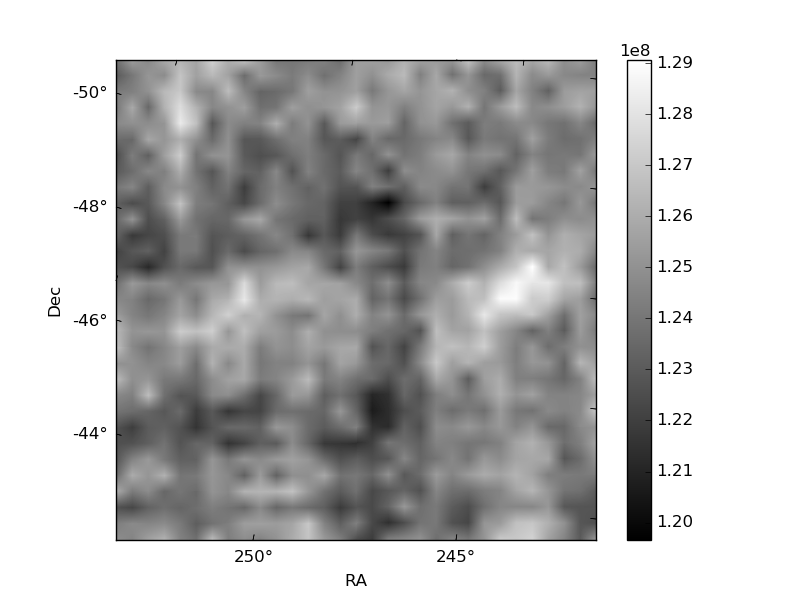
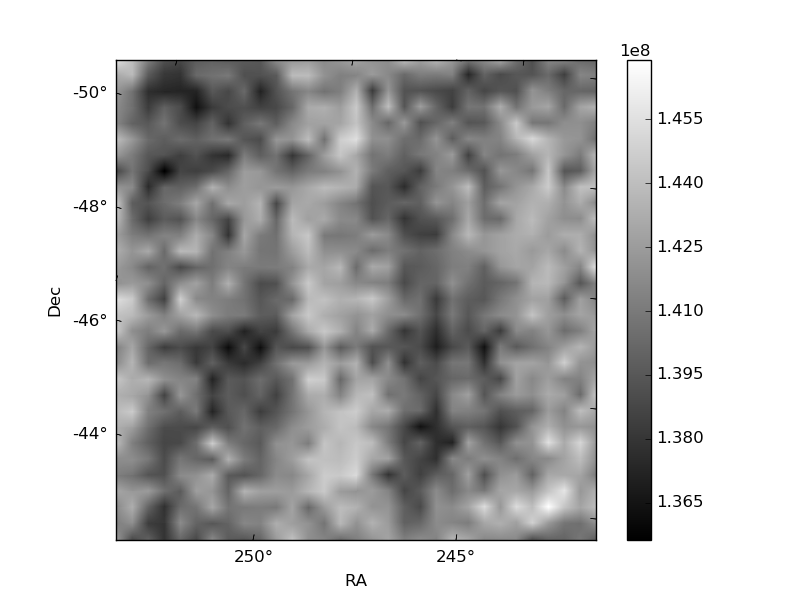
Histogram calculated using DETX and DETY for each event in the final _common_clean file
| Quadrant A | 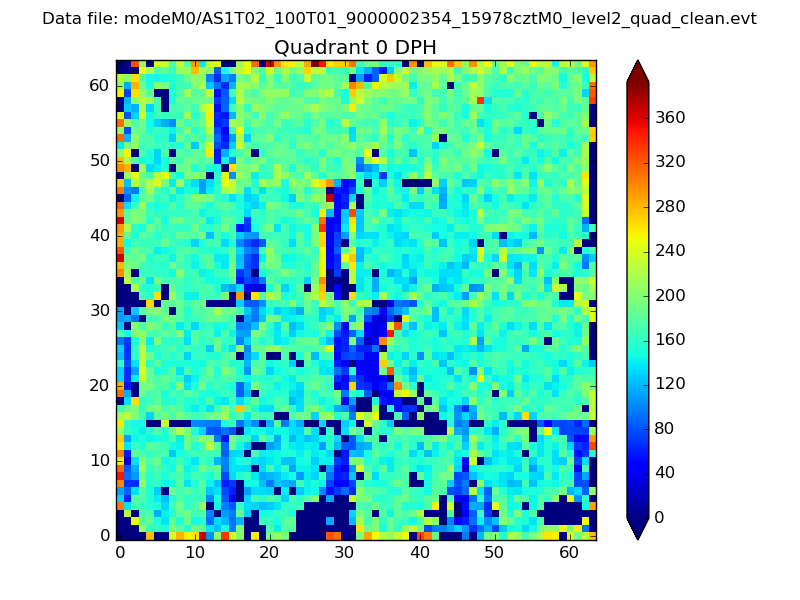 |
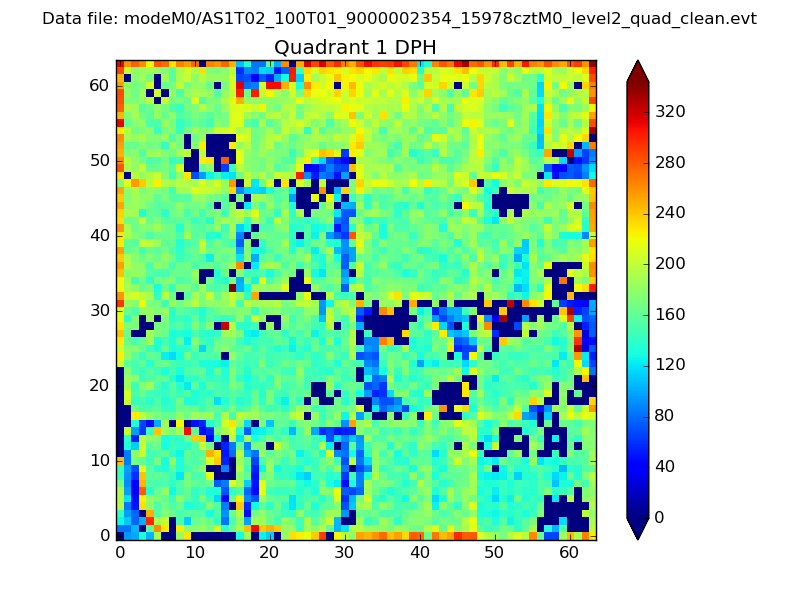 |
Quadrant B |
|---|---|---|---|
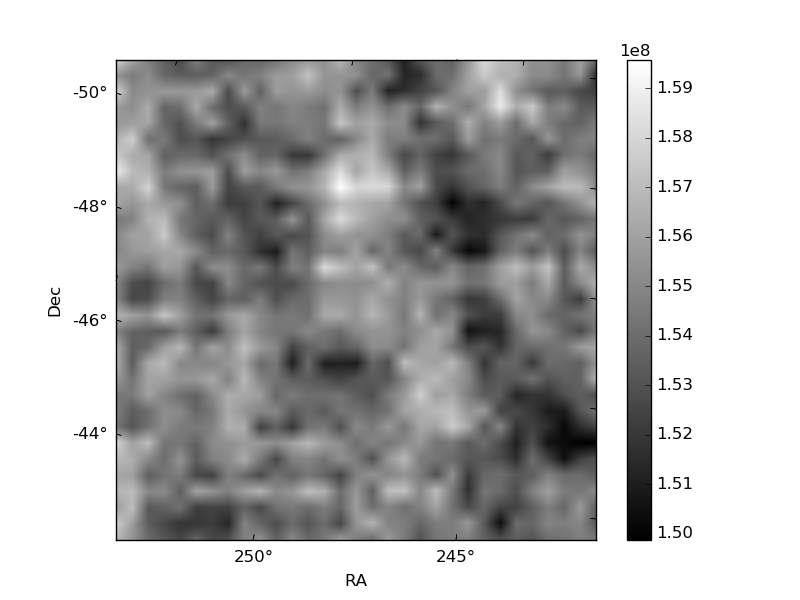
| Quadrant D | 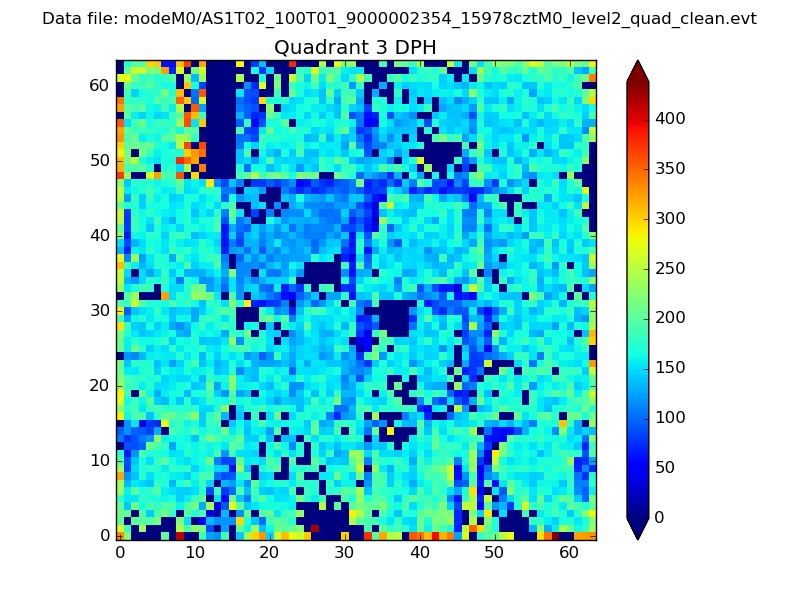 |
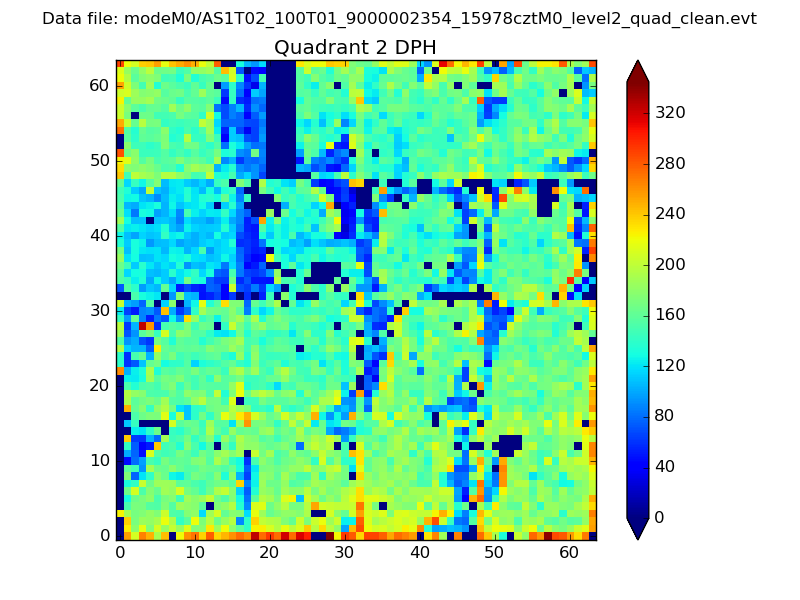 |
Quadrant C |
| Plot type | Count rate plots | Images |
|---|---|---|
| Comparison with Poisson distribution Blue bars denote a histogram of data divided into 1 sec bins. Red curve is a Poisson curve with rate = median count rate of data. |
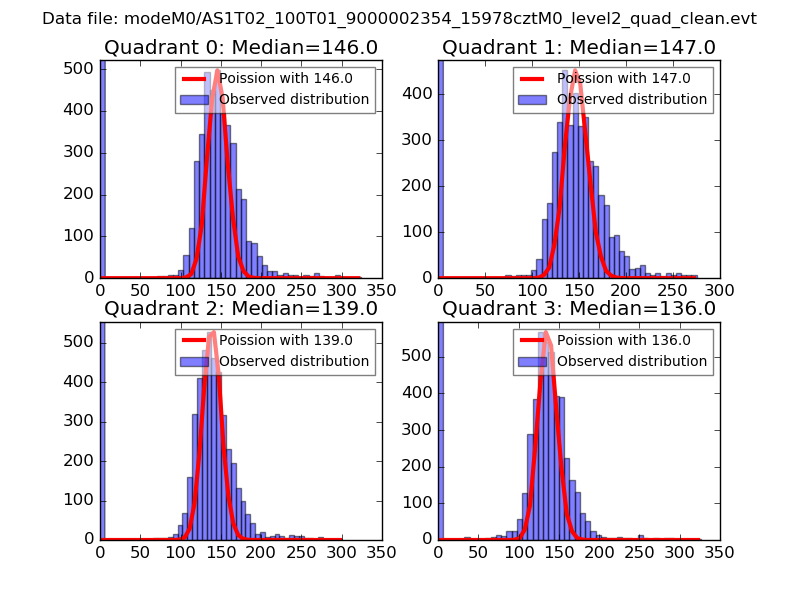 |
 |
| Quadrant-wise count rates Data is divided into 100 sec bins |
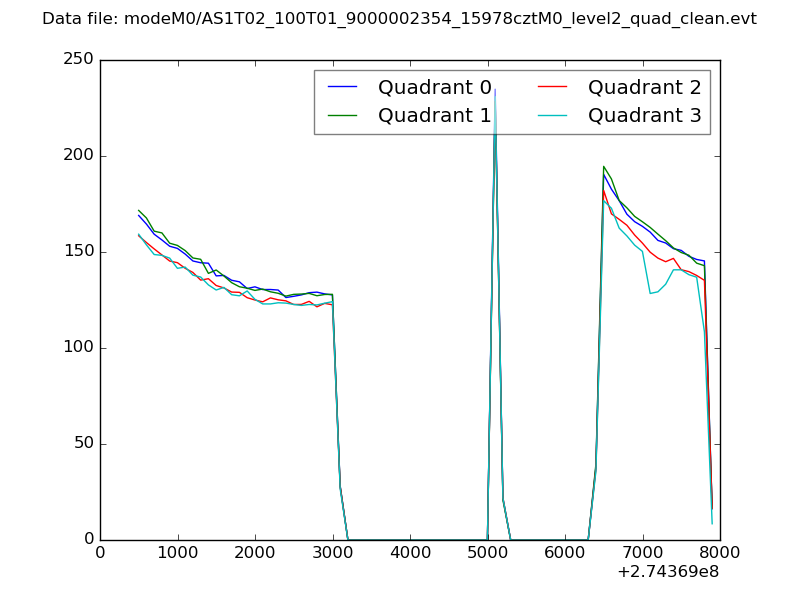 |
|
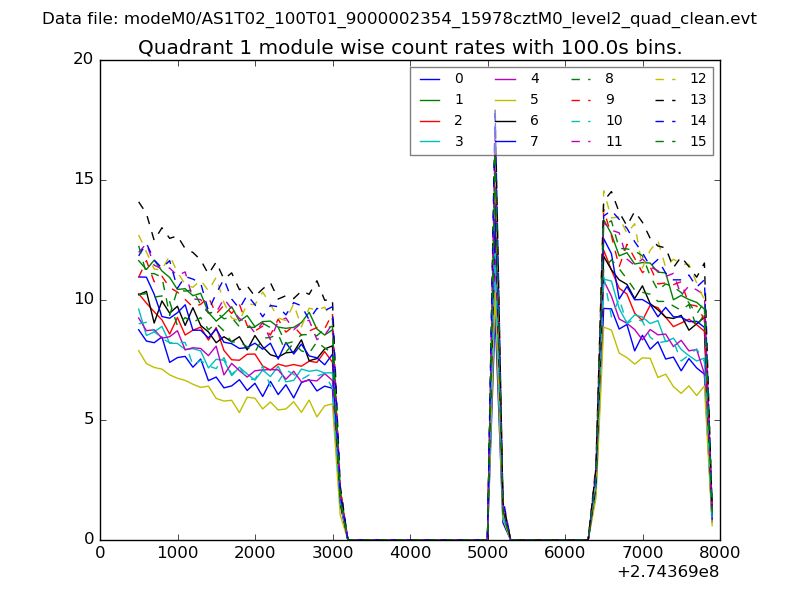
| Module-wise count rates for Quadrant A Data is divided into 100 sec bins |
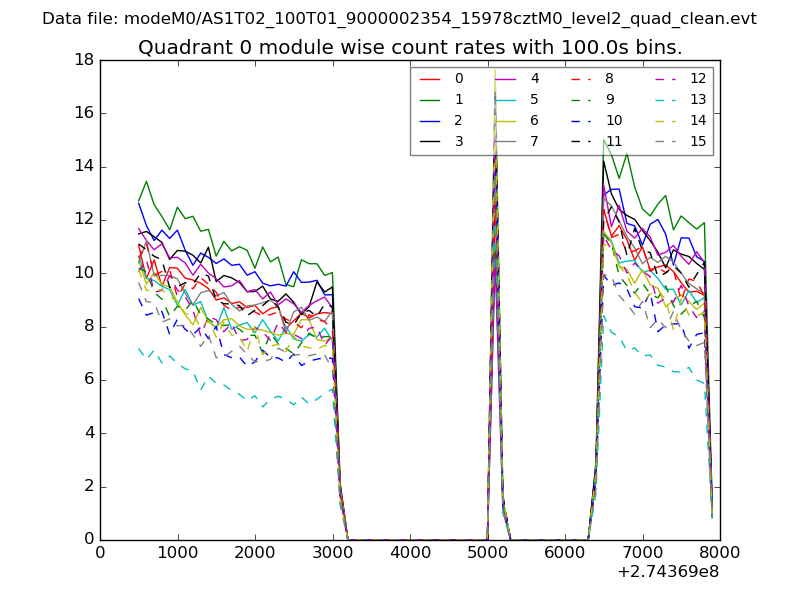 |
 |
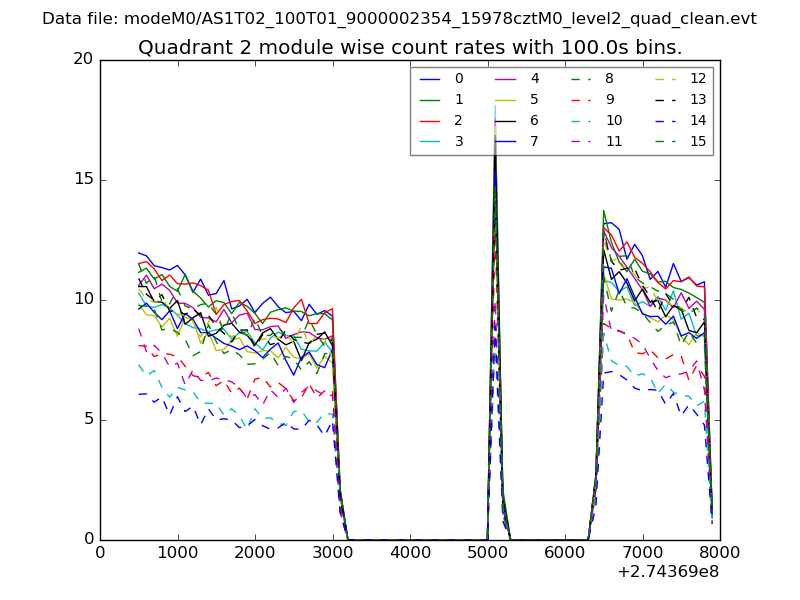
| Module-wise count rates for Quadrant B Data is divided into 100 sec bins |
 |
 |
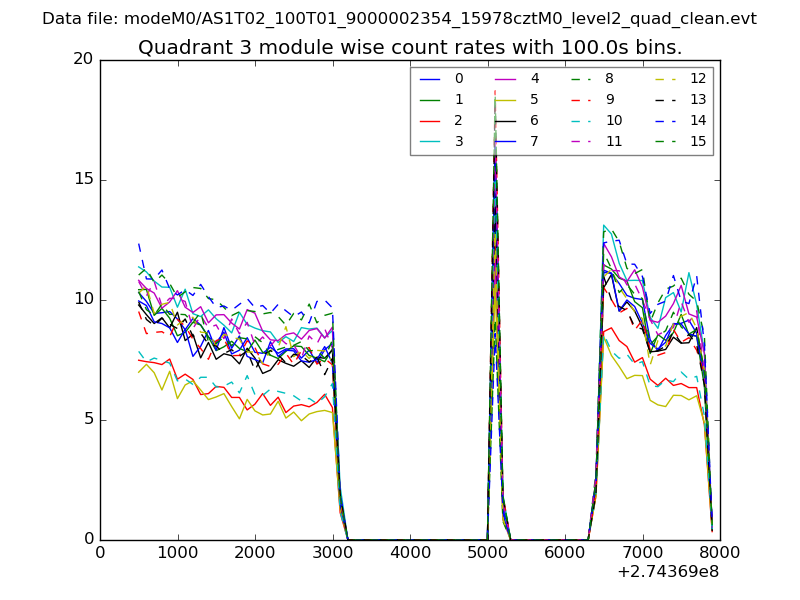
| Module-wise count rates for Quadrant C Data is divided into 100 sec bins |
 |
 |
| Module-wise count rates for Quadrant D Data is divided into 100 sec bins |
 |
 |
| Parameter | Plot |
|---|---|
| CZT HV Monitor | 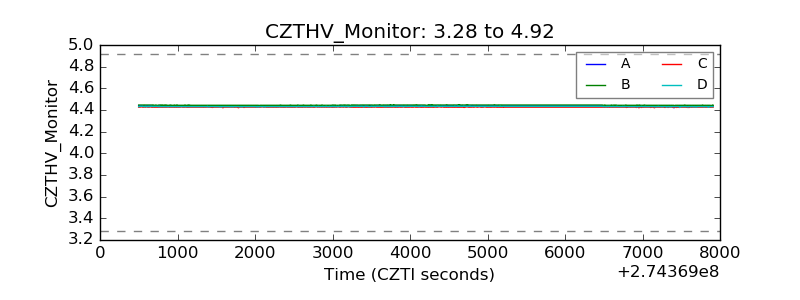 |
| D_VDD | 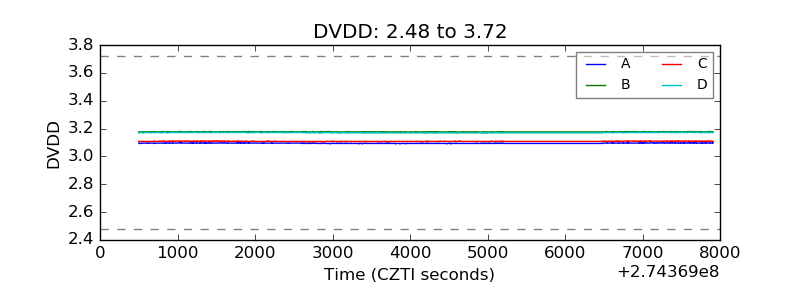 |
| Temperature 1 | 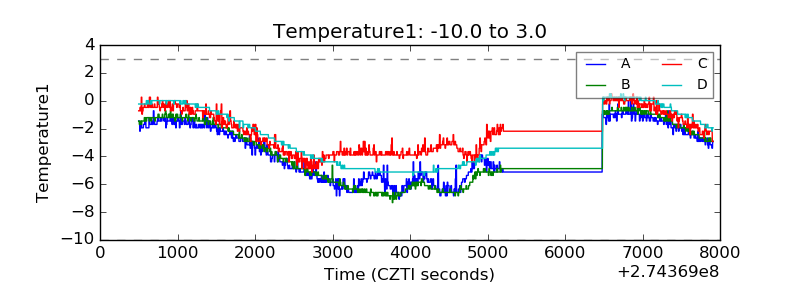 |
| Veto HV Monitor | 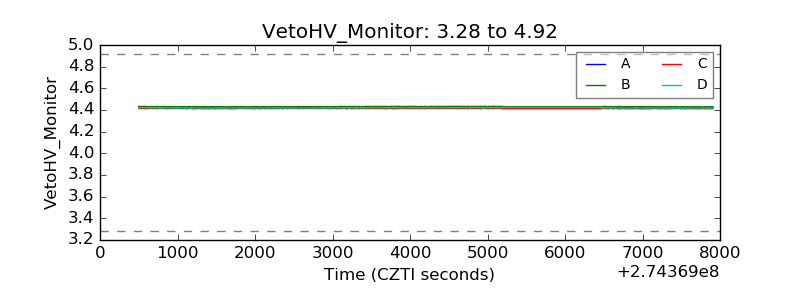 |
| Veto LLD | 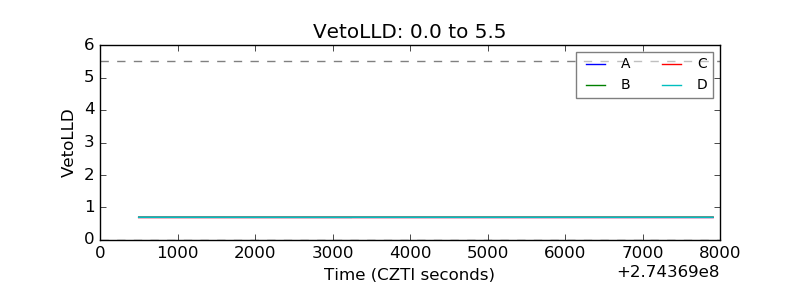 |
| Alpha Counter | 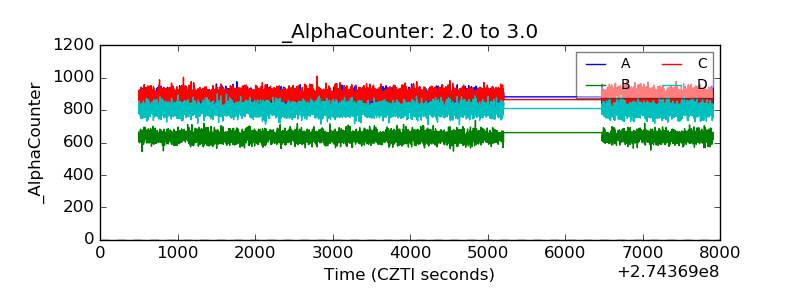 |
| _CPM_Rate | 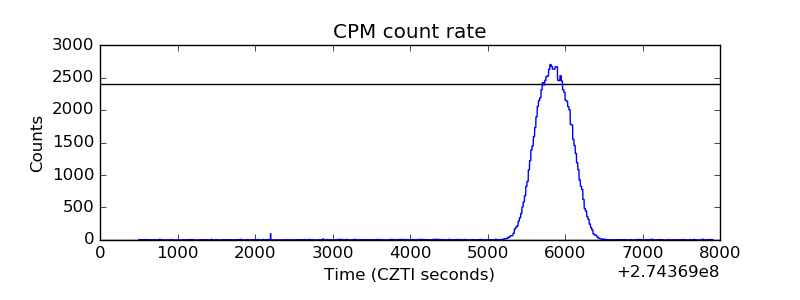 |
| CZT Counter | 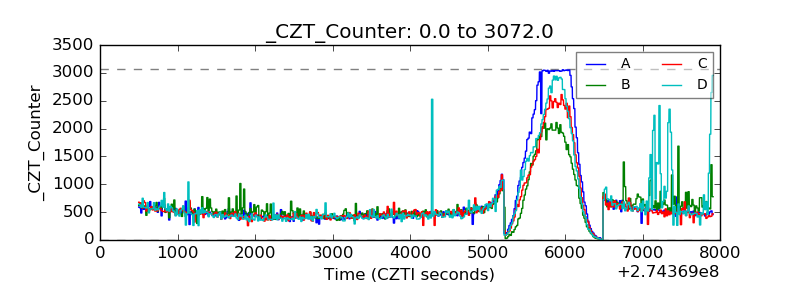 |
| +2.5 Volts monitor |  |
| +5 Volts monitor | 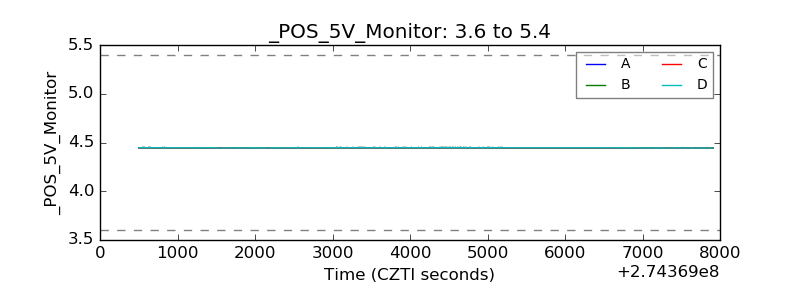 |
| _ROLL_ROT | 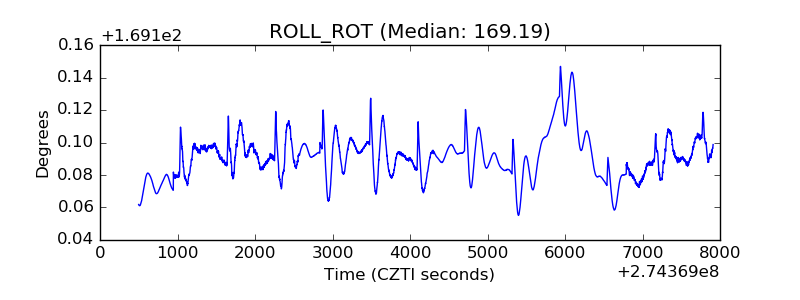 |
| _Roll_DEC | 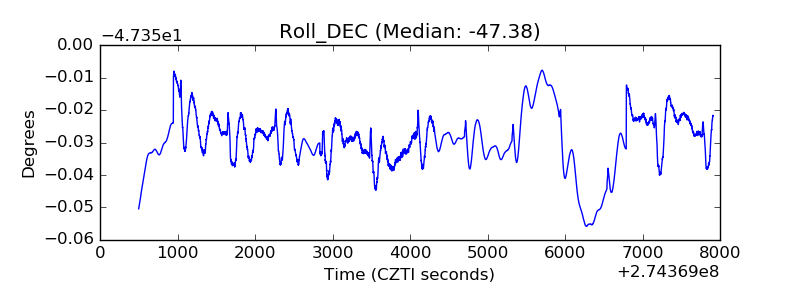 |
| _Roll_RA | 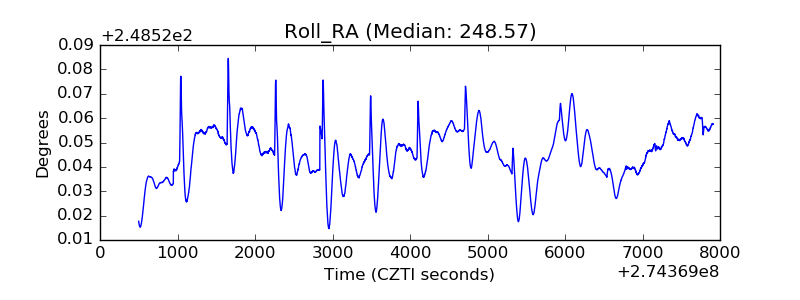 |
| Veto Counter | 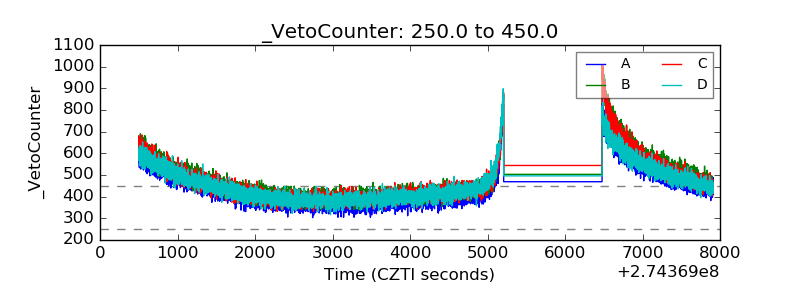 |