| Param | Original file | Final file |
|---|---|---|
| Filename | modeM0/AS1T02_100T01_9000002354_15979cztM0_level2.evt | modeM0/AS1T02_100T01_9000002354_15979cztM0_level2_quad_clean.evt |
| Size (bytes) | 431,078,400 | 88,675,200 |
| Size | 411.1 MB | 84.6 MB |
| Events in quadrant A | 2,897,099 | 585,928 |
| Events in quadrant B | 3,551,187 | 588,940 |
| Events in quadrant C | 2,897,268 | 559,501 |
| Events in quadrant D | 3,311,421 | 541,510 |
| Mode M0 | |||
|---|---|---|---|
| Quadrant | BADHDUFLAG | Total packets | Discarded packets |
| A | 0 | 12317 | 2 |
| B | 0 | 14416 | 1 |
| C | 0 | 12268 | 1 |
| D | 0 | 13814 | 1 |
| Mode SS | |||
|---|---|---|---|
| Quadrant | BADHDUFLAG | Total packets | Discarded packets |
| A | 0 | 118 | 0 |
| B | 0 | 118 | 0 |
| C | 0 | 118 | 0 |
| D | 0 | 118 | 0 |
| Mode M9 | |||
|---|---|---|---|
| Quadrant | BADHDUFLAG | Total packets | Discarded packets |
| A | 0 | 14 | 0 |
| B | 0 | 14 | 0 |
| C | 0 | 14 | 0 |
| D | 0 | 14 | 0 |
| Quadrant | Total seconds | Saturated seconds | Saturation percentage |
|---|---|---|---|
| A | 5865 | 43 | 0.733163% |
| B | 5865 | 81 | 1.381074% |
| C | 5865 | 64 | 1.091219% |
| D | 5865 | 135 | 2.301790% |
Noise dominated data is calculated using 1-second bins in cleaned event files. If a bin has >2000 counts, and if more than 50% of those come from <1% of pixels, then it is considered to be noise-dominated and hence unusable.
| Quadrant | # 1 sec bins | Bins with >0 counts | Bins with >2000 counts | High rate bins dominated by noise | Noise dominated (total time) | Noise dominated (detector-on time) | Marked lightcurve |
|---|---|---|---|---|---|---|---|
| A | 7206 | 5867 | 0 | 0 | 0.00% | 0.00% | 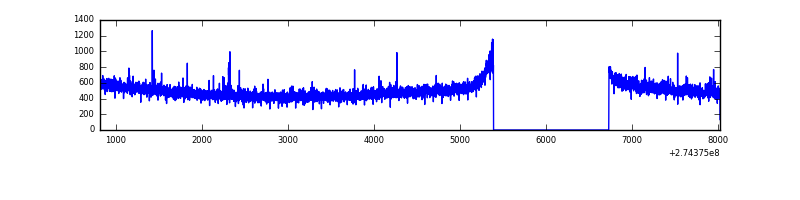 |
| B | 7206 | 5867 | 23 | 23 | 0.32% | 0.39% | 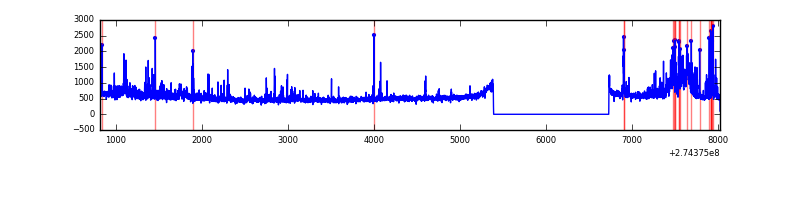 |
| C | 7206 | 5867 | 0 | 0 | 0.00% | 0.00% |  |
| D | 7206 | 5867 | 112 | 112 | 1.55% | 1.91% | 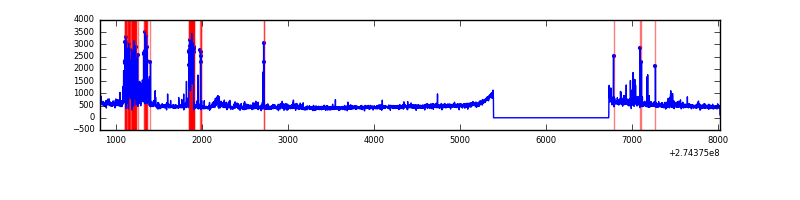 |
Top three noisy pixels from each quadrant. If the there are fewer than three noisy pixels in the level2.evt file, extra rows are filled as -1
| Pixel properties | Quadrant properties | ||||||
|---|---|---|---|---|---|---|---|
| Quadrant | DetID | PixID | Counts | Sigma | Mean | Median | Sigma |
| A | 9 | 143 | 8742 | 53.36 | 748 | 735 | 150.1 |
| A | 0 | 226 | 6742 | 40.03 | 748 | 735 | 150.1 |
| A | 12 | 194 | 5687 | 33.0 | 748 | 735 | 150.1 |
| B | 0 | 189 | 269467 | 1925.26 | 747 | 732 | 139.6 |
| B | 7 | 220 | 118431 | 843.21 | 747 | 732 | 139.6 |
| B | 0 | 190 | 55965 | 395.7 | 747 | 732 | 139.6 |
| C | 14 | 238 | 108818 | 667.08 | 699 | 705 | 162.1 |
| C | 3 | 233 | 35445 | 214.35 | 699 | 705 | 162.1 |
| C | 10 | 69 | 9253 | 52.74 | 699 | 705 | 162.1 |
| D | 12 | 218 | 299965 | 1738.3 | 708 | 687 | 172.2 |
| D | 7 | 55 | 129052 | 745.58 | 708 | 687 | 172.2 |
| D | 2 | 152 | 85262 | 491.24 | 708 | 687 | 172.2 |
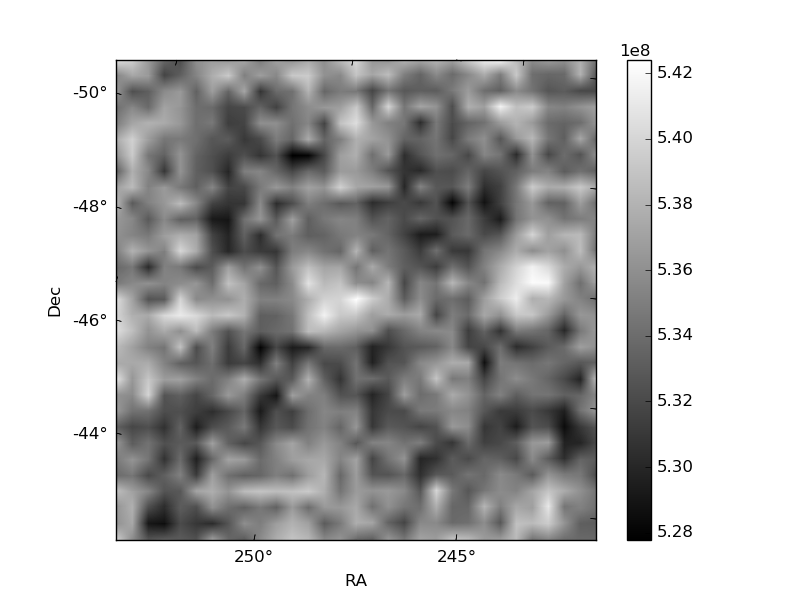
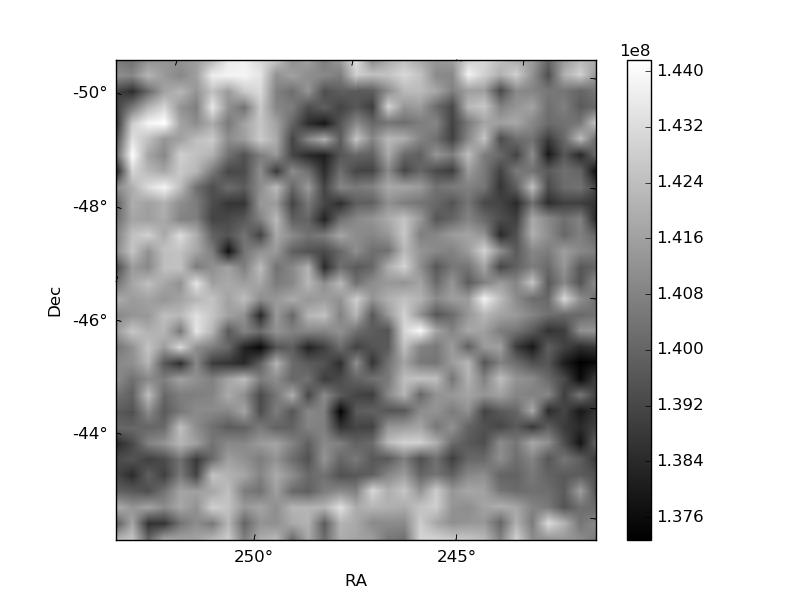
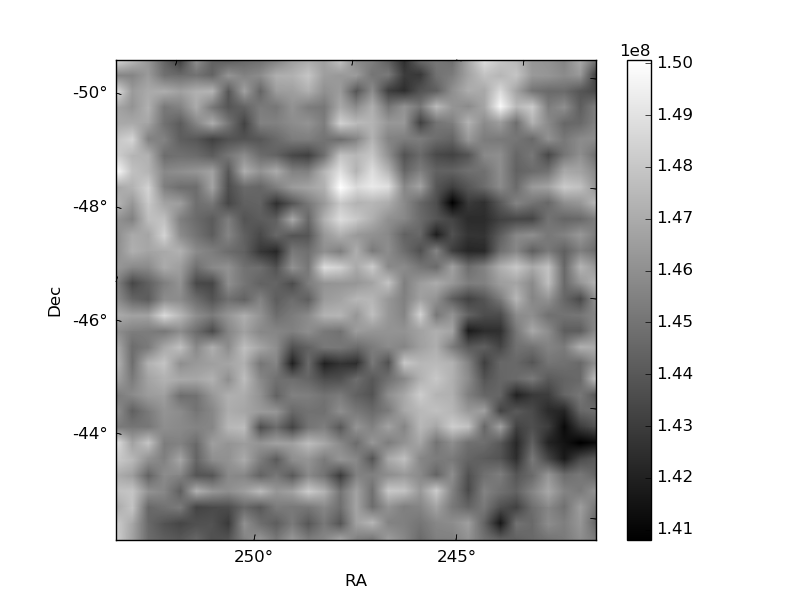
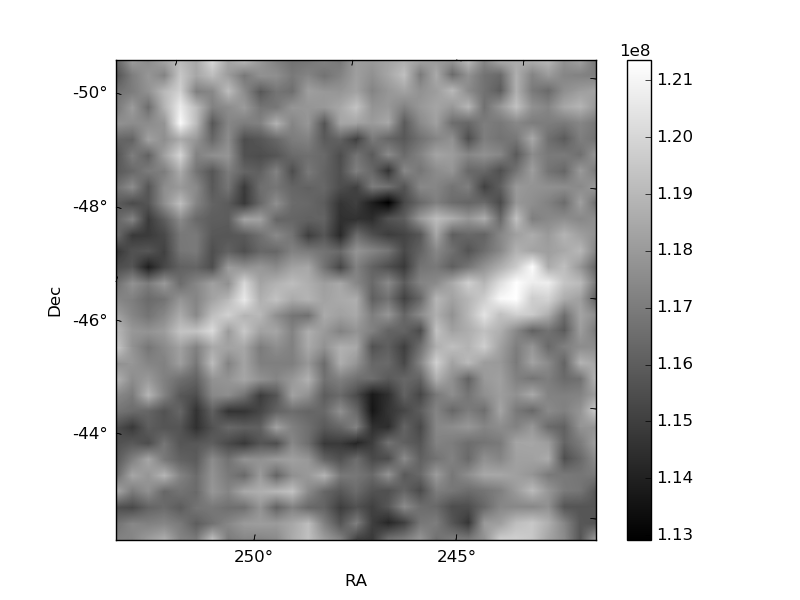
Histogram calculated using DETX and DETY for each event in the final _common_clean file
| Quadrant A | 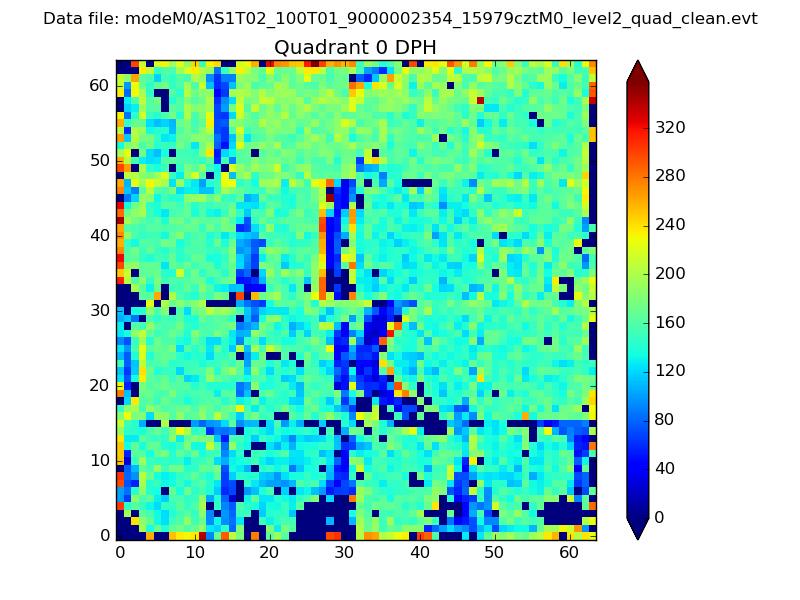 |
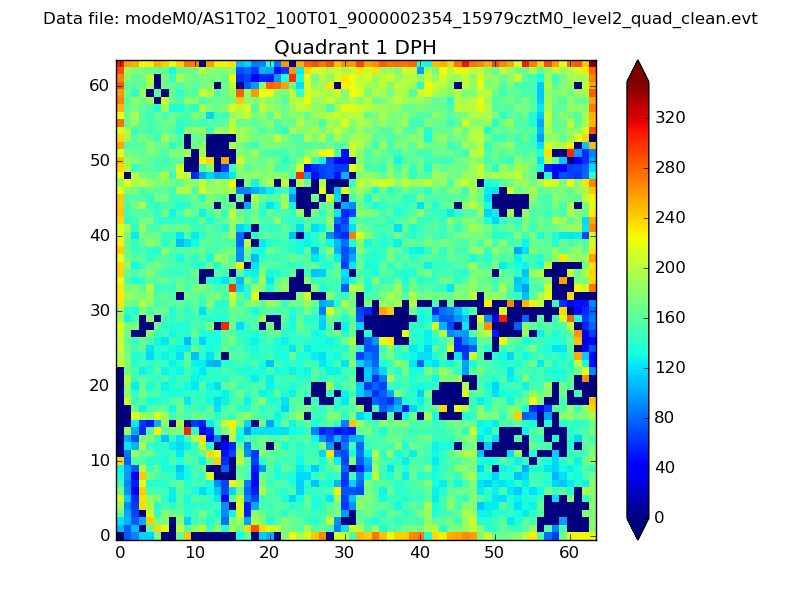 |
Quadrant B |
|---|---|---|---|
| Quadrant D | 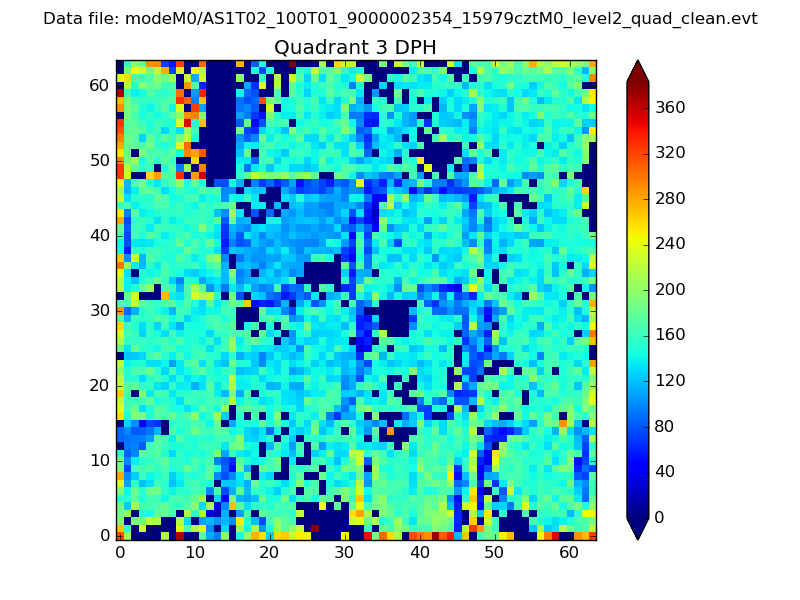 |
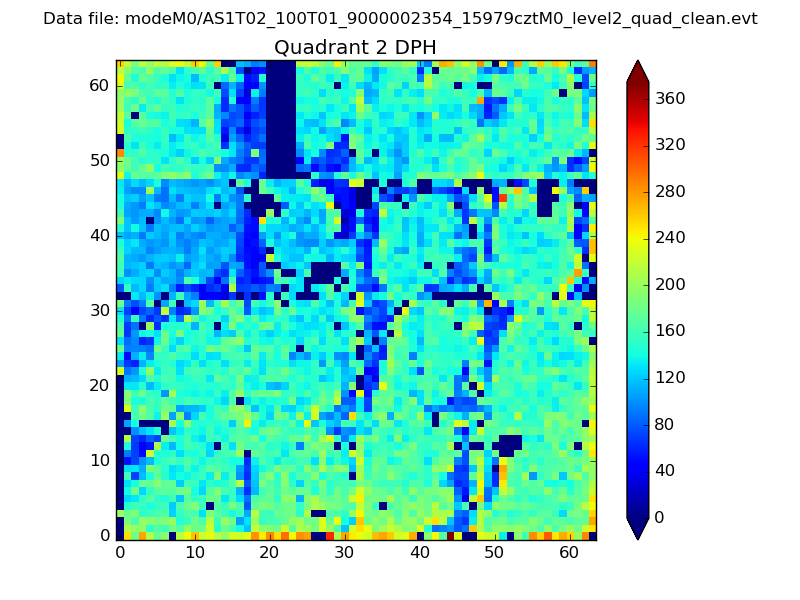 |
Quadrant C |
| Plot type | Count rate plots | Images |
|---|---|---|
| Comparison with Poisson distribution Blue bars denote a histogram of data divided into 1 sec bins. Red curve is a Poisson curve with rate = median count rate of data. |
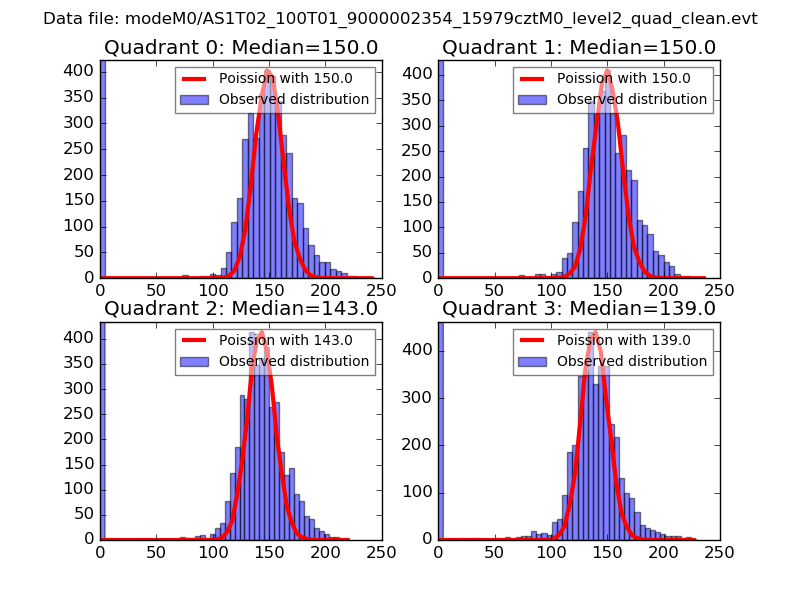 |
 |
| Quadrant-wise count rates Data is divided into 100 sec bins |
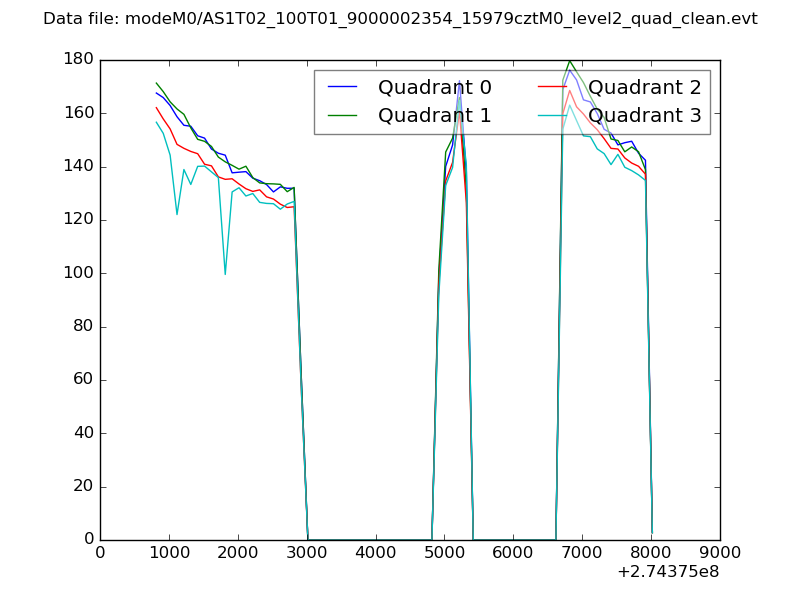 |
|
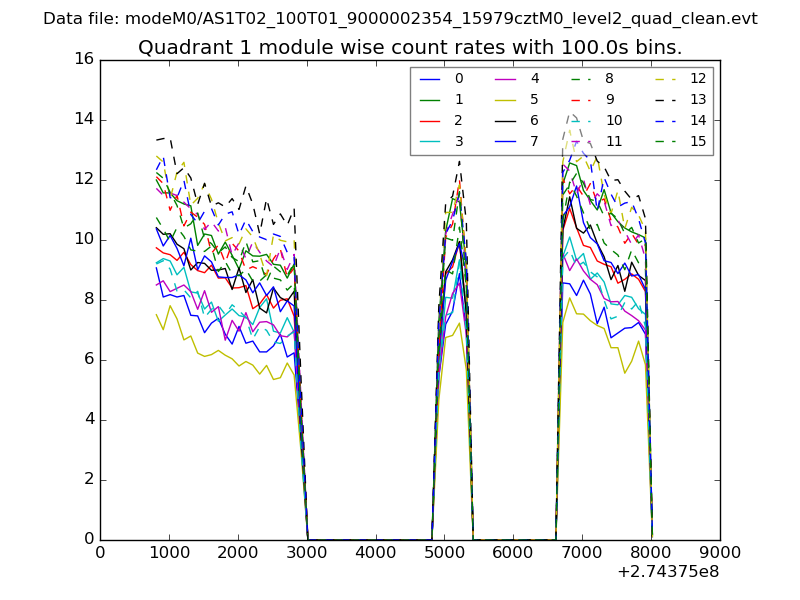
| Module-wise count rates for Quadrant A Data is divided into 100 sec bins |
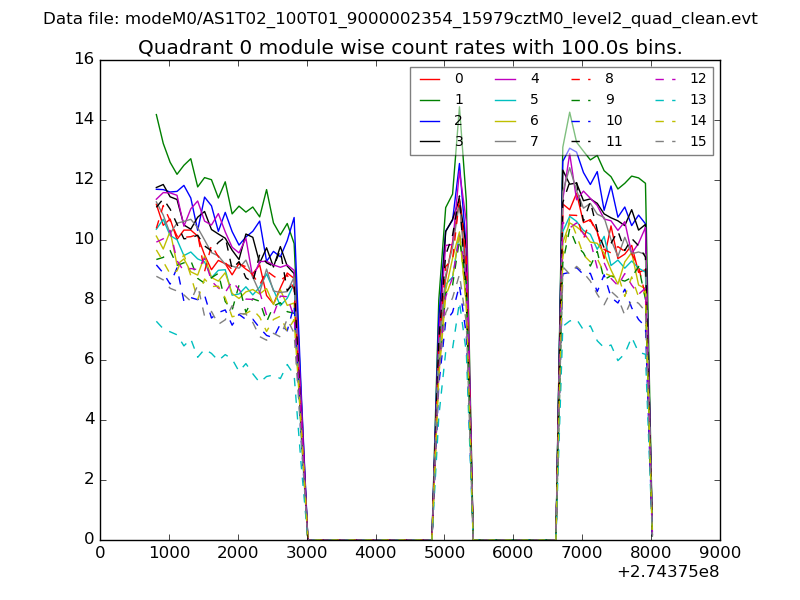 |
 |
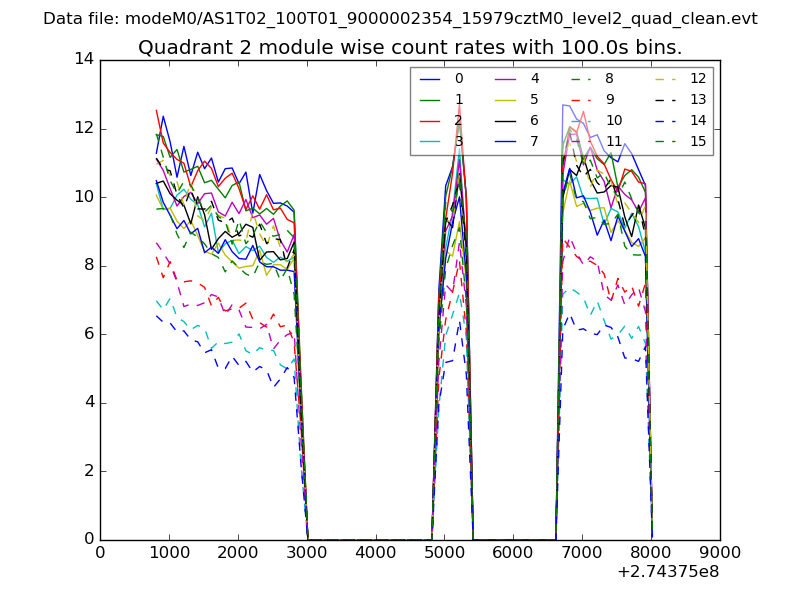
| Module-wise count rates for Quadrant B Data is divided into 100 sec bins |
 |
 |
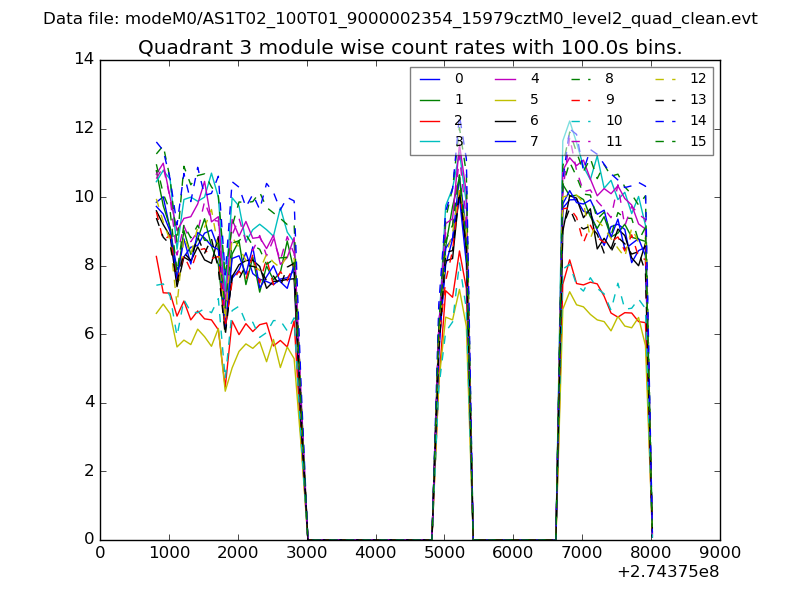
| Module-wise count rates for Quadrant C Data is divided into 100 sec bins |
 |
 |
| Module-wise count rates for Quadrant D Data is divided into 100 sec bins |
 |
 |
| Parameter | Plot |
|---|---|
| CZT HV Monitor | 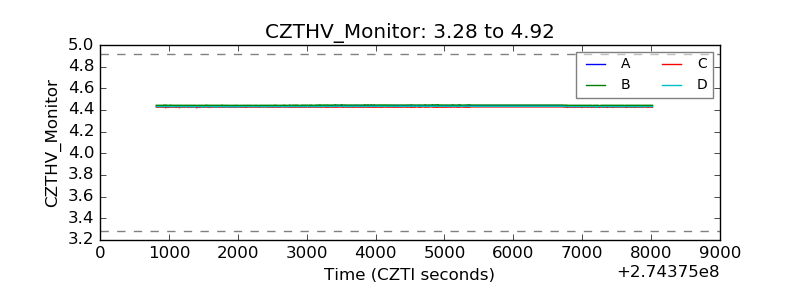 |
| D_VDD | 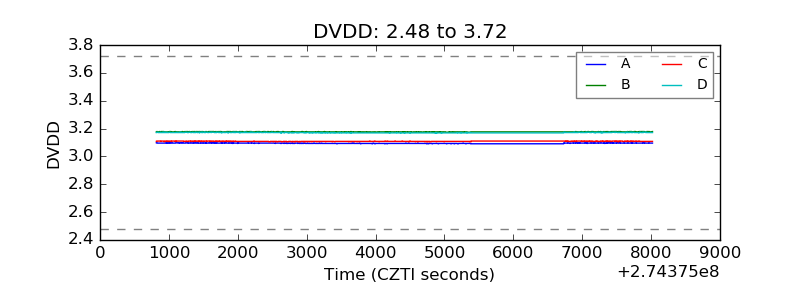 |
| Temperature 1 | 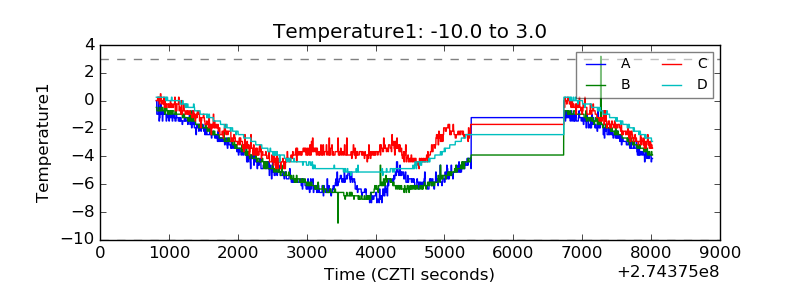 |
| Veto HV Monitor | 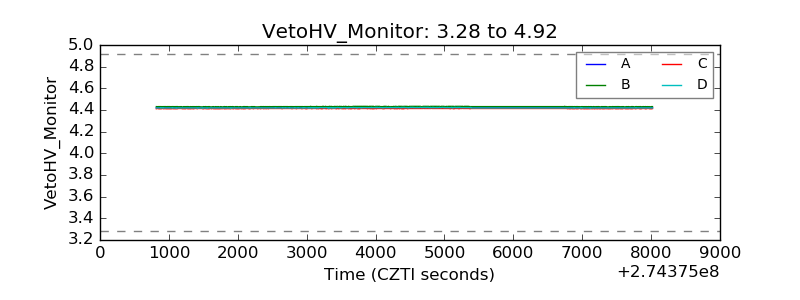 |
| Veto LLD | 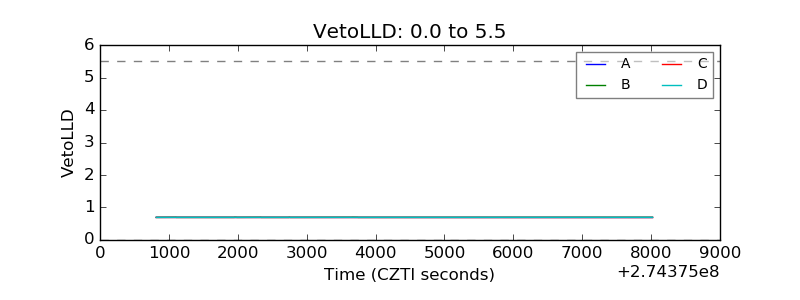 |
| Alpha Counter | 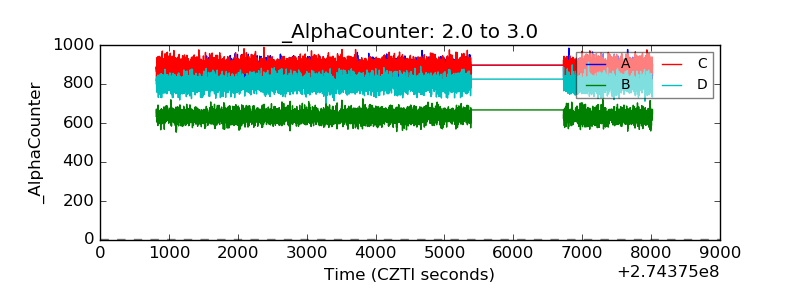 |
| _CPM_Rate | 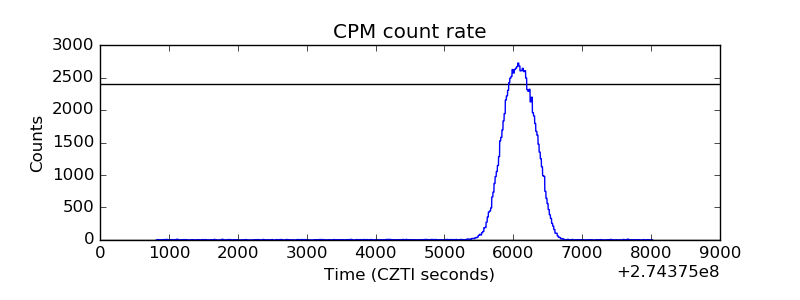 |
| CZT Counter | 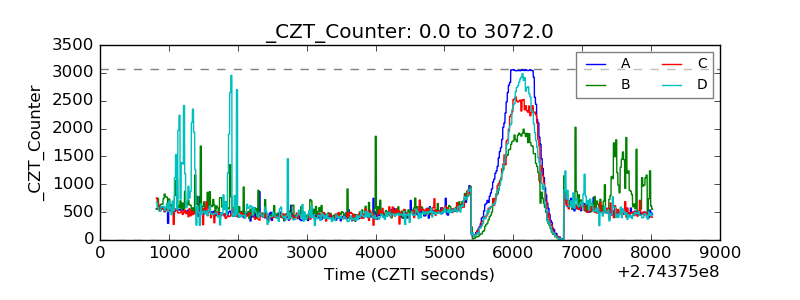 |
| +2.5 Volts monitor | 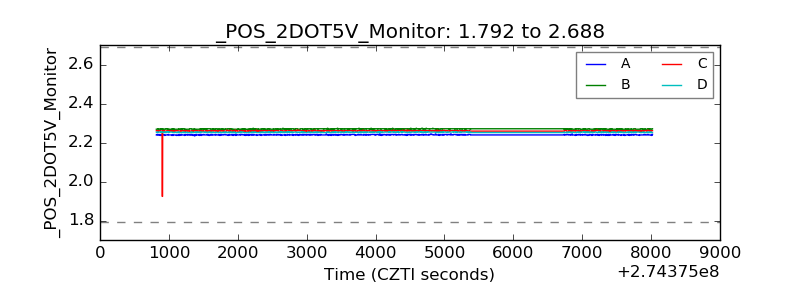 |
| +5 Volts monitor |  |
| _ROLL_ROT | 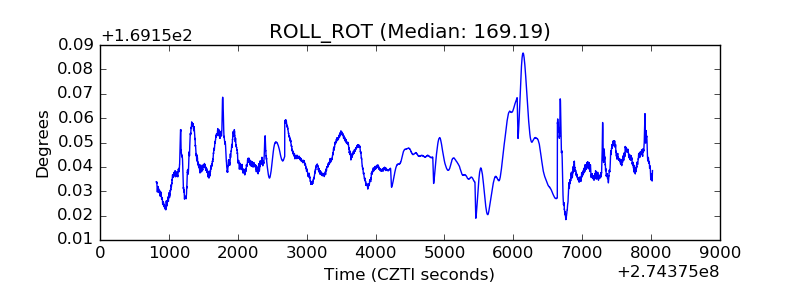 |
| _Roll_DEC | 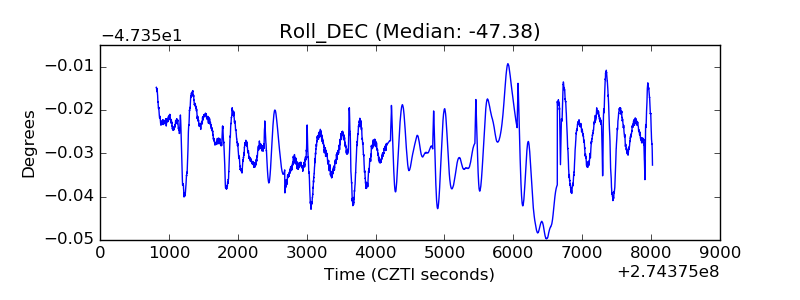 |
| _Roll_RA | 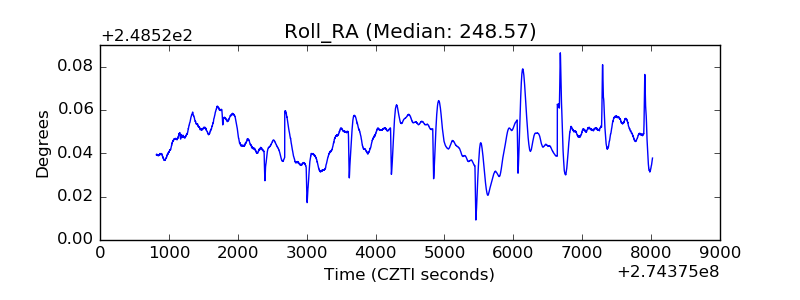 |
| Veto Counter | 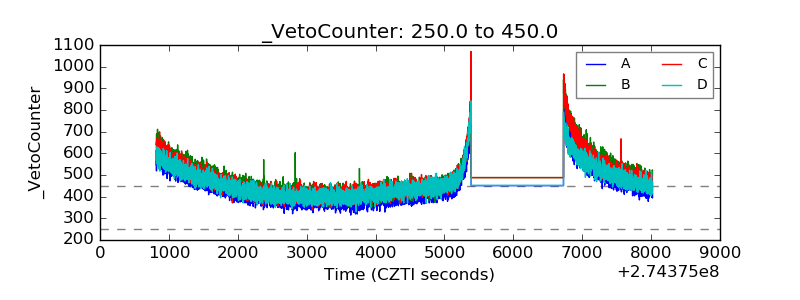 |