| Param | Original file | Final file |
|---|---|---|
| Filename | modeM0/AS1T02_100T01_9000002354_15980cztM0_level2.evt | modeM0/AS1T02_100T01_9000002354_15980cztM0_level2_quad_clean.evt |
| Size (bytes) | 137,537,280 | 39,617,280 |
| Size | 131.2 MB | 37.8 MB |
| Events in quadrant A | 917,817 | 273,048 |
| Events in quadrant B | 1,285,675 | 276,479 |
| Events in quadrant C | 900,310 | 263,417 |
| Events in quadrant D | 937,247 | 255,483 |
| Mode M0 | |||
|---|---|---|---|
| Quadrant | BADHDUFLAG | Total packets | Discarded packets |
| A | 0 | 3828 | 1 |
| B | 0 | 5063 | 1 |
| C | 0 | 3815 | 1 |
| D | 0 | 3999 | 1 |
| Mode SS | |||
|---|---|---|---|
| Quadrant | BADHDUFLAG | Total packets | Discarded packets |
| A | 0 | 36 | 0 |
| B | 0 | 36 | 0 |
| C | 0 | 36 | 0 |
| D | 0 | 36 | 0 |
| Mode M9 | |||
|---|---|---|---|
| Quadrant | BADHDUFLAG | Total packets | Discarded packets |
| A | 0 | 4 | 0 |
| B | 0 | 4 | 0 |
| C | 0 | 4 | 0 |
| D | 0 | 5 | 0 |
| Quadrant | Total seconds | Saturated seconds | Saturation percentage |
|---|---|---|---|
| A | 1789 | 2 | 0.111794% |
| B | 1789 | 33 | 1.844606% |
| C | 1789 | 3 | 0.167691% |
| D | 1789 | 4 | 0.223589% |
Noise dominated data is calculated using 1-second bins in cleaned event files. If a bin has >2000 counts, and if more than 50% of those come from <1% of pixels, then it is considered to be noise-dominated and hence unusable.
| Quadrant | # 1 sec bins | Bins with >0 counts | Bins with >2000 counts | High rate bins dominated by noise | Noise dominated (total time) | Noise dominated (detector-on time) | Marked lightcurve |
|---|---|---|---|---|---|---|---|
| A | 1790 | 1790 | 0 | 0 | 0.00% | 0.00% |  |
| B | 1790 | 1790 | 19 | 19 | 1.06% | 1.06% |  |
| C | 1790 | 1790 | 0 | 0 | 0.00% | 0.00% |  |
| D | 1790 | 1790 | 4 | 4 | 0.22% | 0.22% | 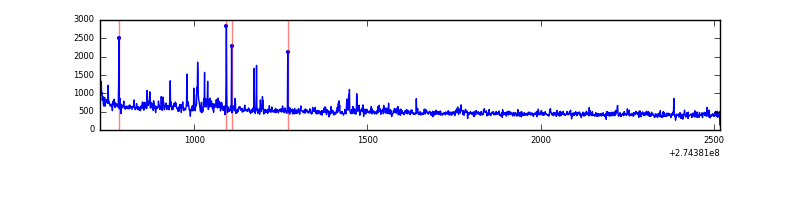 |
Top three noisy pixels from each quadrant. If the there are fewer than three noisy pixels in the level2.evt file, extra rows are filled as -1
| Pixel properties | Quadrant properties | ||||||
|---|---|---|---|---|---|---|---|
| Quadrant | DetID | PixID | Counts | Sigma | Mean | Median | Sigma |
| A | 15 | 239 | 4902 | 96.89 | 235 | 232 | 48.2 |
| A | 13 | 248 | 3374 | 65.18 | 235 | 232 | 48.2 |
| A | 9 | 143 | 2846 | 54.23 | 235 | 232 | 48.2 |
| B | 0 | 189 | 215836 | 4766.77 | 233 | 229 | 45.2 |
| B | 7 | 220 | 56831 | 1251.39 | 233 | 229 | 45.2 |
| B | 0 | 190 | 30097 | 660.34 | 233 | 229 | 45.2 |
| C | 14 | 238 | 33359 | 640.82 | 217 | 219 | 51.7 |
| C | 3 | 233 | 13255 | 252.07 | 217 | 219 | 51.7 |
| C | 0 | 207 | 3853 | 70.27 | 217 | 219 | 51.7 |
| D | 2 | 152 | 43591 | 781.21 | 220 | 214 | 55.5 |
| D | 12 | 218 | 34053 | 609.43 | 220 | 214 | 55.5 |
| D | 2 | 234 | 8962 | 157.55 | 220 | 214 | 55.5 |
Histogram calculated using DETX and DETY for each event in the final _common_clean file
| Quadrant A | 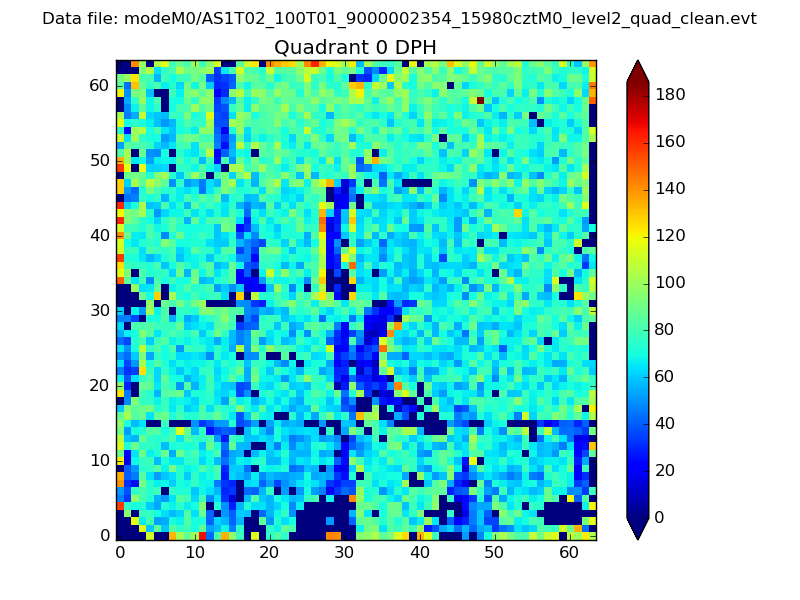 |
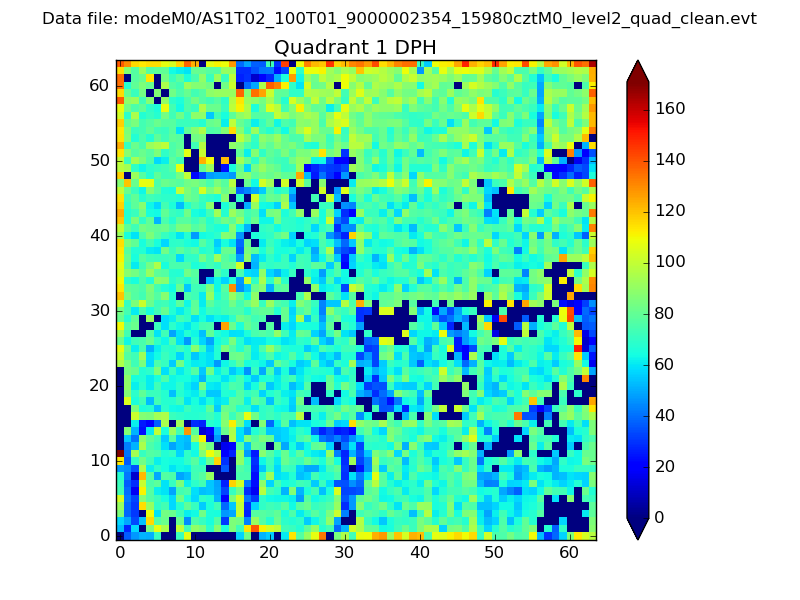 |
Quadrant B |
|---|---|---|---|
| Quadrant D | 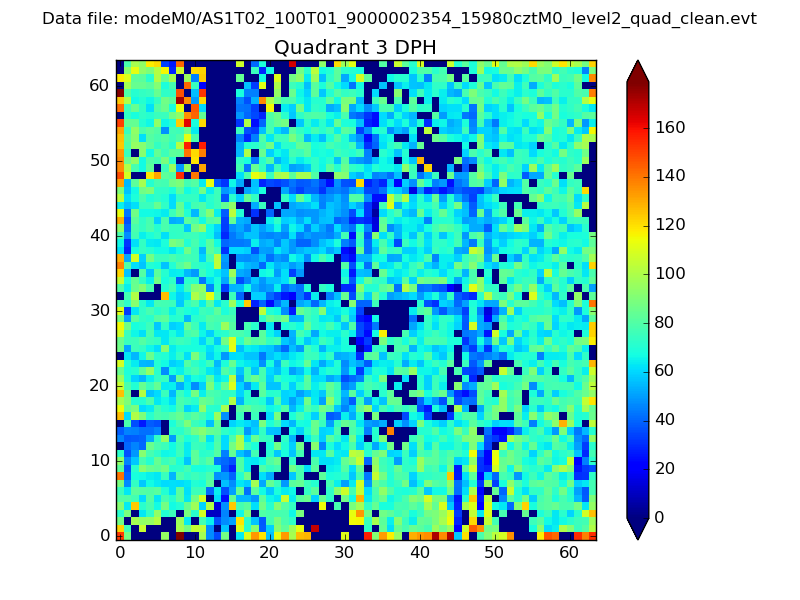 |
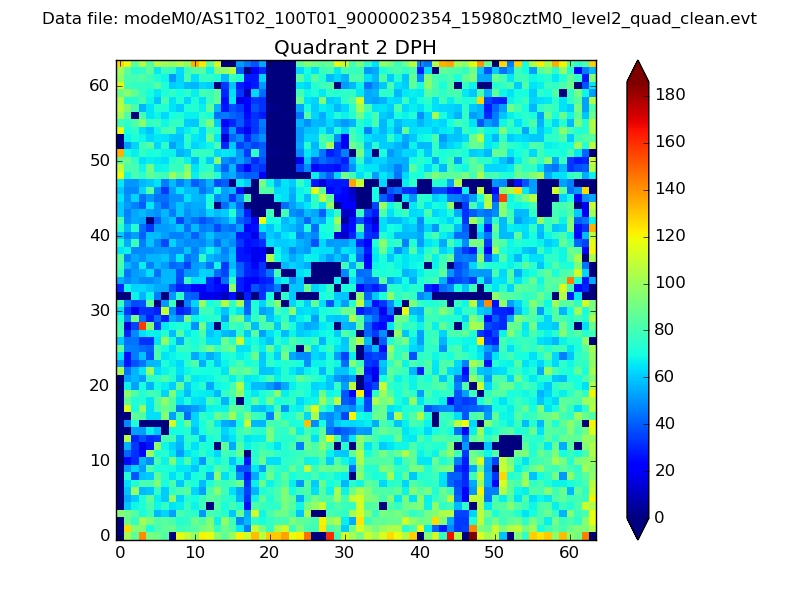 |
Quadrant C |
| Plot type | Count rate plots | Images |
|---|---|---|
| Comparison with Poisson distribution Blue bars denote a histogram of data divided into 1 sec bins. Red curve is a Poisson curve with rate = median count rate of data. |
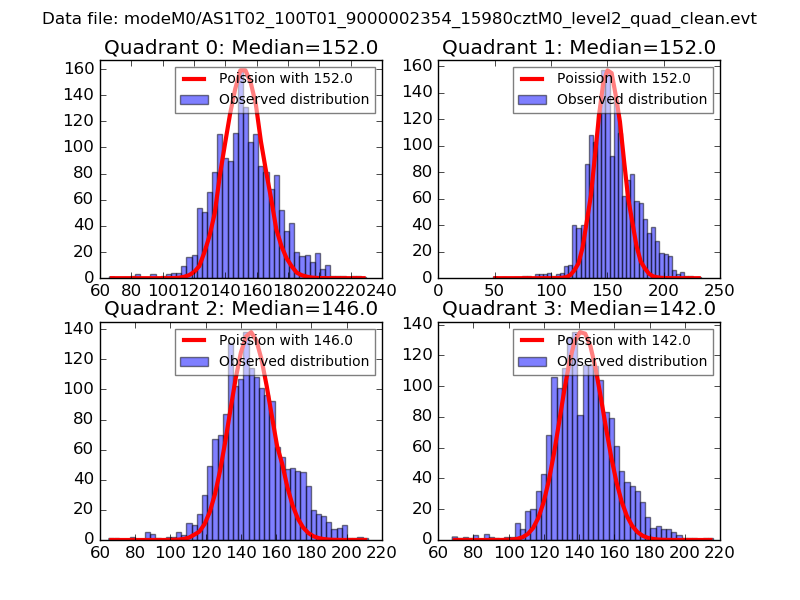 |
 |
| Quadrant-wise count rates Data is divided into 100 sec bins |
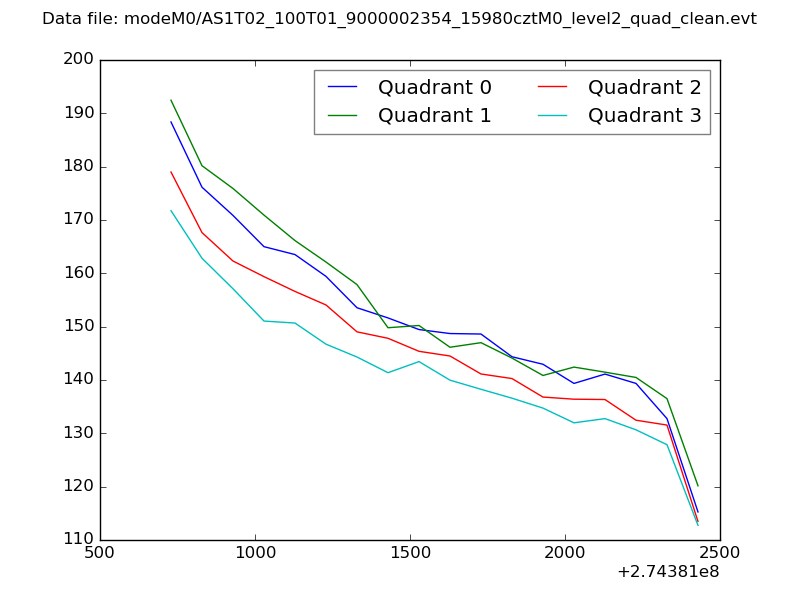 |
|
| Module-wise count rates for Quadrant A Data is divided into 100 sec bins |
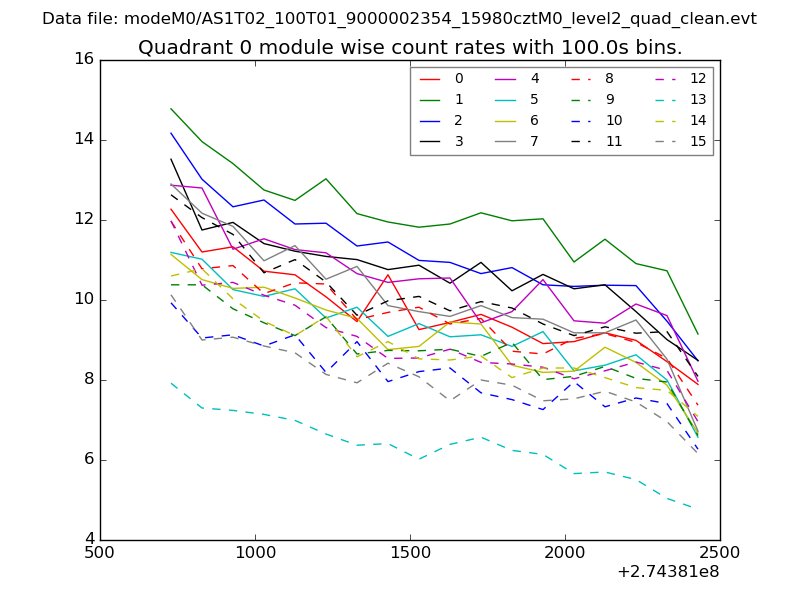 |
 |
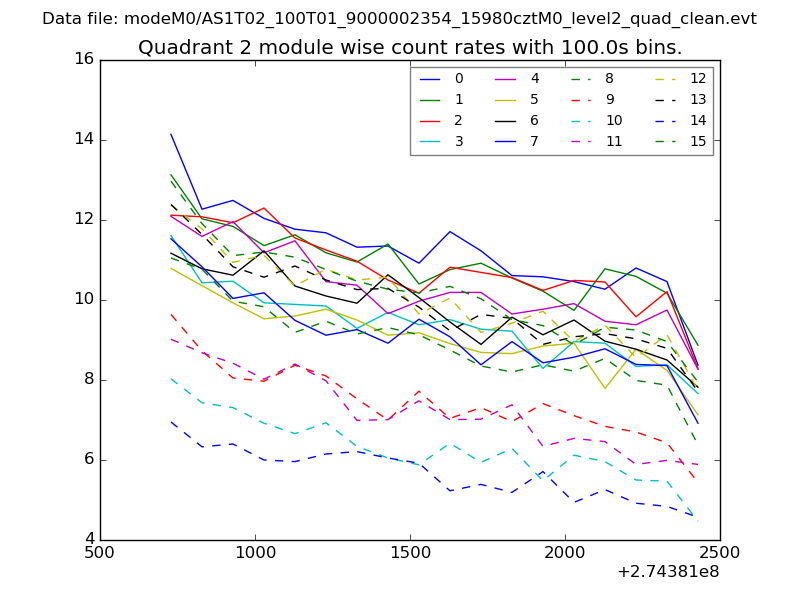
| Module-wise count rates for Quadrant B Data is divided into 100 sec bins |
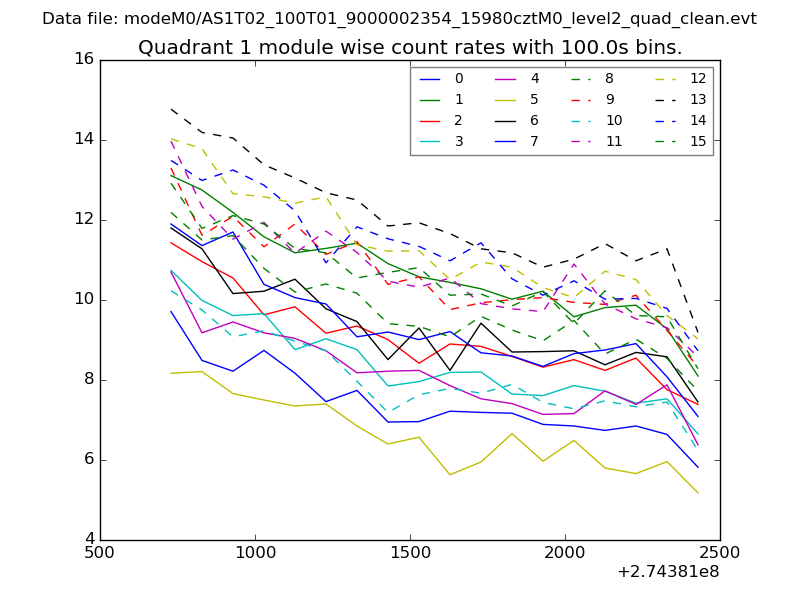 |
 |
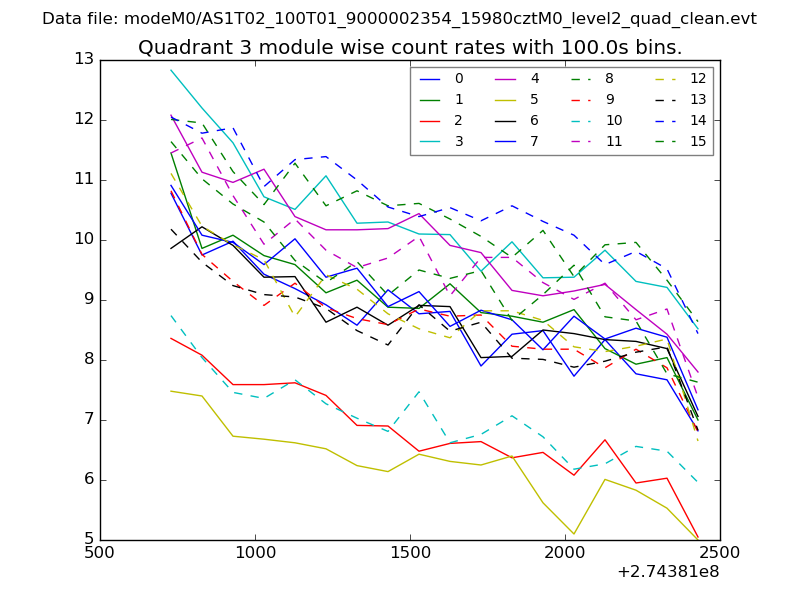
| Module-wise count rates for Quadrant C Data is divided into 100 sec bins |
 |
 |
| Module-wise count rates for Quadrant D Data is divided into 100 sec bins |
 |
 |
| Parameter | Plot |
|---|---|
| CZT HV Monitor | 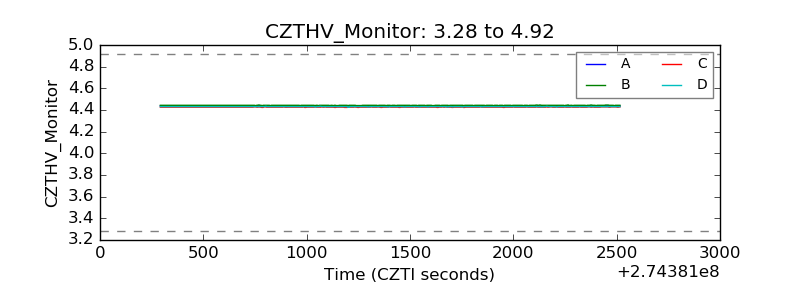 |
| D_VDD | 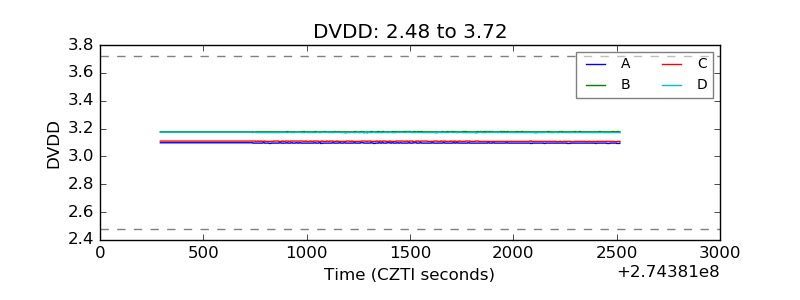 |
| Temperature 1 | 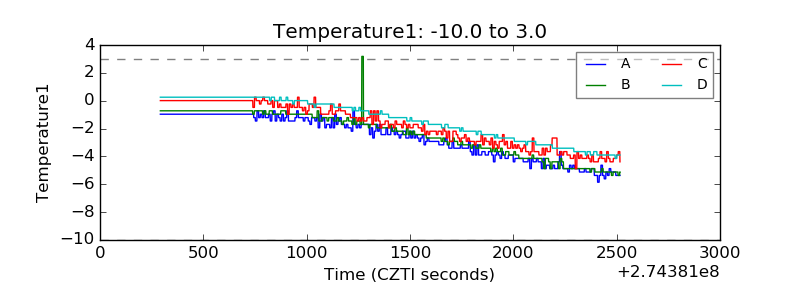 |
| Veto HV Monitor | 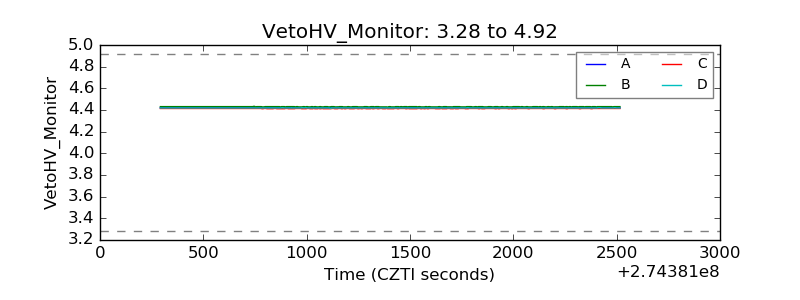 |
| Veto LLD | 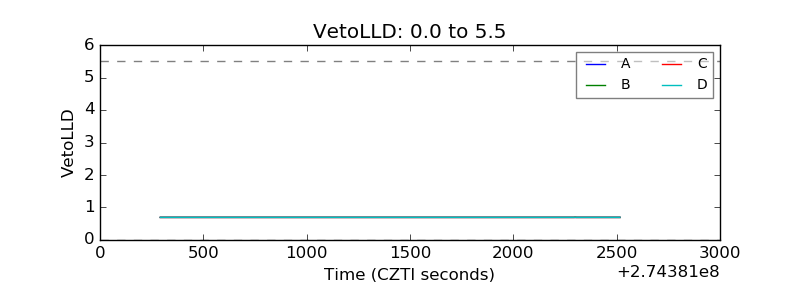 |
| Alpha Counter | 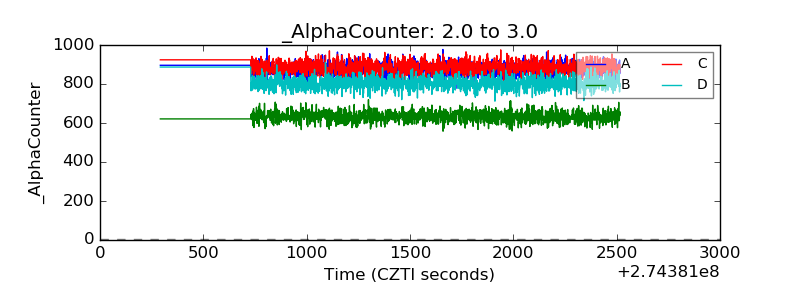 |
| _CPM_Rate | 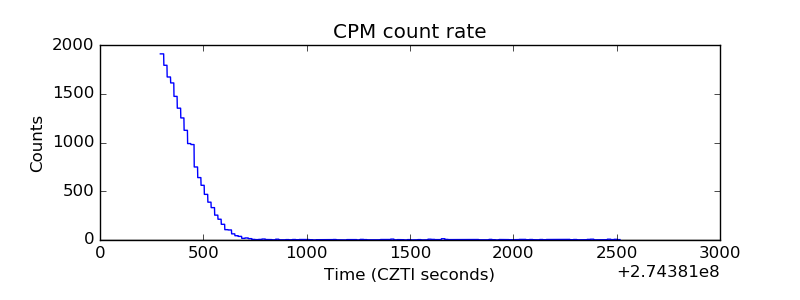 |
| CZT Counter | 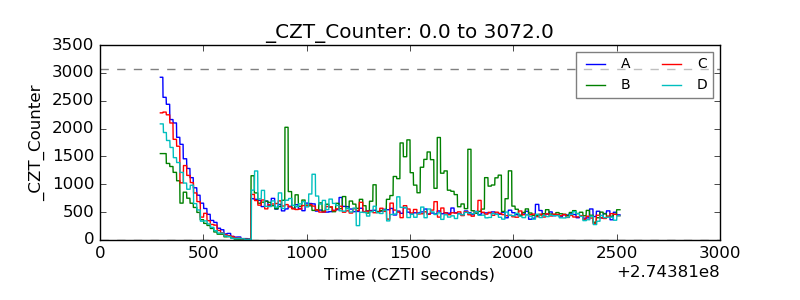 |
| +2.5 Volts monitor |  |
| +5 Volts monitor |  |
| _ROLL_ROT | 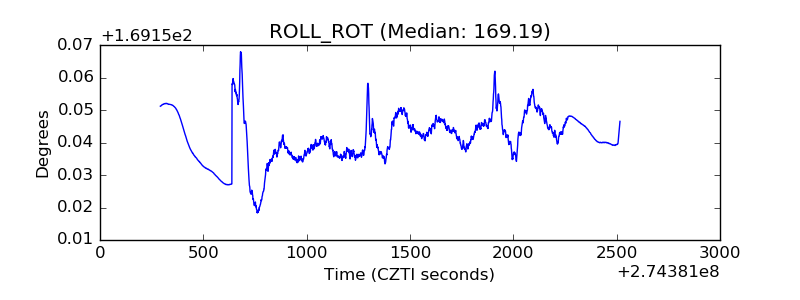 |
| _Roll_DEC | 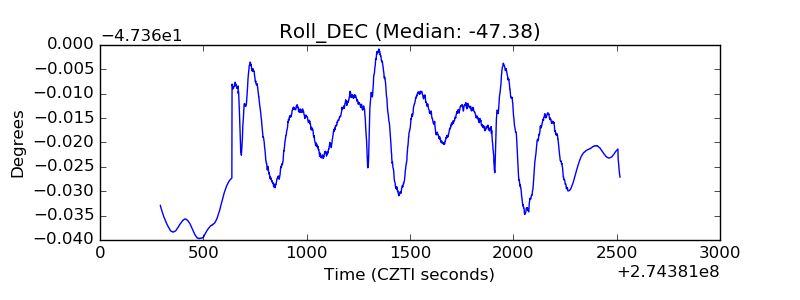 |
| _Roll_RA | 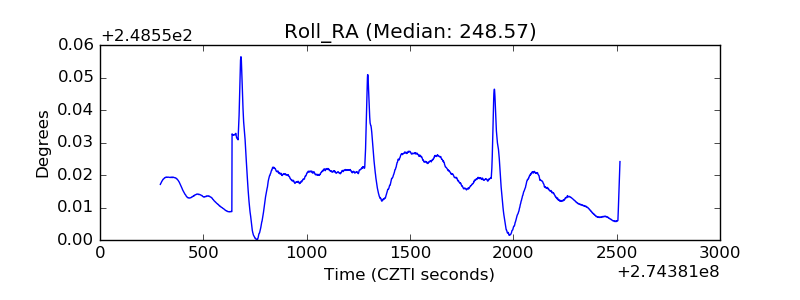 |
| Veto Counter | 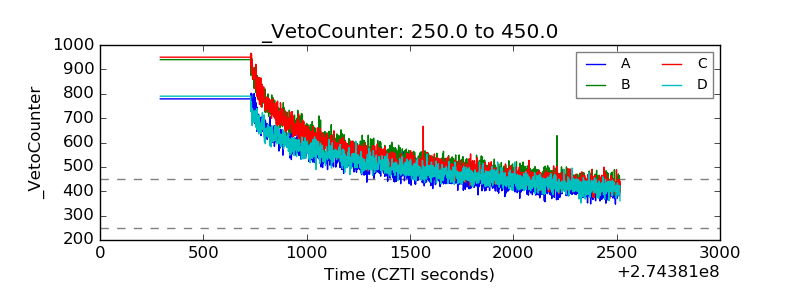 |