| Param | Original file | Final file |
|---|---|---|
| Filename | modeM0/AS1T02_104T01_9000002356cztM0_level2.fits | modeM0/AS1T02_104T01_9000002356cztM0_level2_quad_clean.evt |
| Size (bytes) | 237,911,040 | 228,674,880 |
| Size | 226.9 MB | 218.1 MB |
| Events in quadrant A | 1,444,984 | 1,335,572 |
| Events in quadrant B | 1,396,072 | 1,359,670 |
| Events in quadrant C | 1,415,090 | 1,307,567 |
| Events in quadrant D | 1,236,968 | 1,209,877 |
| Mode SS | |||
|---|---|---|---|
| Quadrant | BADHDUFLAG | Total packets | Discarded packets |
| A | 0 | 508 | 0 |
| B | 0 | 508 | 0 |
| C | 0 | 508 | 0 |
| D | 0 | 508 | 0 |
| Mode M0 | |||
|---|---|---|---|
| Quadrant | BADHDUFLAG | Total packets | Discarded packets |
| A | 0 | 52594 | 0 |
| B | 0 | 53242 | 0 |
| C | 0 | 52578 | 0 |
| D | 0 | 54838 | 0 |
| Mode M9 | |||
|---|---|---|---|
| Quadrant | BADHDUFLAG | Total packets | Discarded packets |
| A | 0 | 42 | 0 |
| B | 0 | 42 | 0 |
| C | 0 | 42 | 0 |
| D | 0 | 42 | 0 |
| Quadrant | Total seconds | Saturated seconds | Saturation percentage |
|---|---|---|---|
| A | 24888 | 275 | 1.104950% |
| B | 24888 | 335 | 1.346030% |
| C | 24888 | 414 | 1.663452% |
| D | 24888 | 423 | 1.699614% |
Noise dominated data is calculated using 1-second bins in cleaned event files. If a bin has >2000 counts, and if more than 50% of those come from <1% of pixels, then it is considered to be noise-dominated and hence unusable.
| Quadrant | # 1 sec bins | Bins with >0 counts | Bins with >2000 counts | High rate bins dominated by noise | Noise dominated (total time) | Noise dominated (detector-on time) | Marked lightcurve |
|---|---|---|---|---|---|---|---|
| A | 29023 | 24888 | 0 | 0 | 0.00% | 0.00% | 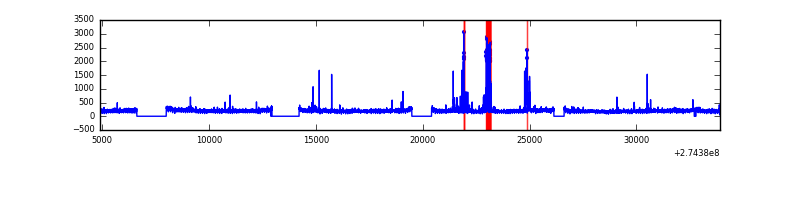 |
| B | 29023 | 24887 | 0 | 0 | 0.00% | 0.00% |  |
| C | 29023 | 24888 | 0 | 0 | 0.00% | 0.00% |  |
| D | 29023 | 24888 | 0 | 0 | 0.00% | 0.00% |  |
Top three noisy pixels from each quadrant. If the there are fewer than three noisy pixels in the level2.evt file, extra rows are filled as -1
| Pixel properties | Quadrant properties | ||||||
|---|---|---|---|---|---|---|---|
| Quadrant | DetID | PixID | Counts | Sigma | Mean | Median | Sigma |
| A | 0 | 29 | 1388 | 10.89 | 376 | 354 | 95.0 |
| A | 7 | 110 | 1145 | 8.33 | 376 | 354 | 95.0 |
| A | 9 | 19 | 1082 | 7.67 | 376 | 354 | 95.0 |
| B | 2 | 9 | 1131 | 10.74 | 368 | 352 | 72.6 |
| B | 2 | 8 | 1001 | 8.94 | 368 | 352 | 72.6 |
| B | 14 | 254 | 945 | 8.17 | 368 | 352 | 72.6 |
| C | 12 | 241 | 1026 | 6.88 | 374 | 350 | 98.2 |
| C | 3 | 126 | 934 | 5.95 | 374 | 350 | 98.2 |
| C | 9 | 233 | 925 | 5.85 | 374 | 350 | 98.2 |
| D | 3 | 14 | 915 | 6.35 | 352 | 321 | 93.6 |
| D | 6 | 231 | 906 | 6.25 | 352 | 321 | 93.6 |
| D | 7 | 5 | 875 | 5.92 | 352 | 321 | 93.6 |
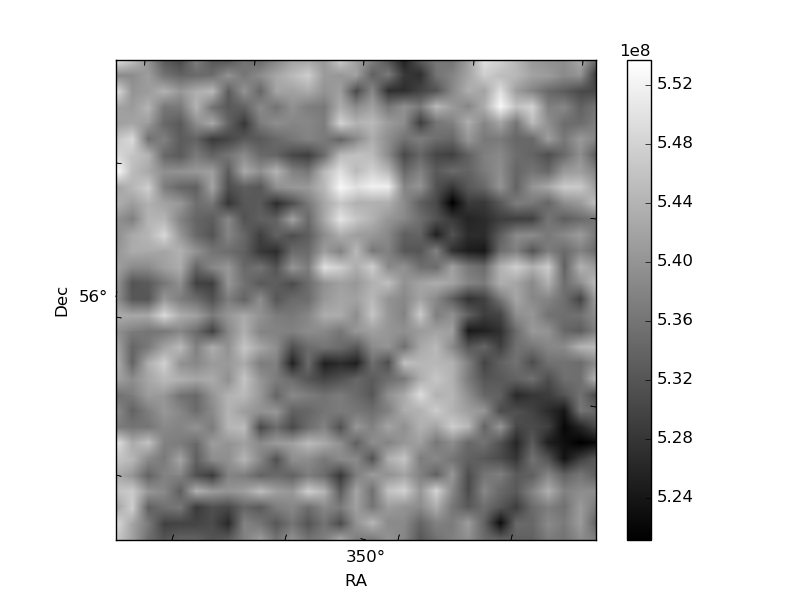
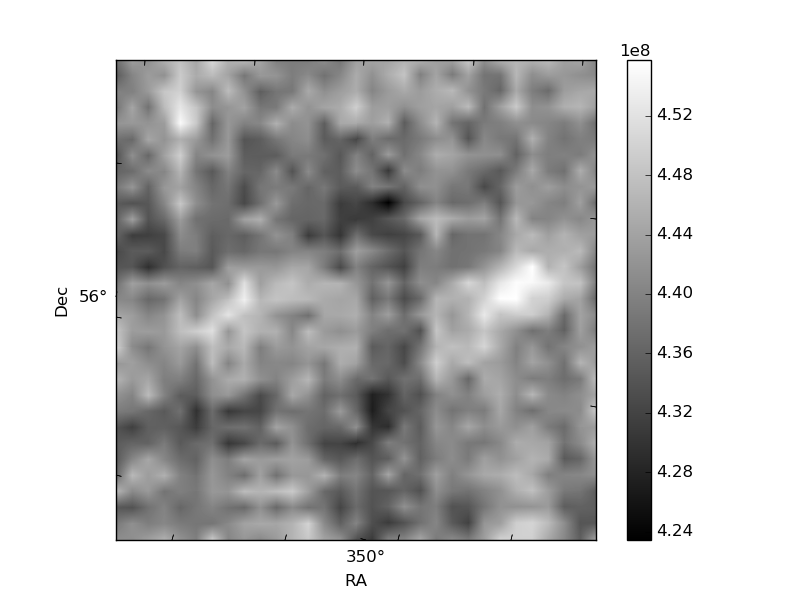
Histogram calculated using DETX and DETY for each event in the final _common_clean file
| Quadrant A | 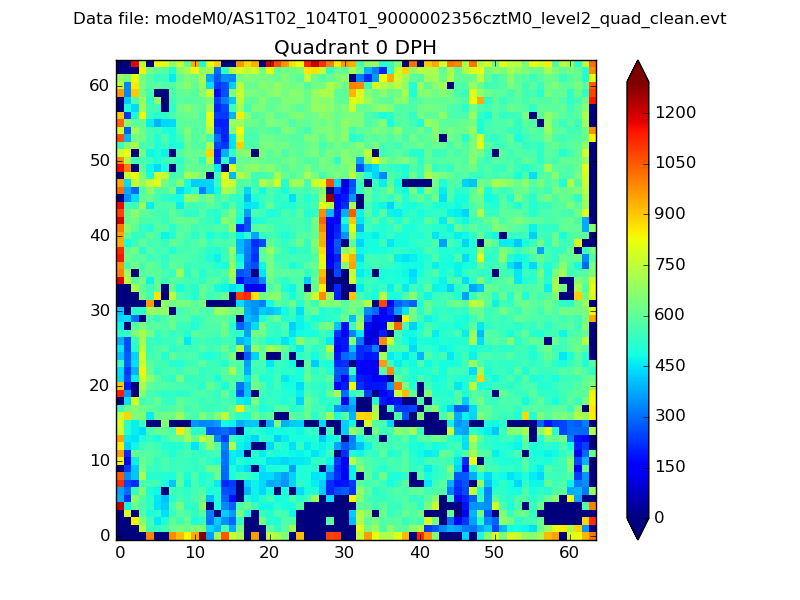 |
 |
Quadrant B |
|---|---|---|---|
| Quadrant D |  |
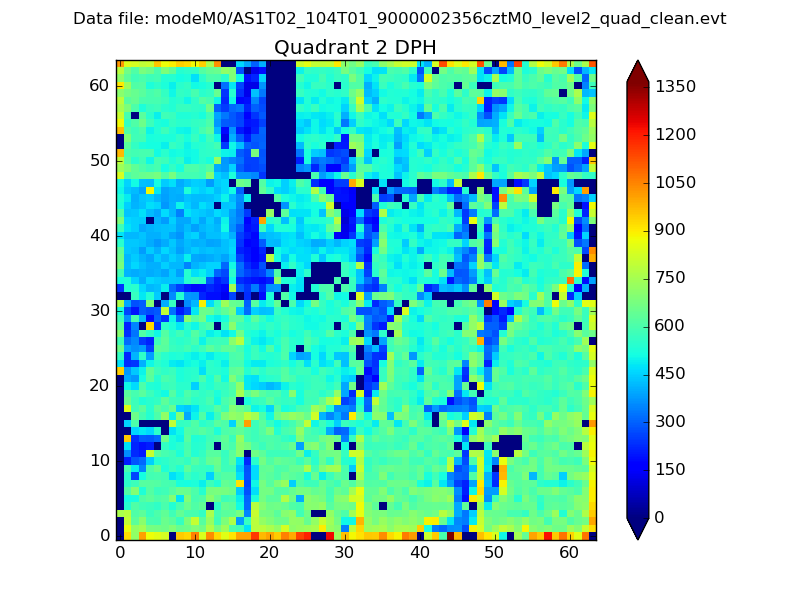 |
Quadrant C |
| Plot type | Count rate plots | Images |
|---|---|---|
| Comparison with Poisson distribution Blue bars denote a histogram of data divided into 1 sec bins. Red curve is a Poisson curve with rate = median count rate of data. |
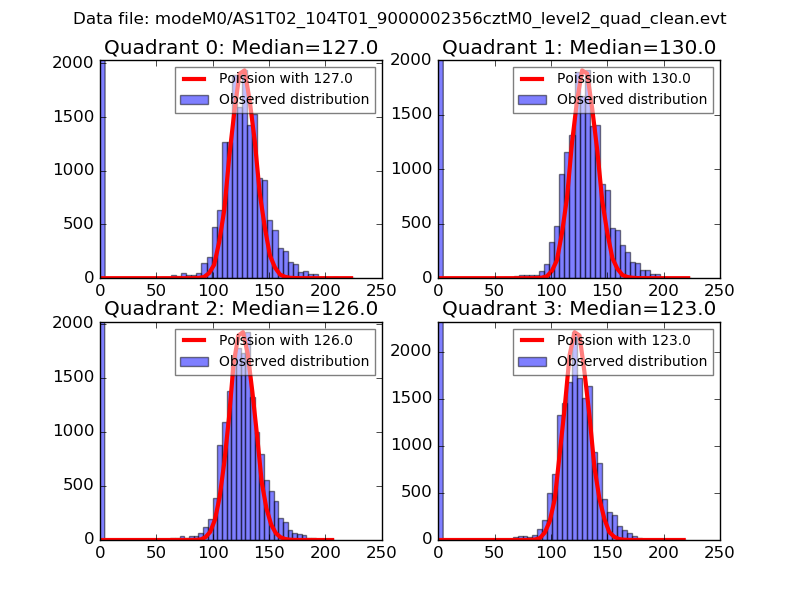 |
 |
| Quadrant-wise count rates Data is divided into 100 sec bins |
 |
|
| Module-wise count rates for Quadrant A Data is divided into 100 sec bins |
 |
 |
| Module-wise count rates for Quadrant B Data is divided into 100 sec bins |
 |
 |
| Module-wise count rates for Quadrant C Data is divided into 100 sec bins |
 |
 |
| Module-wise count rates for Quadrant D Data is divided into 100 sec bins |
 |
 |
| Parameter | Plot |
|---|---|
| CZT HV Monitor |  |
| D_VDD |  |
| Temperature 1 |  |
| Veto HV Monitor |  |
| Veto LLD |  |
| Alpha Counter | 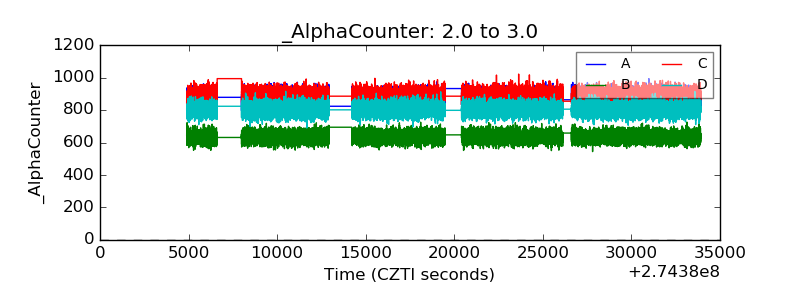 |
| _CPM_Rate |  |
| CZT Counter |  |
| +2.5 Volts monitor |  |
| +5 Volts monitor |  |
| _ROLL_ROT | 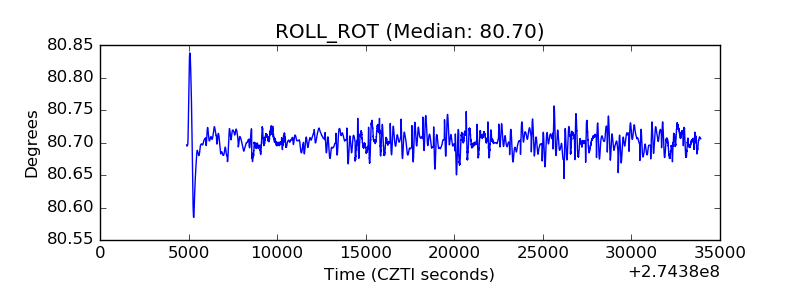 |
| _Roll_DEC |  |
| _Roll_RA | 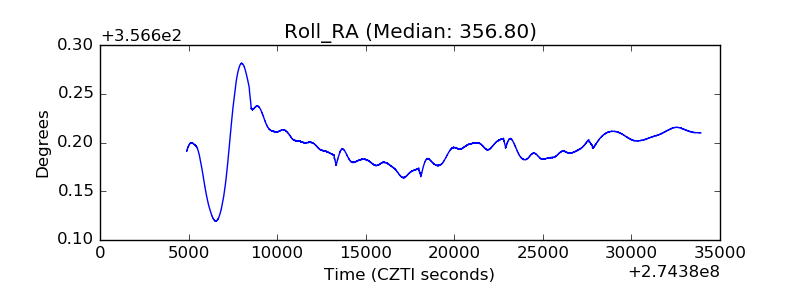 |
| Veto Counter | 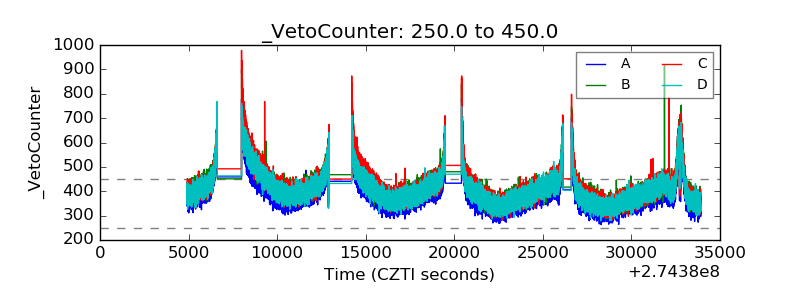 |