| Param | Original file | Final file |
|---|---|---|
| Filename | modeM0/AS1T02_104T01_9000002356_15980cztM0_level2.evt | modeM0/AS1T02_104T01_9000002356_15980cztM0_level2_quad_clean.evt |
| Size (bytes) | 230,250,240 | 43,597,440 |
| Size | 219.6 MB | 41.6 MB |
| Events in quadrant A | 1,493,615 | 283,491 |
| Events in quadrant B | 1,618,048 | 290,346 |
| Events in quadrant C | 1,544,293 | 278,950 |
| Events in quadrant D | 2,113,439 | 255,333 |
| Mode SS | |||
|---|---|---|---|
| Quadrant | BADHDUFLAG | Total packets | Discarded packets |
| A | 0 | 64 | 0 |
| B | 0 | 64 | 0 |
| C | 0 | 64 | 0 |
| D | 0 | 64 | 0 |
| Mode M0 | |||
|---|---|---|---|
| Quadrant | BADHDUFLAG | Total packets | Discarded packets |
| A | 0 | 6310 | 2 |
| B | 0 | 6669 | 1 |
| C | 0 | 6488 | 1 |
| D | 0 | 8341 | 1 |
| Mode M9 | |||
|---|---|---|---|
| Quadrant | BADHDUFLAG | Total packets | Discarded packets |
| A | 0 | 13 | 0 |
| B | 0 | 13 | 0 |
| C | 0 | 13 | 0 |
| D | 0 | 13 | 0 |
| Quadrant | Total seconds | Saturated seconds | Saturation percentage |
|---|---|---|---|
| A | 2960 | 58 | 1.959459% |
| B | 2960 | 82 | 2.770270% |
| C | 2960 | 89 | 3.006757% |
| D | 2960 | 324 | 10.945946% |
Noise dominated data is calculated using 1-second bins in cleaned event files. If a bin has >2000 counts, and if more than 50% of those come from <1% of pixels, then it is considered to be noise-dominated and hence unusable.
| Quadrant | # 1 sec bins | Bins with >0 counts | Bins with >2000 counts | High rate bins dominated by noise | Noise dominated (total time) | Noise dominated (detector-on time) | Marked lightcurve |
|---|---|---|---|---|---|---|---|
| A | 4336 | 2962 | 0 | 0 | 0.00% | 0.00% | 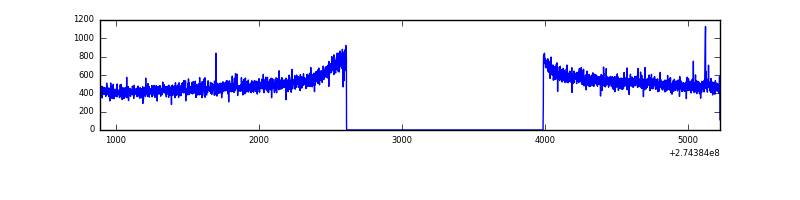 |
| B | 4336 | 2961 | 2 | 2 | 0.05% | 0.07% | 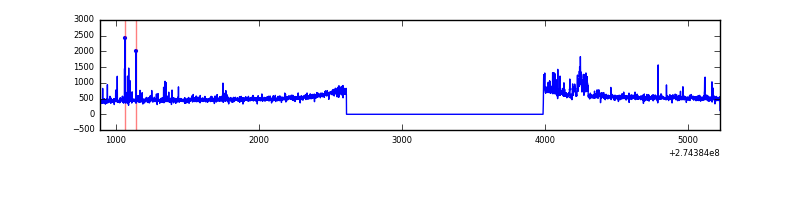 |
| C | 4336 | 2962 | 0 | 0 | 0.00% | 0.00% | 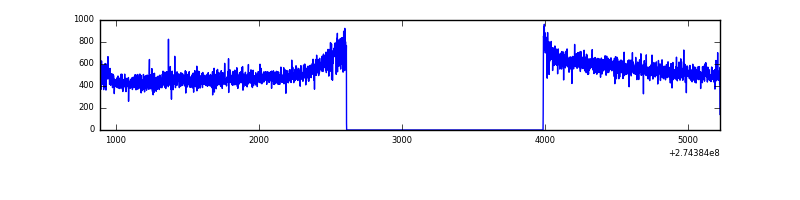 |
| D | 4336 | 2962 | 189 | 189 | 4.36% | 6.38% | 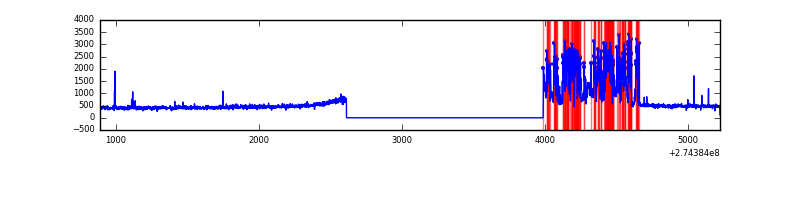 |
Top three noisy pixels from each quadrant. If the there are fewer than three noisy pixels in the level2.evt file, extra rows are filled as -1
| Pixel properties | Quadrant properties | ||||||
|---|---|---|---|---|---|---|---|
| Quadrant | DetID | PixID | Counts | Sigma | Mean | Median | Sigma |
| A | 0 | 226 | 3301 | 37.41 | 387 | 379 | 78.1 |
| A | 15 | 174 | 3122 | 35.12 | 387 | 379 | 78.1 |
| A | 12 | 194 | 2824 | 31.31 | 387 | 379 | 78.1 |
| B | 4 | 216 | 48339 | 647.39 | 388 | 380 | 74.1 |
| B | 10 | 245 | 17519 | 231.36 | 388 | 380 | 74.1 |
| B | 15 | 35 | 10095 | 131.14 | 388 | 380 | 74.1 |
| C | 14 | 238 | 57692 | 664.94 | 371 | 374 | 86.2 |
| C | 3 | 233 | 24497 | 279.85 | 371 | 374 | 86.2 |
| C | 4 | 238 | 9741 | 108.67 | 371 | 374 | 86.2 |
| D | 10 | 70 | 683777 | 7792.28 | 362 | 352 | 87.7 |
| D | 12 | 218 | 38387 | 433.67 | 362 | 352 | 87.7 |
| D | 2 | 234 | 12475 | 138.22 | 362 | 352 | 87.7 |
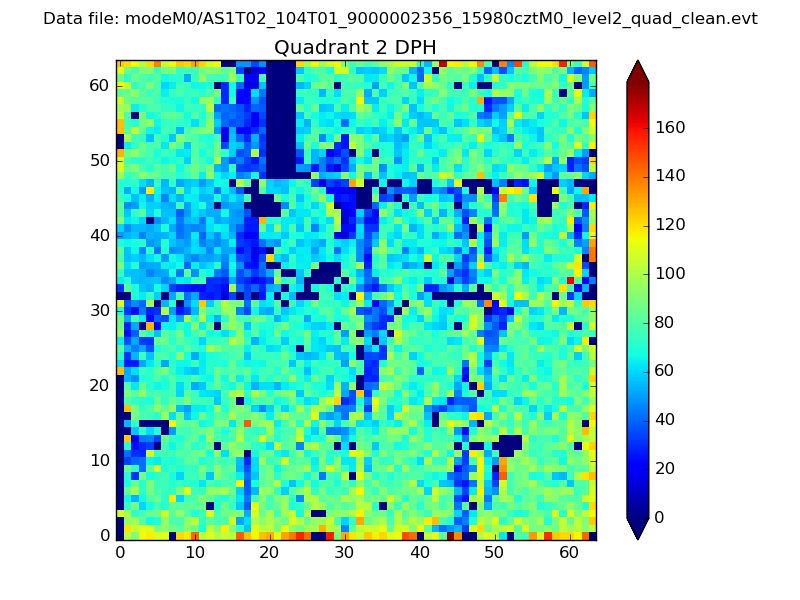
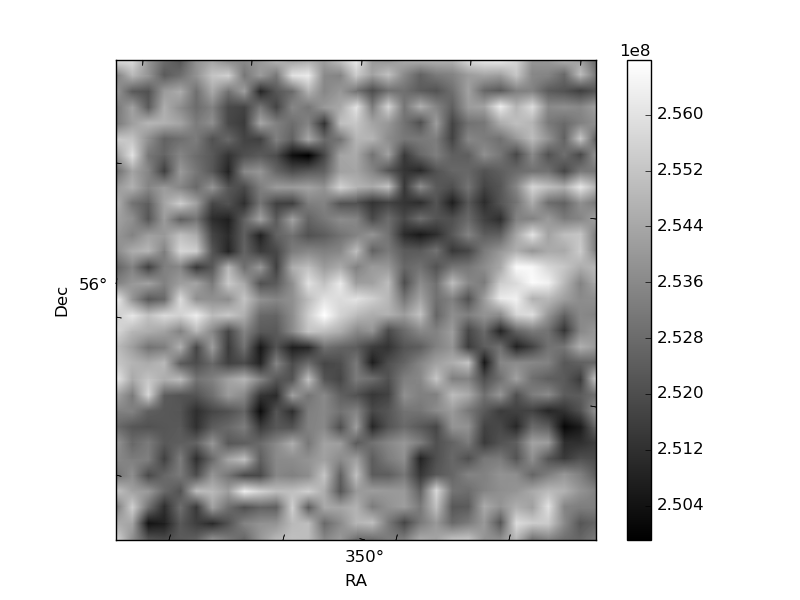
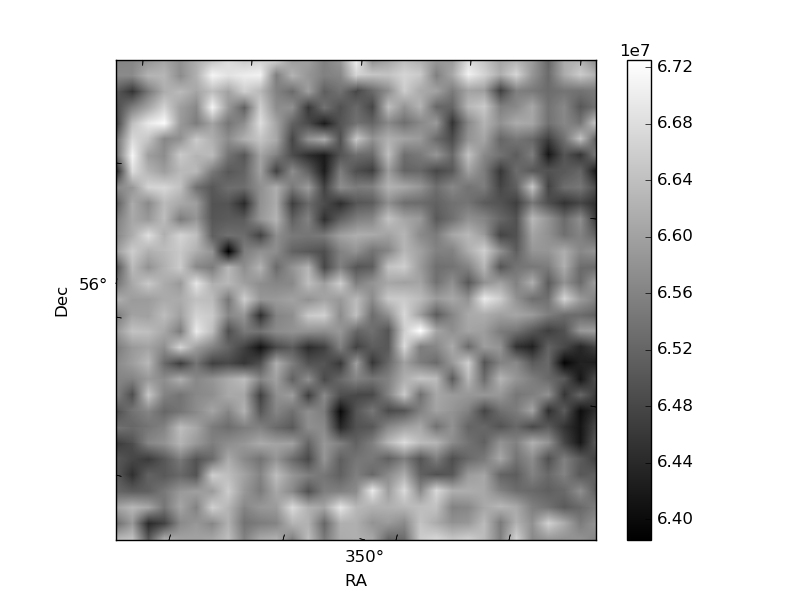
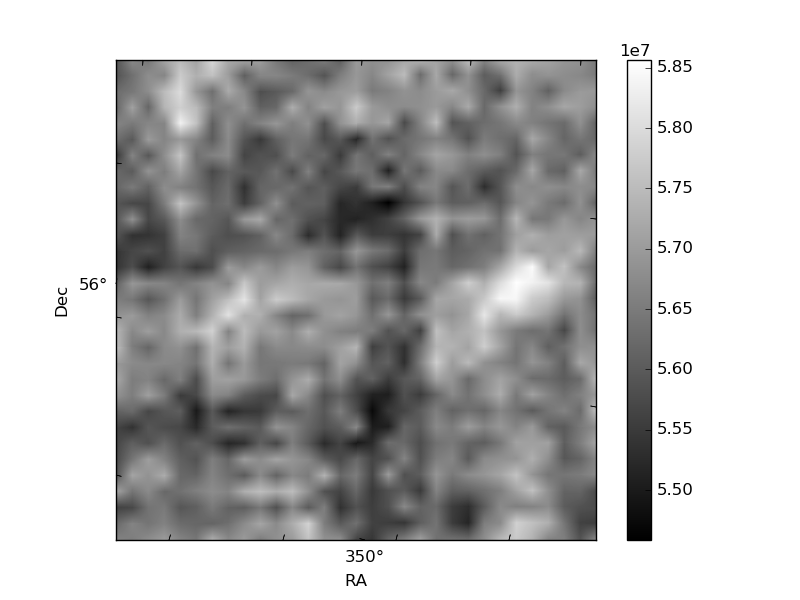
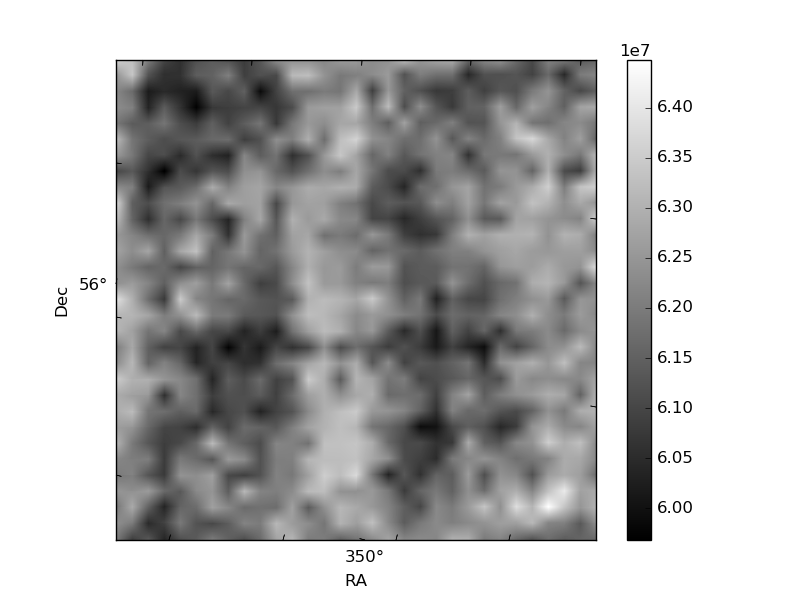
Histogram calculated using DETX and DETY for each event in the final _common_clean file
| Quadrant A | 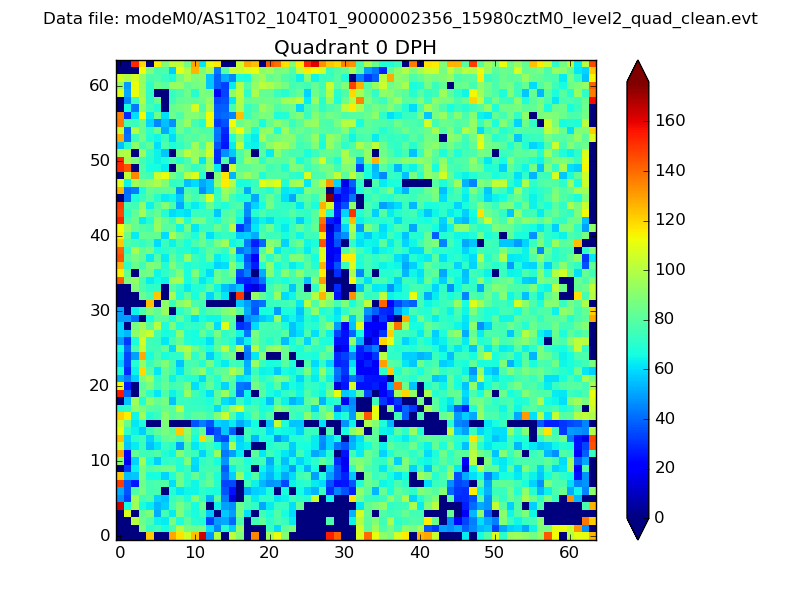 |
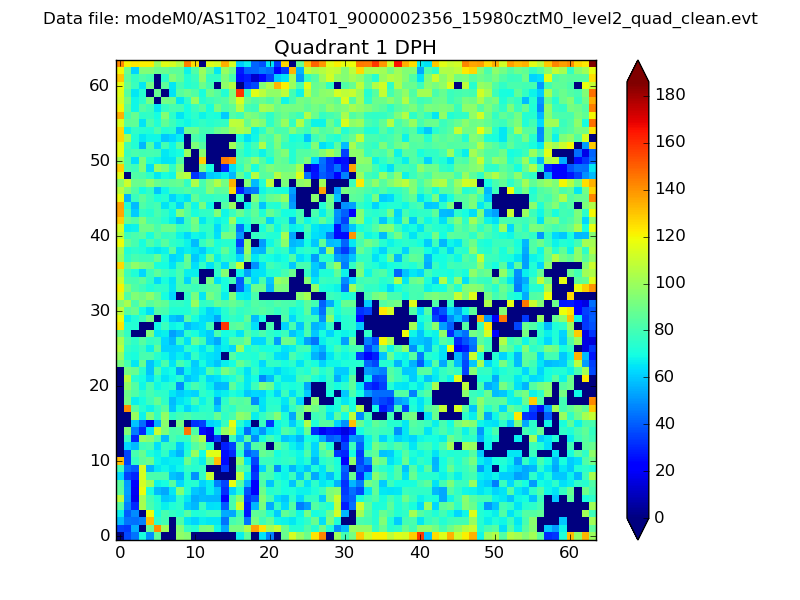 |
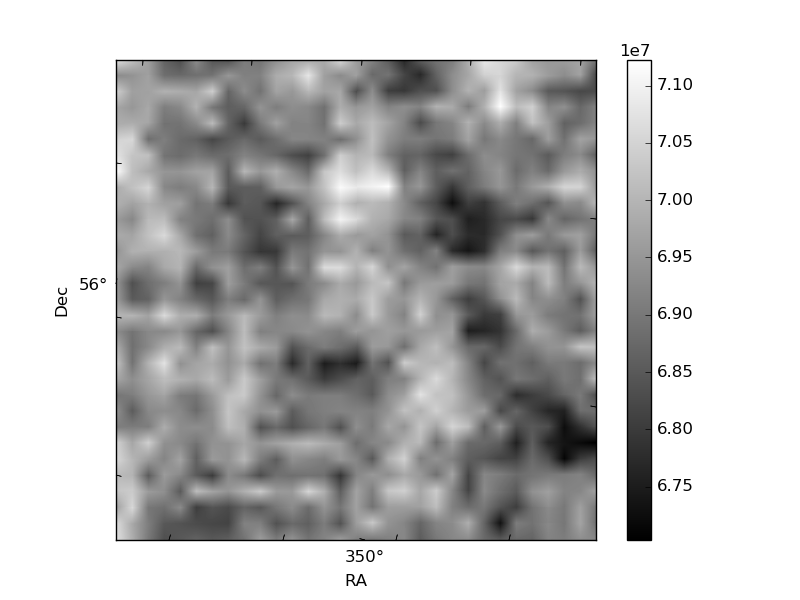
Quadrant B |
|---|---|---|---|
| Quadrant D | 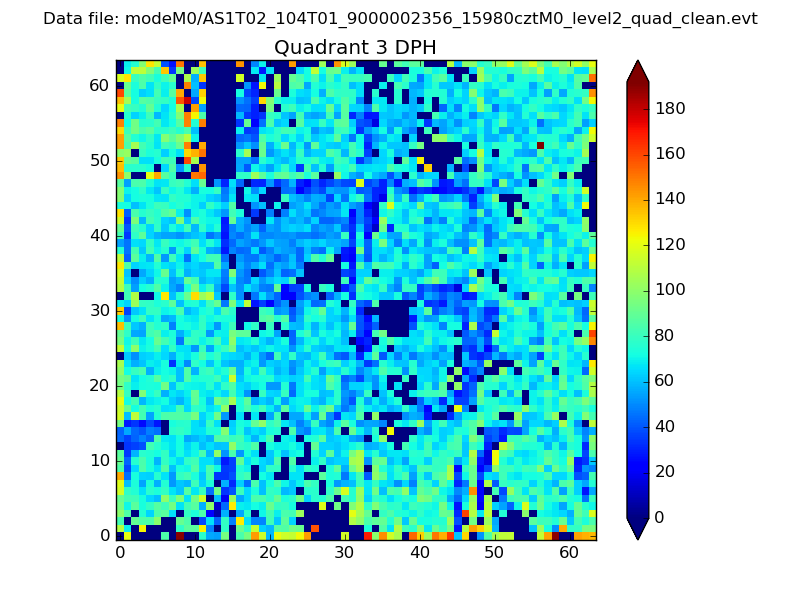 |
 |
Quadrant C |
| Plot type | Count rate plots | Images |
|---|---|---|
| Comparison with Poisson distribution Blue bars denote a histogram of data divided into 1 sec bins. Red curve is a Poisson curve with rate = median count rate of data. |
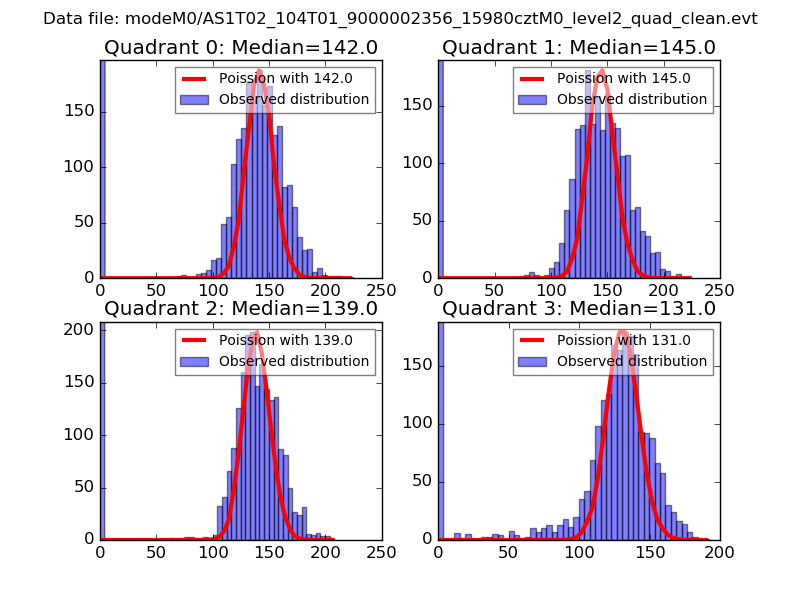 |
 |
| Quadrant-wise count rates Data is divided into 100 sec bins |
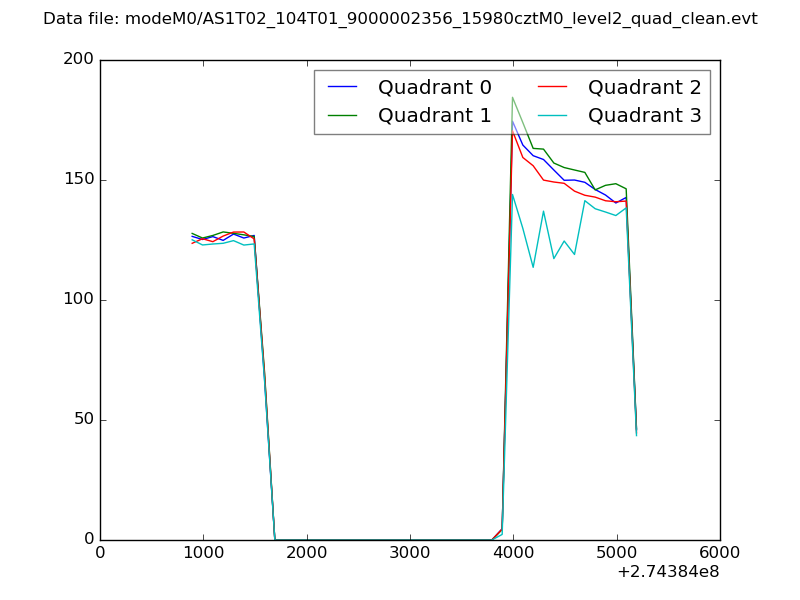 |
|
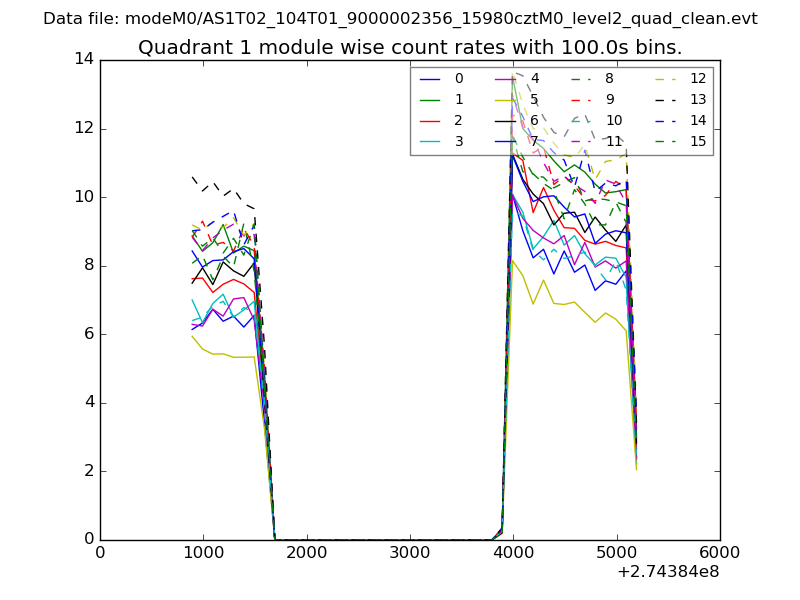
| Module-wise count rates for Quadrant A Data is divided into 100 sec bins |
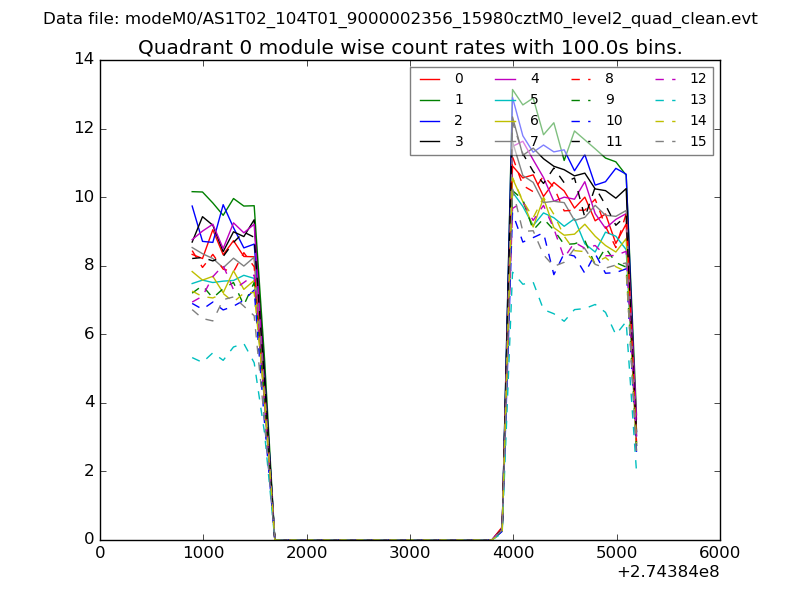 |
 |
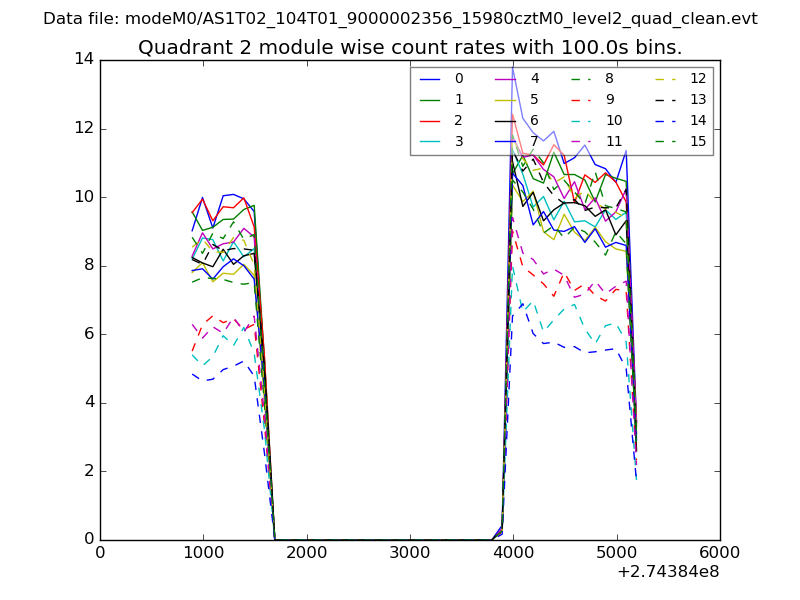
| Module-wise count rates for Quadrant B Data is divided into 100 sec bins |
 |
 |
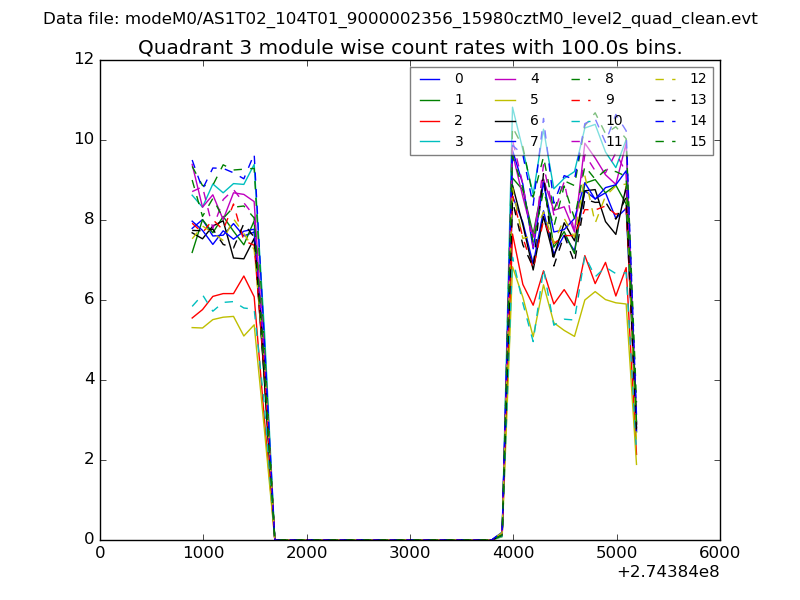
| Module-wise count rates for Quadrant C Data is divided into 100 sec bins |
 |
 |
| Module-wise count rates for Quadrant D Data is divided into 100 sec bins |
 |
 |
| Parameter | Plot |
|---|---|
| CZT HV Monitor | 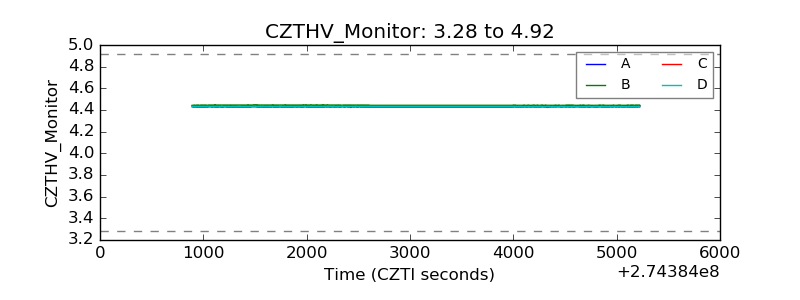 |
| D_VDD | 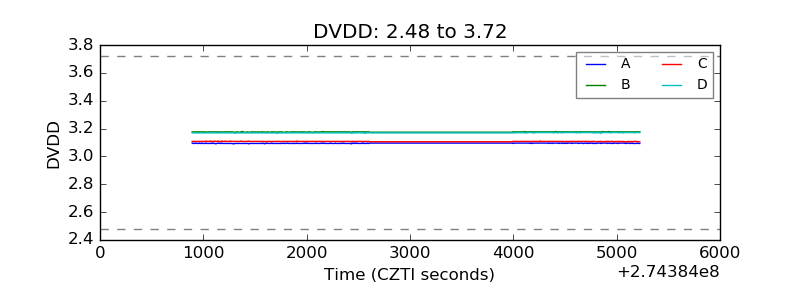 |
| Temperature 1 |  |
| Veto HV Monitor | 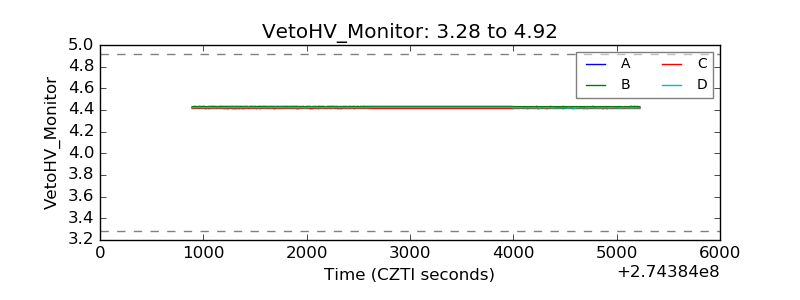 |
| Veto LLD | 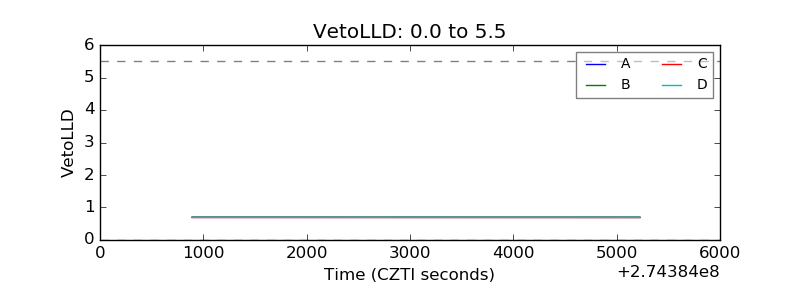 |
| Alpha Counter | 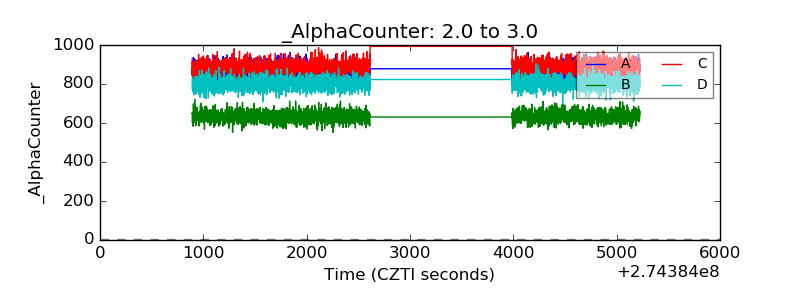 |
| _CPM_Rate | 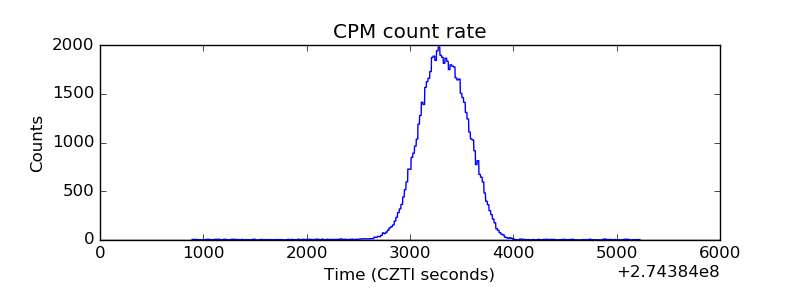 |
| CZT Counter | 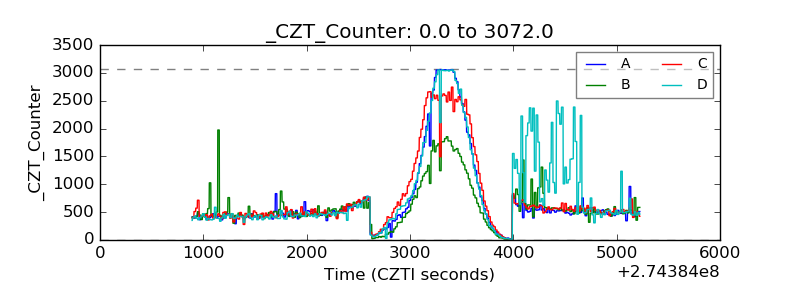 |
| +2.5 Volts monitor |  |
| +5 Volts monitor |  |
| _ROLL_ROT |  |
| _Roll_DEC |  |
| _Roll_RA | 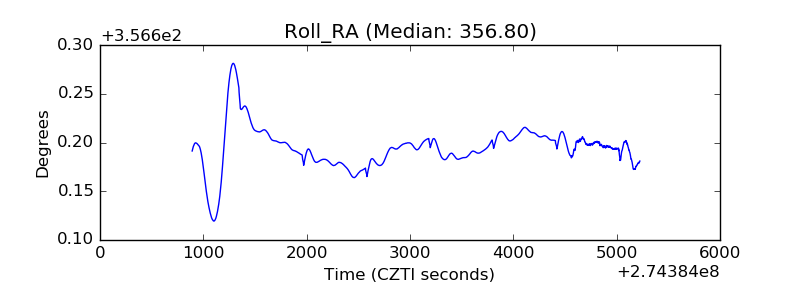 |
| Veto Counter | 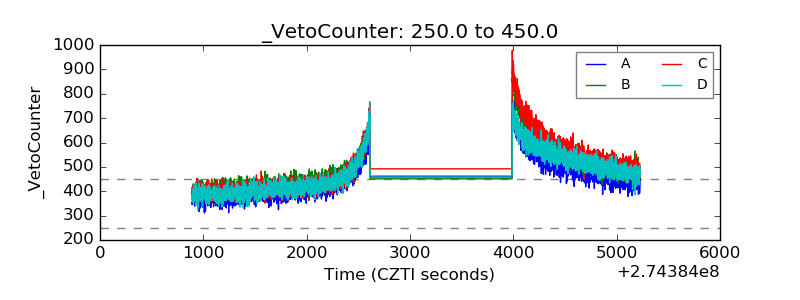 |