| Param | Original file | Final file |
|---|---|---|
| Filename | modeM0/AS1T02_104T01_9000002356_15981cztM0_level2.evt | modeM0/AS1T02_104T01_9000002356_15981cztM0_level2_quad_clean.evt |
| Size (bytes) | 429,373,440 | 99,158,400 |
| Size | 409.5 MB | 94.6 MB |
| Events in quadrant A | 2,920,699 | 649,701 |
| Events in quadrant B | 3,109,070 | 668,297 |
| Events in quadrant C | 3,042,128 | 643,881 |
| Events in quadrant D | 3,512,389 | 610,697 |
| Mode SS | |||
|---|---|---|---|
| Quadrant | BADHDUFLAG | Total packets | Discarded packets |
| A | 0 | 126 | 0 |
| B | 0 | 126 | 0 |
| C | 0 | 126 | 0 |
| D | 0 | 126 | 0 |
| Mode M0 | |||
|---|---|---|---|
| Quadrant | BADHDUFLAG | Total packets | Discarded packets |
| A | 0 | 12810 | 3 |
| B | 0 | 13292 | 2 |
| C | 0 | 13064 | 2 |
| D | 0 | 14852 | 2 |
| Mode M9 | |||
|---|---|---|---|
| Quadrant | BADHDUFLAG | Total packets | Discarded packets |
| A | 0 | 15 | 0 |
| B | 0 | 15 | 0 |
| C | 0 | 15 | 0 |
| D | 0 | 16 | 0 |
| Quadrant | Total seconds | Saturated seconds | Saturation percentage |
|---|---|---|---|
| A | 6171 | 22 | 0.356506% |
| B | 6171 | 44 | 0.713012% |
| C | 6171 | 65 | 1.053314% |
| D | 6171 | 291 | 4.715605% |
Noise dominated data is calculated using 1-second bins in cleaned event files. If a bin has >2000 counts, and if more than 50% of those come from <1% of pixels, then it is considered to be noise-dominated and hence unusable.
| Quadrant | # 1 sec bins | Bins with >0 counts | Bins with >2000 counts | High rate bins dominated by noise | Noise dominated (total time) | Noise dominated (detector-on time) | Marked lightcurve |
|---|---|---|---|---|---|---|---|
| A | 7462 | 6174 | 1 | 1 | 0.01% | 0.02% | 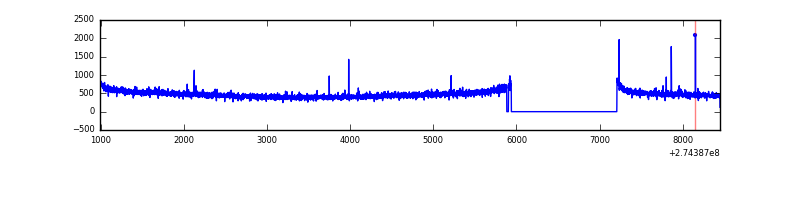 |
| B | 7462 | 6174 | 2 | 2 | 0.03% | 0.03% | 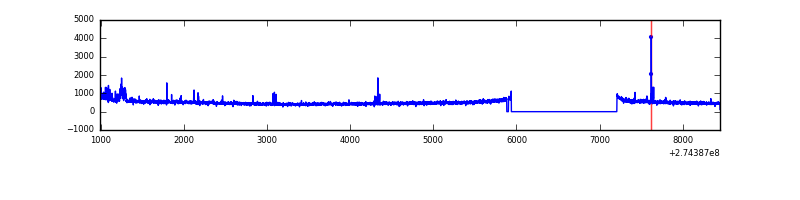 |
| C | 7462 | 6174 | 1 | 1 | 0.01% | 0.02% | 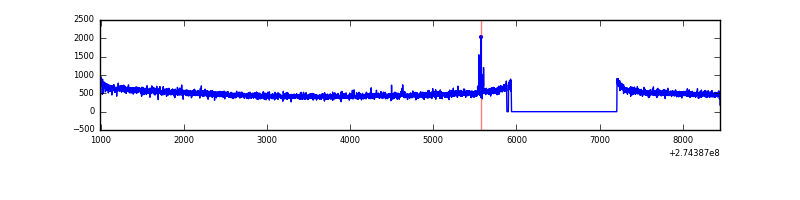 |
| D | 7462 | 6174 | 191 | 191 | 2.56% | 3.09% | 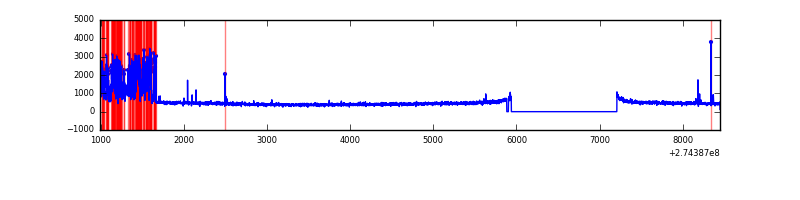 |
Top three noisy pixels from each quadrant. If the there are fewer than three noisy pixels in the level2.evt file, extra rows are filled as -1
| Pixel properties | Quadrant properties | ||||||
|---|---|---|---|---|---|---|---|
| Quadrant | DetID | PixID | Counts | Sigma | Mean | Median | Sigma |
| A | 9 | 143 | 9990 | 61.61 | 755 | 741 | 150.1 |
| A | 0 | 226 | 6576 | 38.87 | 755 | 741 | 150.1 |
| A | 12 | 194 | 5550 | 32.03 | 755 | 741 | 150.1 |
| B | 4 | 216 | 61158 | 423.23 | 764 | 745 | 142.7 |
| B | 12 | 111 | 16138 | 107.84 | 764 | 745 | 142.7 |
| B | 4 | 173 | 14800 | 98.46 | 764 | 745 | 142.7 |
| C | 14 | 238 | 113823 | 662.87 | 739 | 747 | 170.6 |
| C | 3 | 233 | 20590 | 116.32 | 739 | 747 | 170.6 |
| C | 4 | 238 | 10869 | 59.34 | 739 | 747 | 170.6 |
| D | 10 | 70 | 684211 | 3858.43 | 729 | 709 | 177.1 |
| D | 12 | 218 | 34389 | 190.13 | 729 | 709 | 177.1 |
| D | 2 | 234 | 25242 | 138.49 | 729 | 709 | 177.1 |
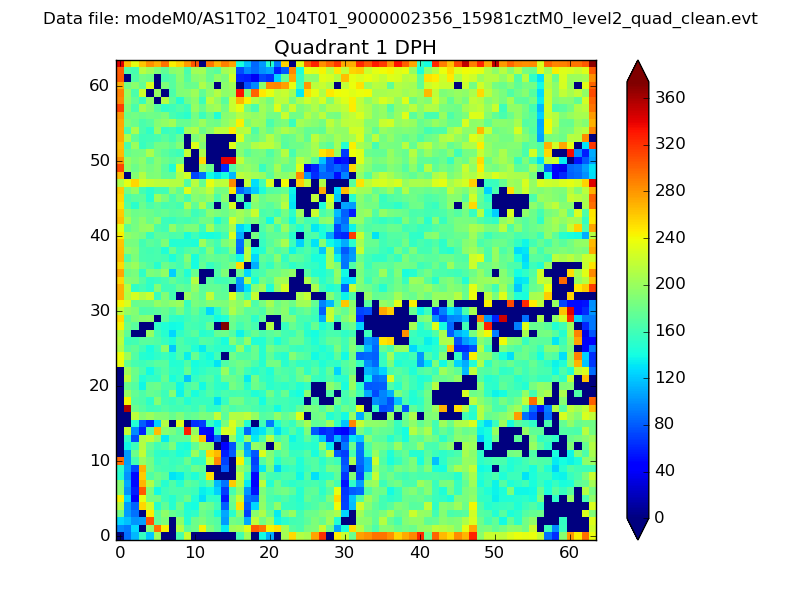
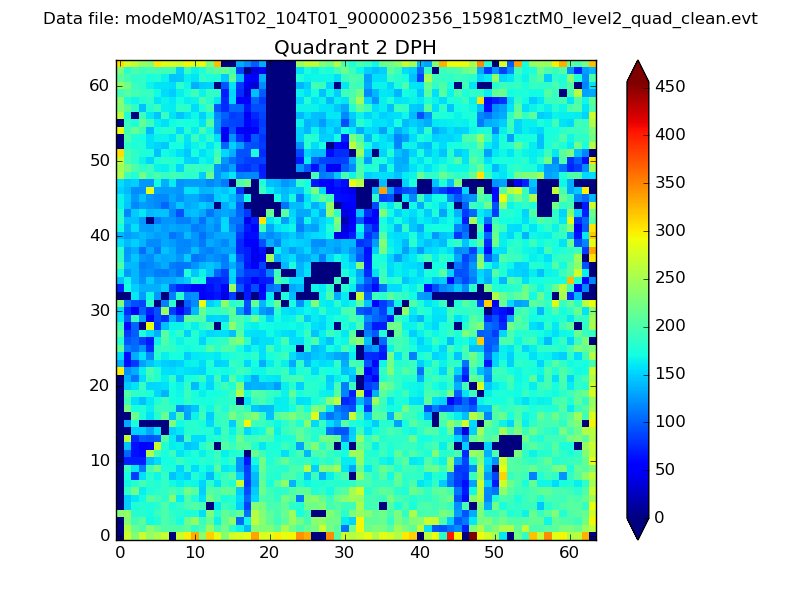
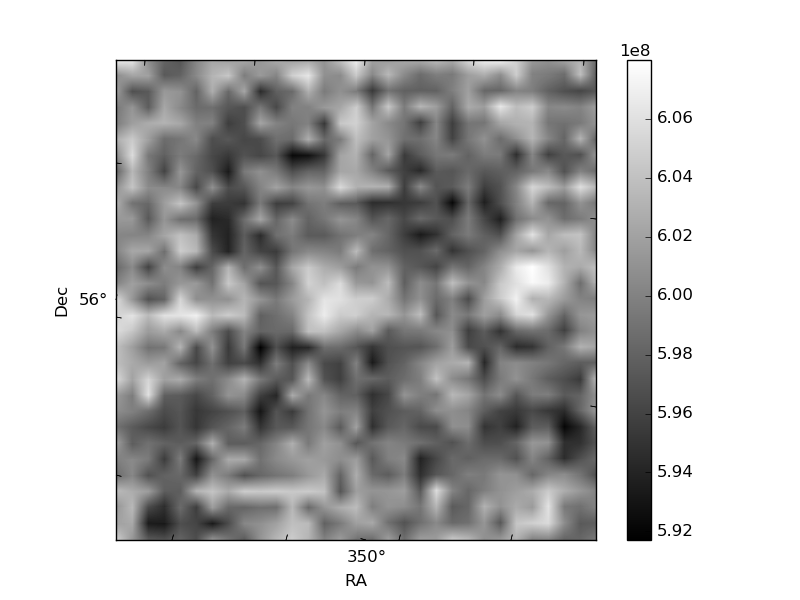
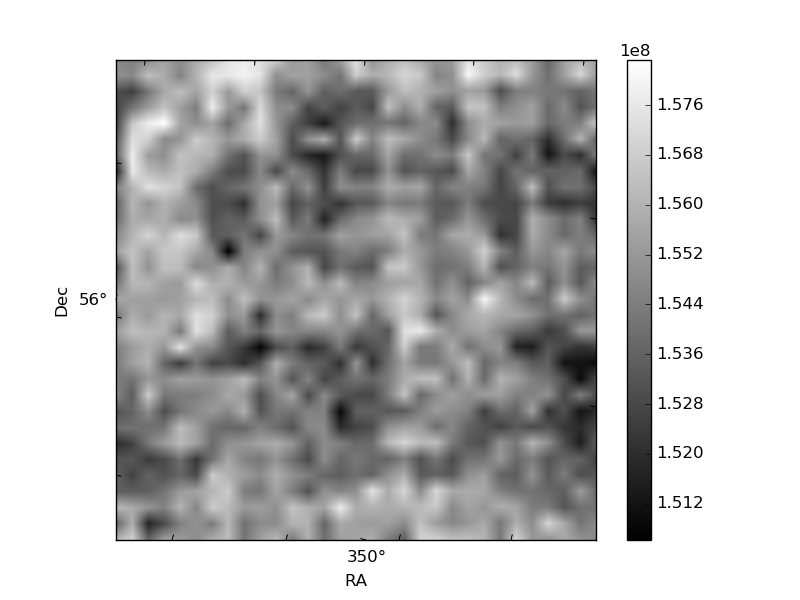
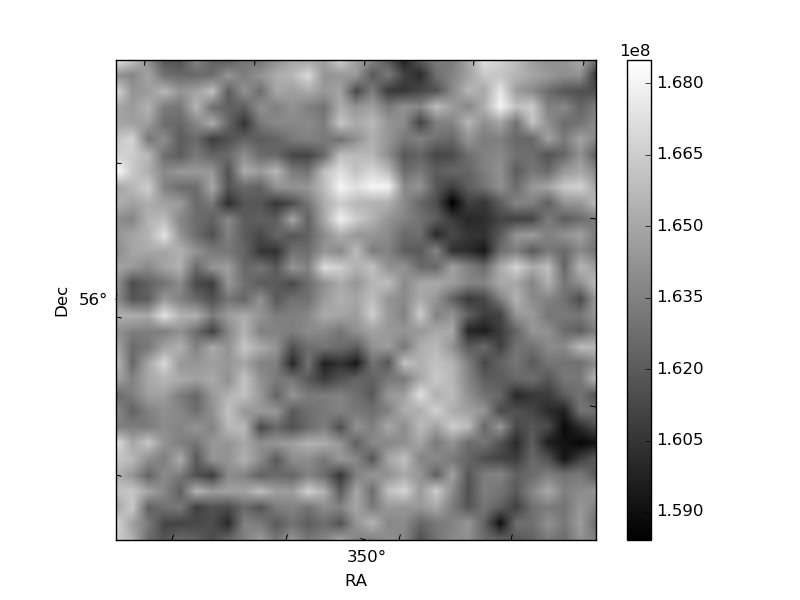
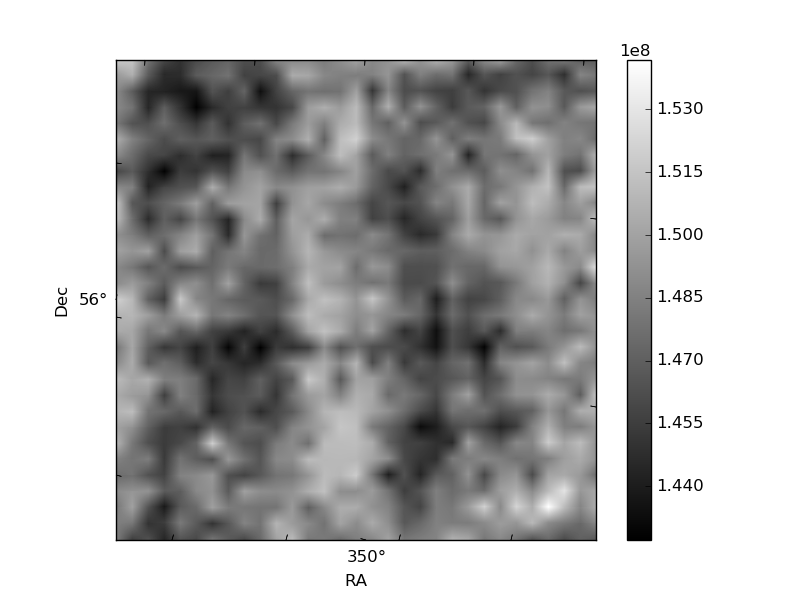
Histogram calculated using DETX and DETY for each event in the final _common_clean file
| Quadrant A |  |
 |
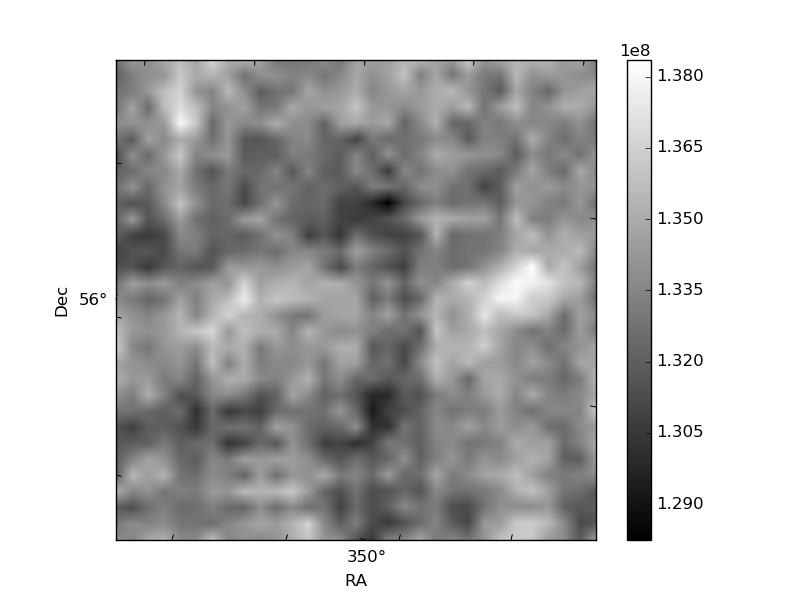
Quadrant B |
|---|---|---|---|
| Quadrant D | 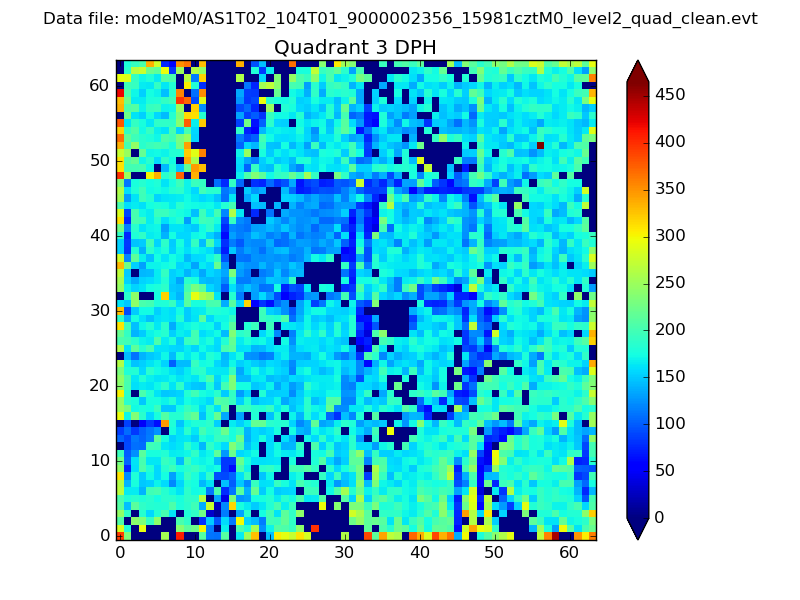 |
 |
Quadrant C |
| Plot type | Count rate plots | Images |
|---|---|---|
| Comparison with Poisson distribution Blue bars denote a histogram of data divided into 1 sec bins. Red curve is a Poisson curve with rate = median count rate of data. |
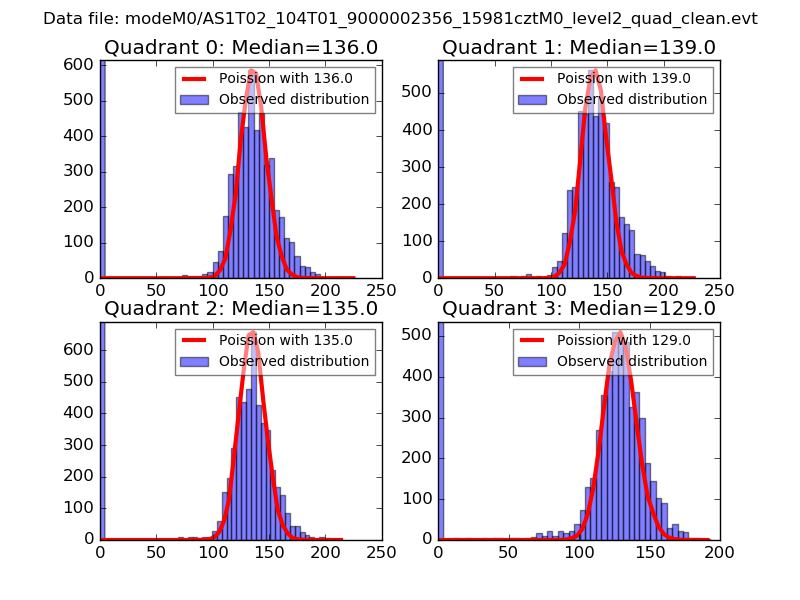 |
 |
| Quadrant-wise count rates Data is divided into 100 sec bins |
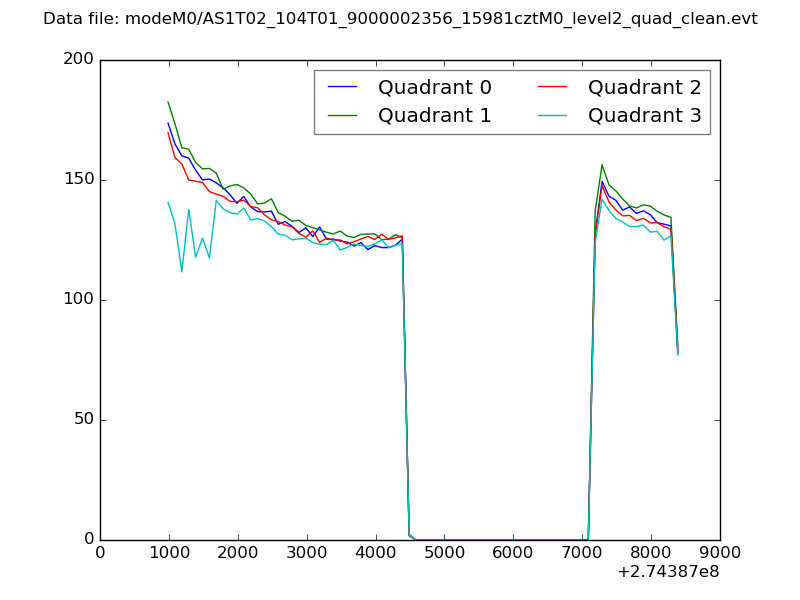 |
|
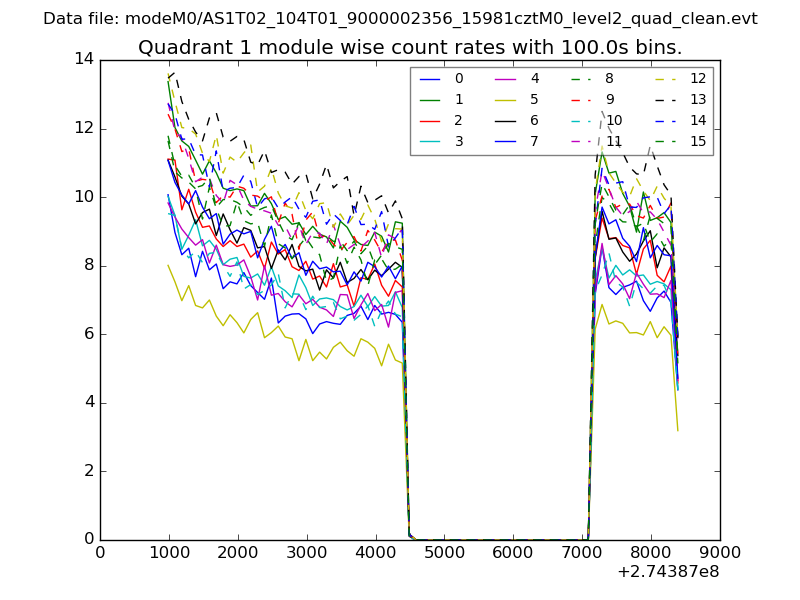
| Module-wise count rates for Quadrant A Data is divided into 100 sec bins |
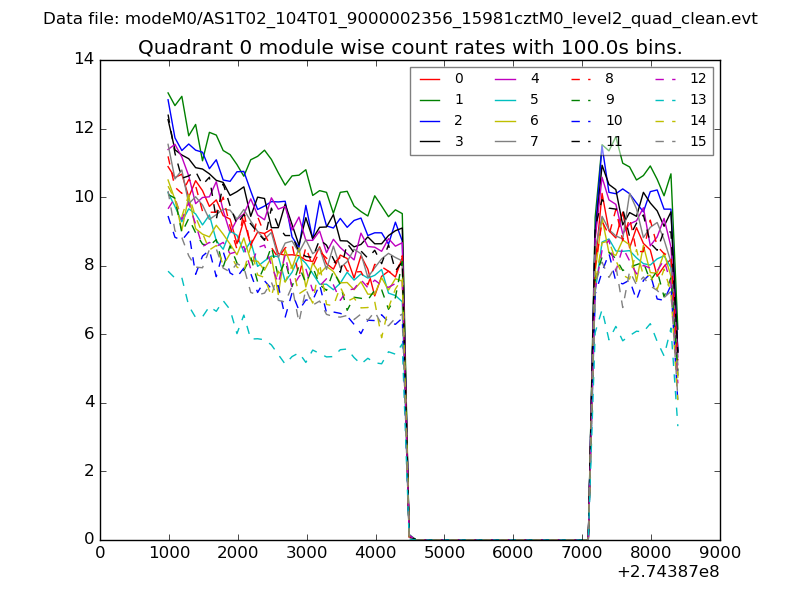 |
 |
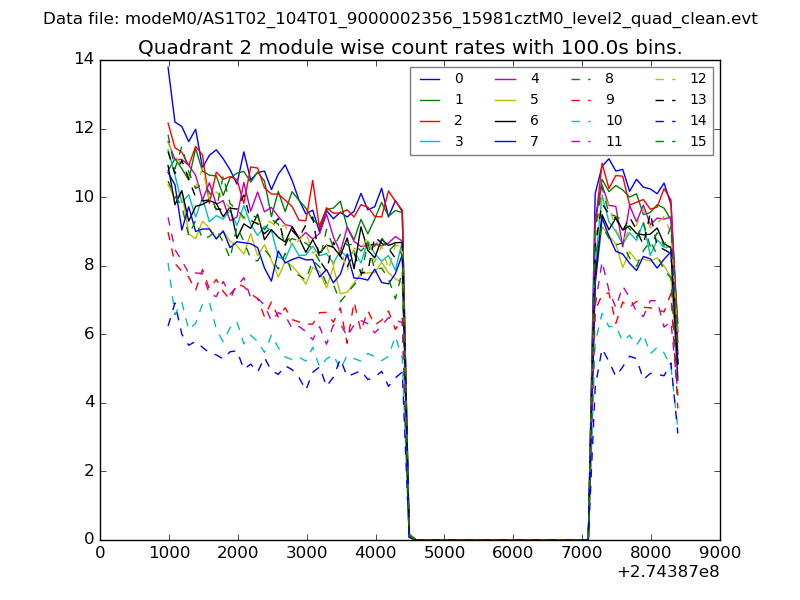
| Module-wise count rates for Quadrant B Data is divided into 100 sec bins |
 |
 |
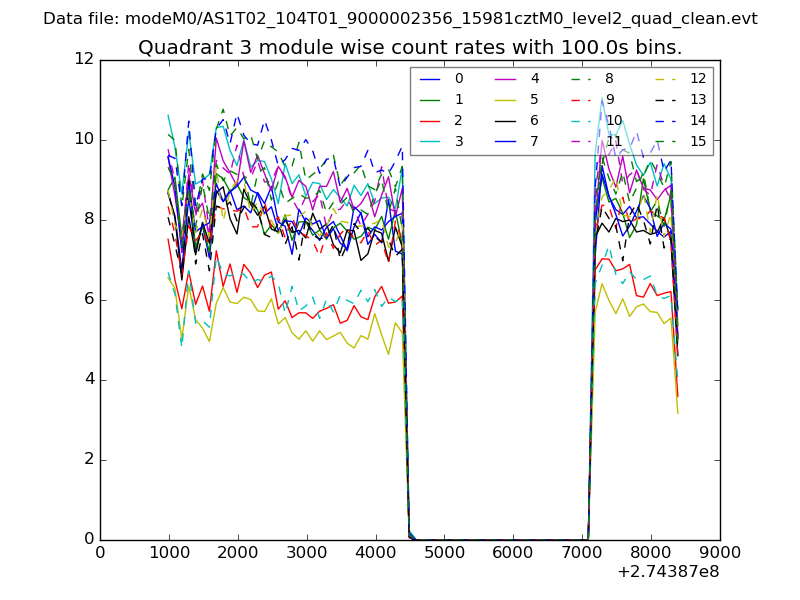
| Module-wise count rates for Quadrant C Data is divided into 100 sec bins |
 |
 |
| Module-wise count rates for Quadrant D Data is divided into 100 sec bins |
 |
 |
| Parameter | Plot |
|---|---|
| CZT HV Monitor | 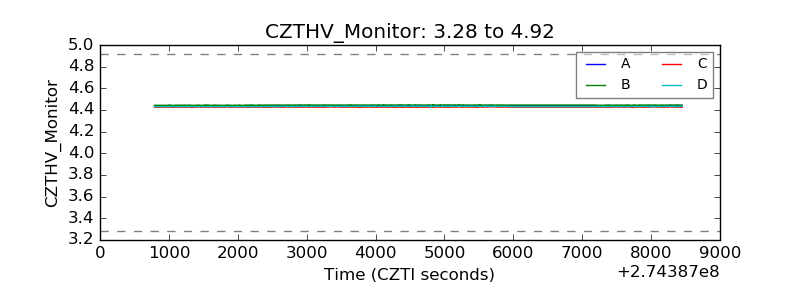 |
| D_VDD | 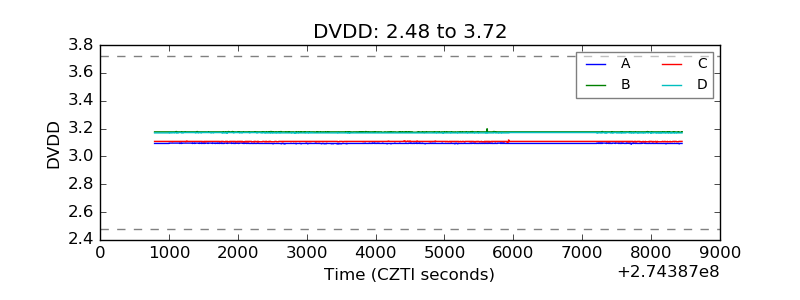 |
| Temperature 1 | 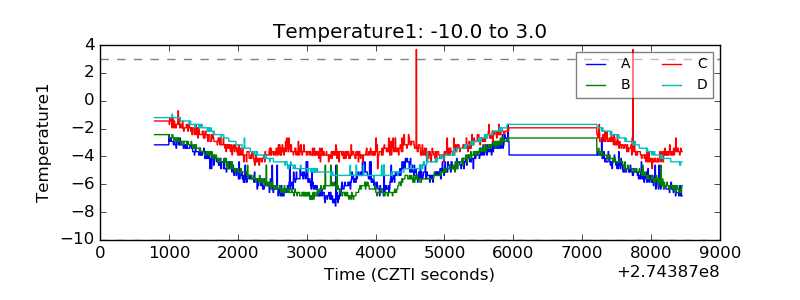 |
| Veto HV Monitor | 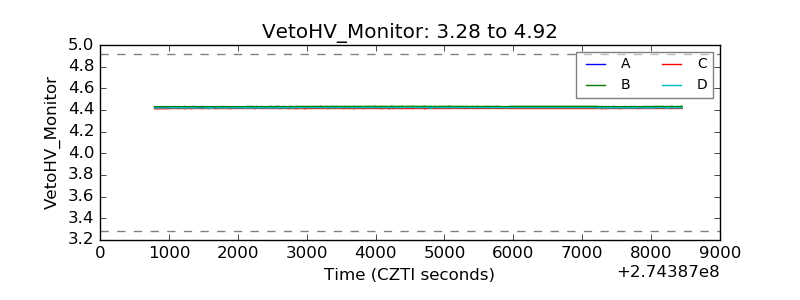 |
| Veto LLD | 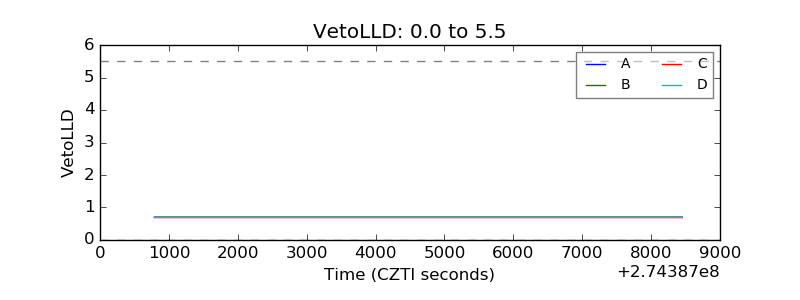 |
| Alpha Counter | 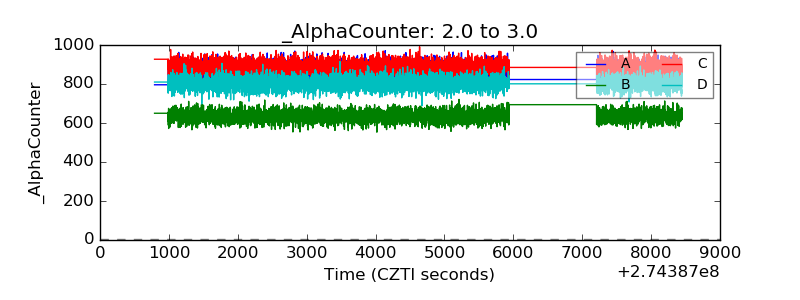 |
| _CPM_Rate | 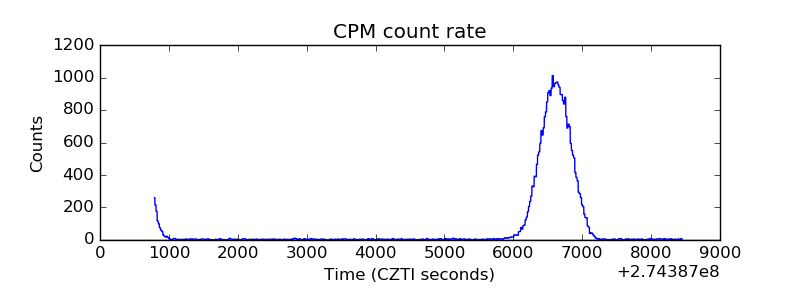 |
| CZT Counter |  |
| +2.5 Volts monitor |  |
| +5 Volts monitor | 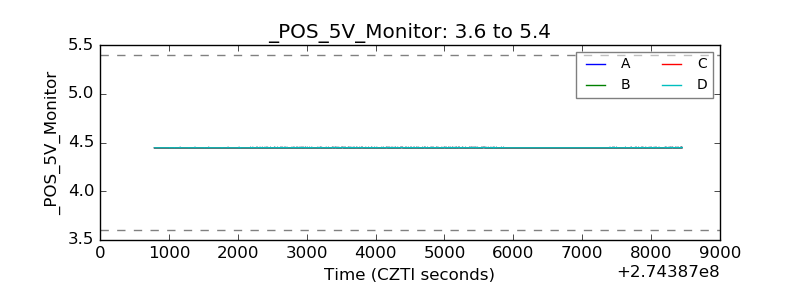 |
| _ROLL_ROT | 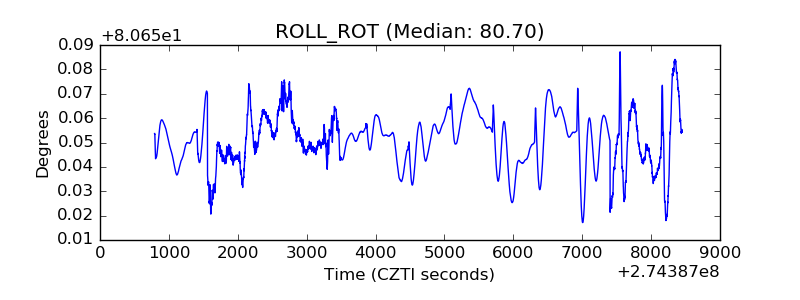 |
| _Roll_DEC | 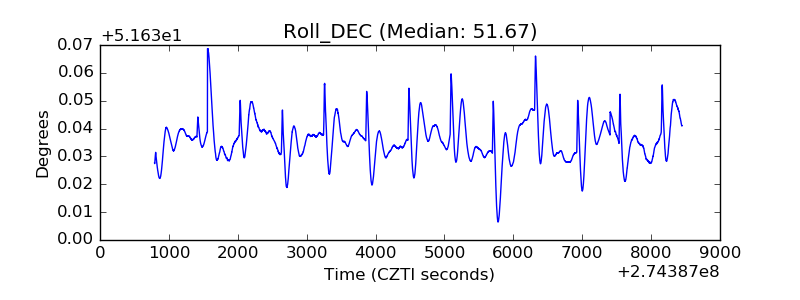 |
| _Roll_RA | 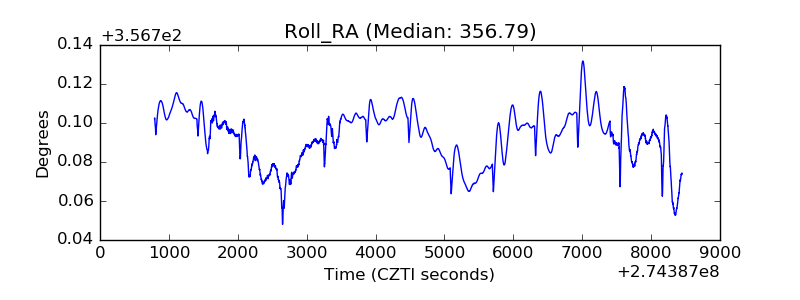 |
| Veto Counter | 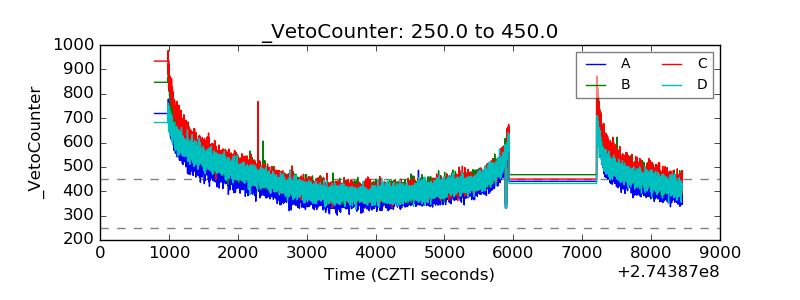 |