| Param | Original file | Final file |
|---|---|---|
| Filename | modeM0/AS1T02_104T01_9000002356_15983cztM0_level2.evt | modeM0/AS1T02_104T01_9000002356_15983cztM0_level2_quad_clean.evt |
| Size (bytes) | 488,246,400 | 104,362,560 |
| Size | 465.6 MB | 99.5 MB |
| Events in quadrant A | 3,747,614 | 666,307 |
| Events in quadrant B | 3,621,240 | 682,910 |
| Events in quadrant C | 3,587,658 | 657,031 |
| Events in quadrant D | 3,334,535 | 646,937 |
| Mode SS | |||
|---|---|---|---|
| Quadrant | BADHDUFLAG | Total packets | Discarded packets |
| A | 0 | 148 | 0 |
| B | 0 | 148 | 0 |
| C | 0 | 148 | 0 |
| D | 0 | 148 | 0 |
| Mode M0 | |||
|---|---|---|---|
| Quadrant | BADHDUFLAG | Total packets | Discarded packets |
| A | 0 | 16266 | 3 |
| B | 0 | 15726 | 2 |
| C | 0 | 15577 | 2 |
| D | 0 | 15352 | 2 |
| Mode M9 | |||
|---|---|---|---|
| Quadrant | BADHDUFLAG | Total packets | Discarded packets |
| A | 0 | 15 | 0 |
| B | 0 | 15 | 0 |
| C | 0 | 15 | 0 |
| D | 0 | 15 | 0 |
| Quadrant | Total seconds | Saturated seconds | Saturation percentage |
|---|---|---|---|
| A | 7296 | 116 | 1.589912% |
| B | 7296 | 89 | 1.219846% |
| C | 7296 | 138 | 1.891447% |
| D | 7296 | 42 | 0.575658% |
Noise dominated data is calculated using 1-second bins in cleaned event files. If a bin has >2000 counts, and if more than 50% of those come from <1% of pixels, then it is considered to be noise-dominated and hence unusable.
| Quadrant | # 1 sec bins | Bins with >0 counts | Bins with >2000 counts | High rate bins dominated by noise | Noise dominated (total time) | Noise dominated (detector-on time) | Marked lightcurve |
|---|---|---|---|---|---|---|---|
| A | 8702 | 7299 | 84 | 84 | 0.97% | 1.15% | 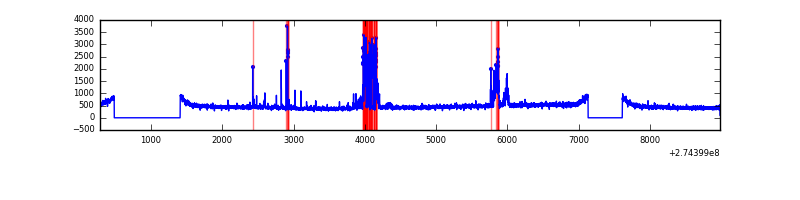 |
| B | 8702 | 7299 | 2 | 2 | 0.02% | 0.03% | 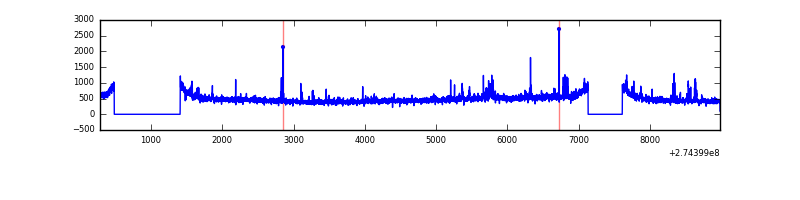 |
| C | 8702 | 7299 | 15 | 15 | 0.17% | 0.21% | 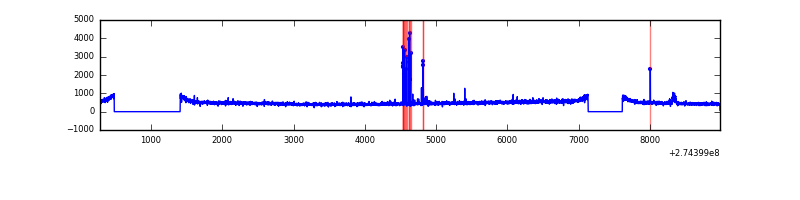 |
| D | 8702 | 7299 | 5 | 5 | 0.06% | 0.07% | 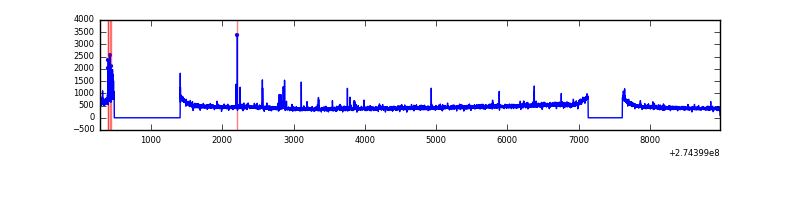 |
Top three noisy pixels from each quadrant. If the there are fewer than three noisy pixels in the level2.evt file, extra rows are filled as -1
| Pixel properties | Quadrant properties | ||||||
|---|---|---|---|---|---|---|---|
| Quadrant | DetID | PixID | Counts | Sigma | Mean | Median | Sigma |
| A | 15 | 239 | 409097 | 2327.28 | 867 | 849 | 175.4 |
| A | 0 | 226 | 7634 | 38.68 | 867 | 849 | 175.4 |
| A | 12 | 194 | 6325 | 31.22 | 867 | 849 | 175.4 |
| B | 15 | 222 | 77141 | 453.99 | 878 | 855 | 168.0 |
| B | 10 | 245 | 47561 | 277.95 | 878 | 855 | 168.0 |
| B | 4 | 173 | 37005 | 215.13 | 878 | 855 | 168.0 |
| C | 14 | 238 | 129724 | 647.53 | 844 | 847 | 199.0 |
| C | 9 | 236 | 85661 | 426.14 | 844 | 847 | 199.0 |
| C | 0 | 207 | 32393 | 158.5 | 844 | 847 | 199.0 |
| D | 12 | 218 | 48525 | 231.65 | 849 | 823 | 205.9 |
| D | 10 | 70 | 36827 | 174.84 | 849 | 823 | 205.9 |
| D | 2 | 234 | 31932 | 151.07 | 849 | 823 | 205.9 |
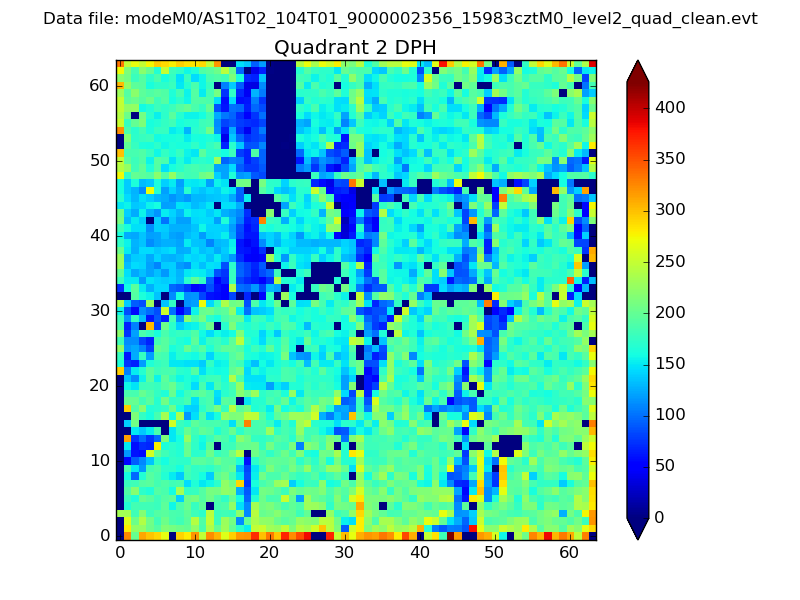
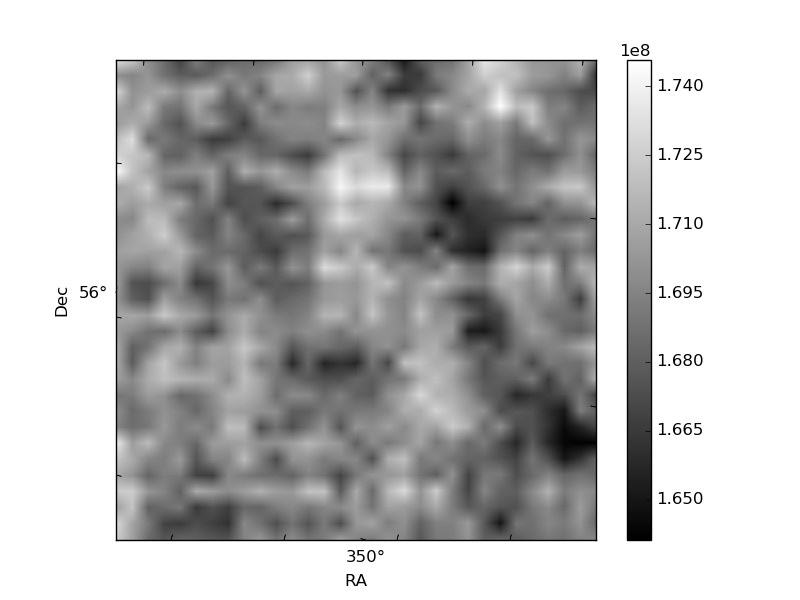
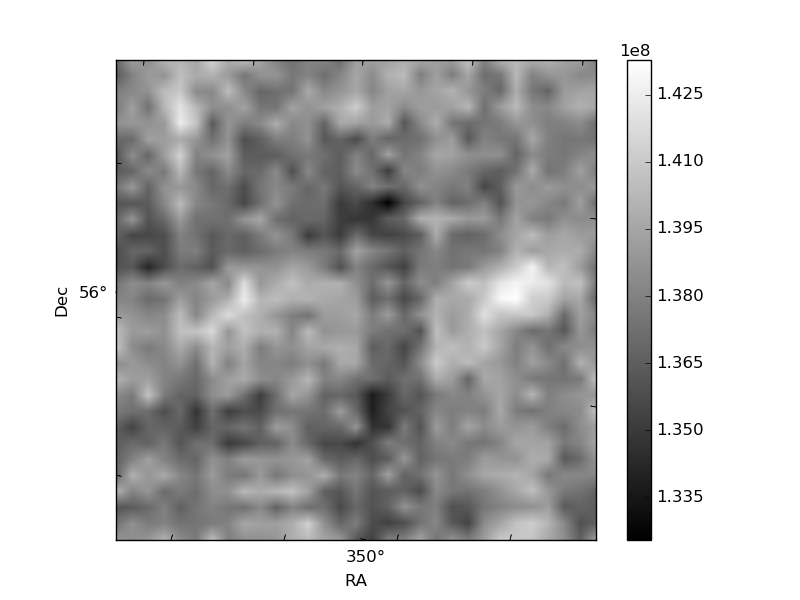
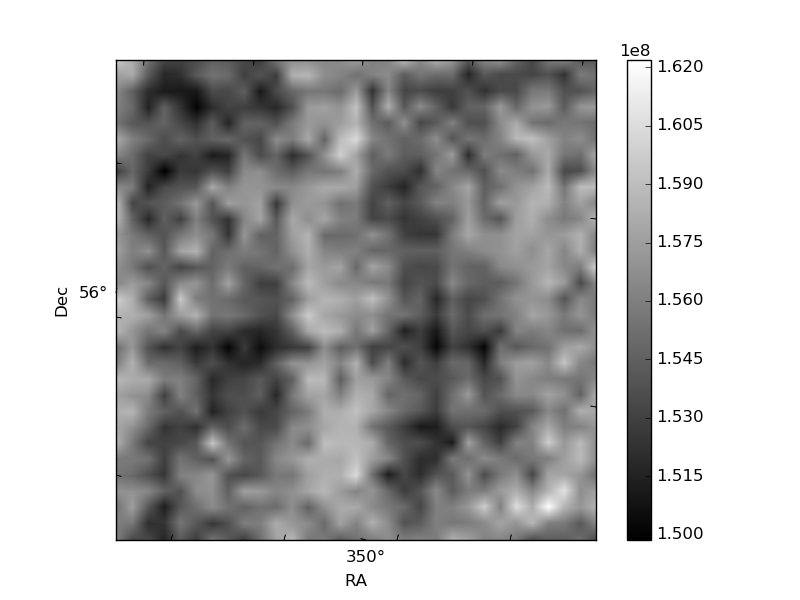
Histogram calculated using DETX and DETY for each event in the final _common_clean file
| Quadrant A | 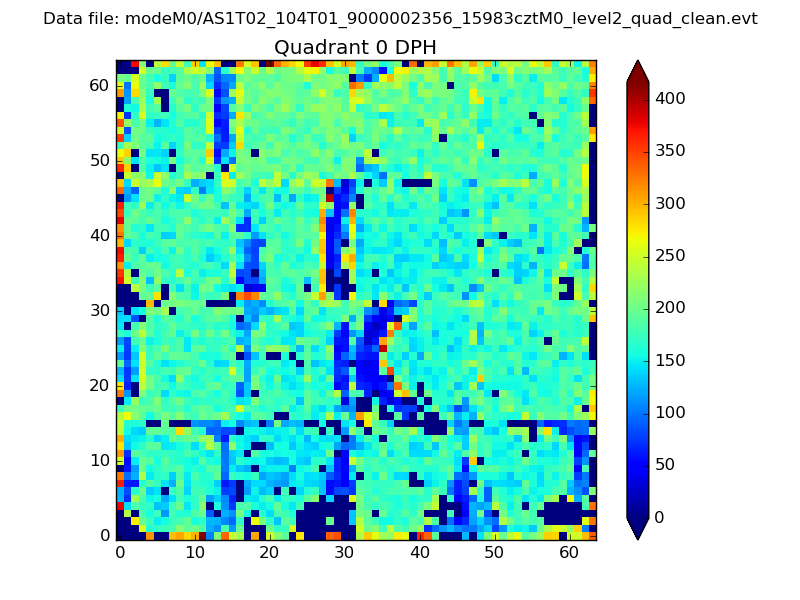 |
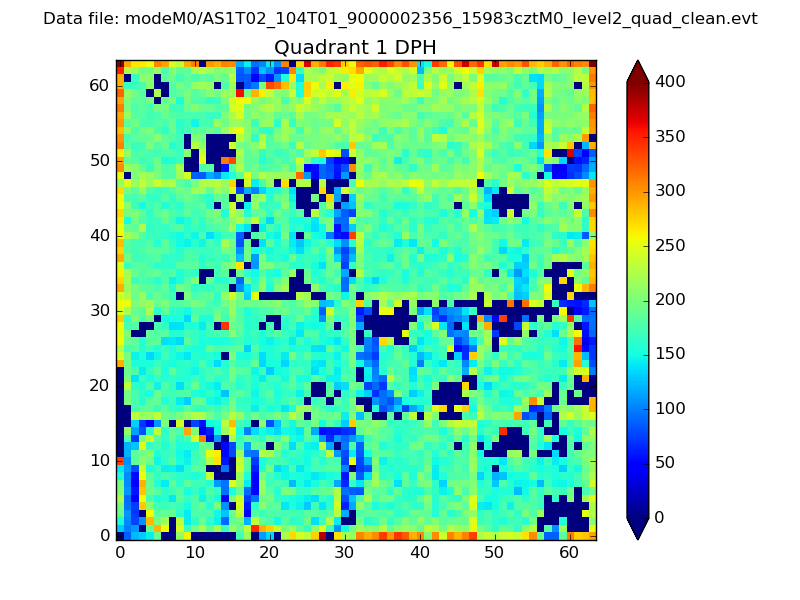 |
Quadrant B |
|---|---|---|---|
| Quadrant D | 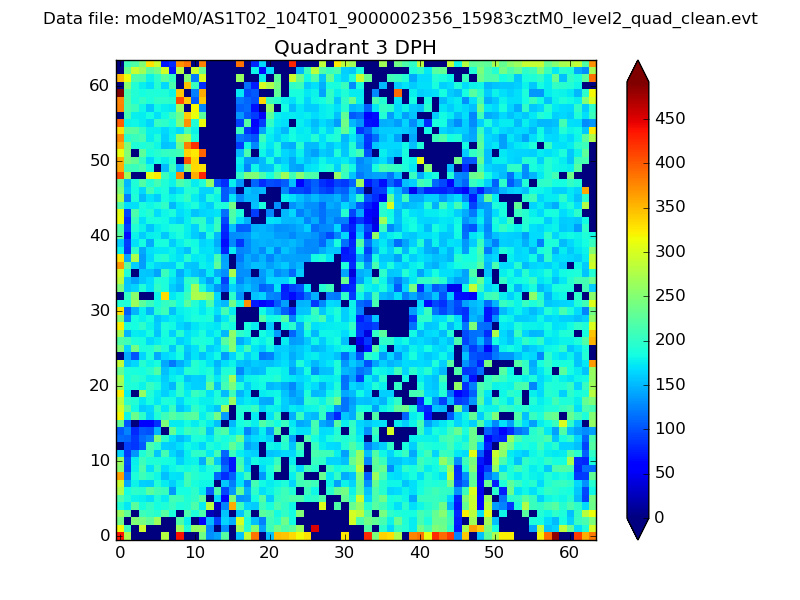 |
 |
Quadrant C |
| Plot type | Count rate plots | Images |
|---|---|---|
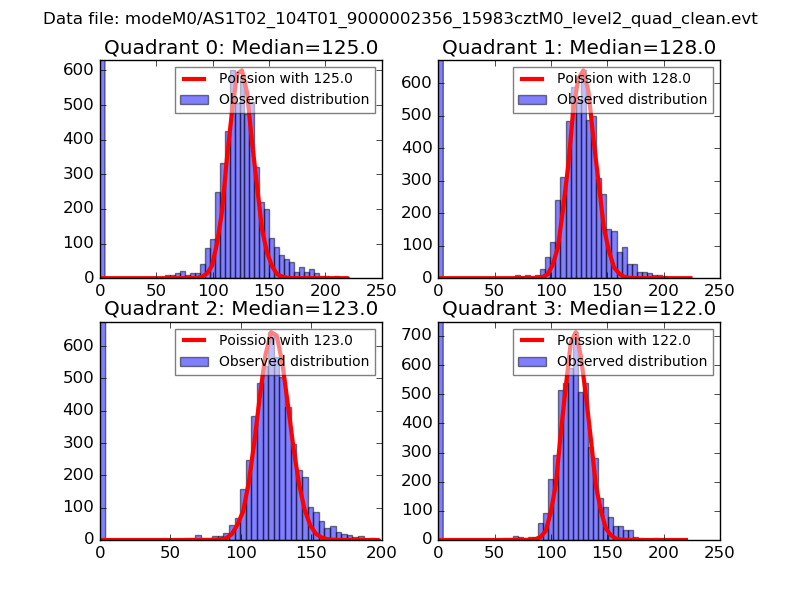
| Comparison with Poisson distribution Blue bars denote a histogram of data divided into 1 sec bins. Red curve is a Poisson curve with rate = median count rate of data. |
 |
 |
| Quadrant-wise count rates Data is divided into 100 sec bins |
 |
|
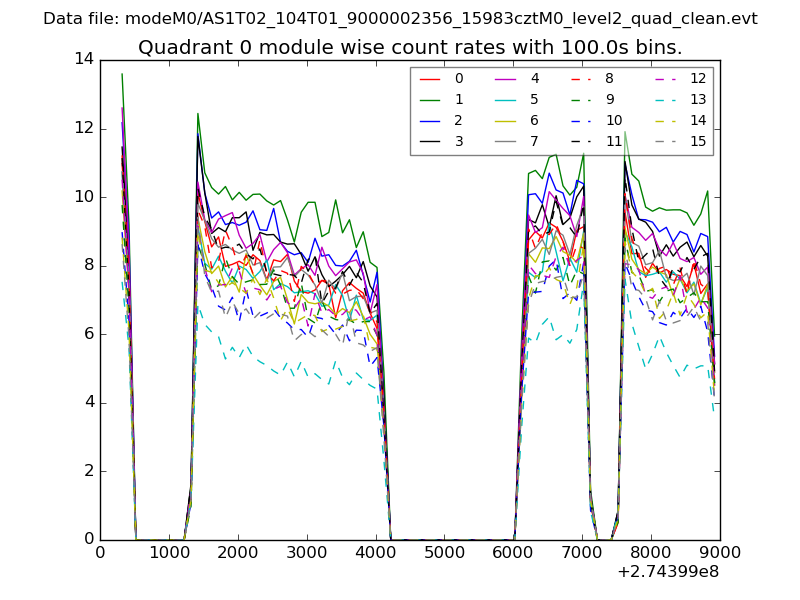
| Module-wise count rates for Quadrant A Data is divided into 100 sec bins |
 |
 |
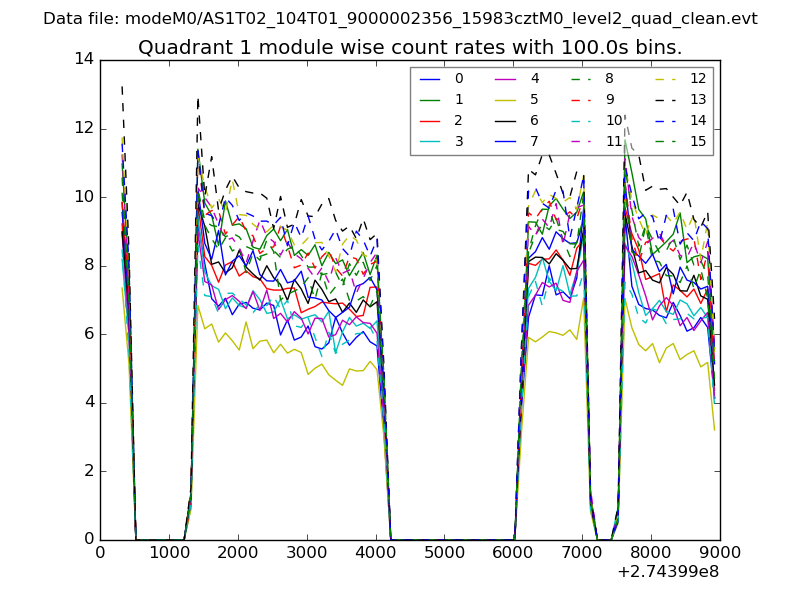
| Module-wise count rates for Quadrant B Data is divided into 100 sec bins |
 |
 |
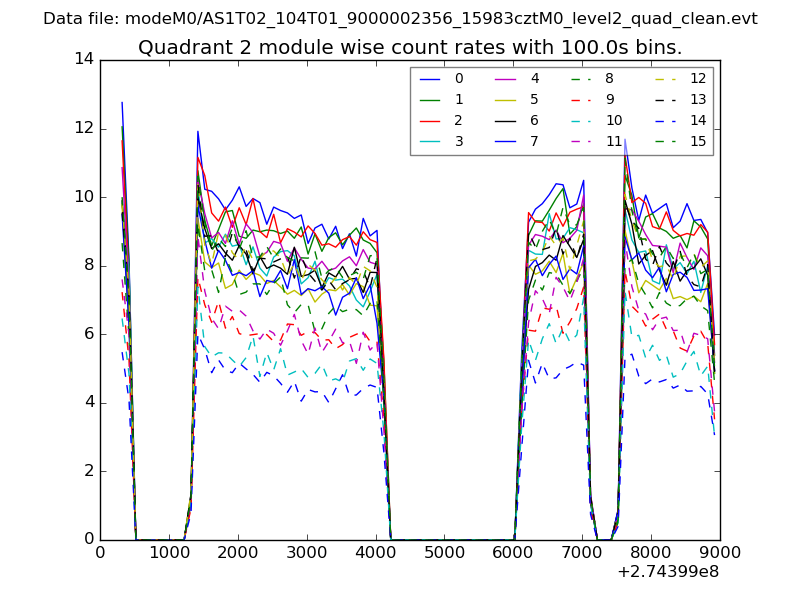
| Module-wise count rates for Quadrant C Data is divided into 100 sec bins |
 |
 |
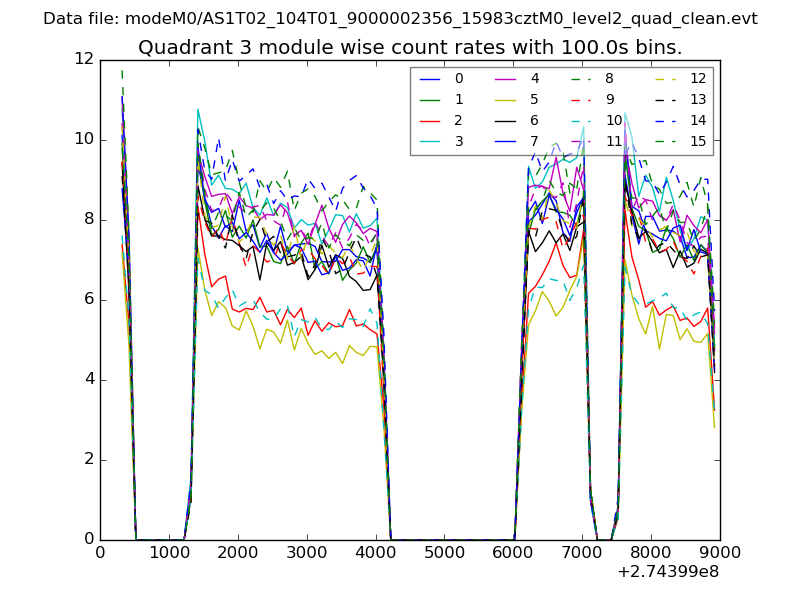
| Module-wise count rates for Quadrant D Data is divided into 100 sec bins |
 |
 |
| Parameter | Plot |
|---|---|
| CZT HV Monitor | 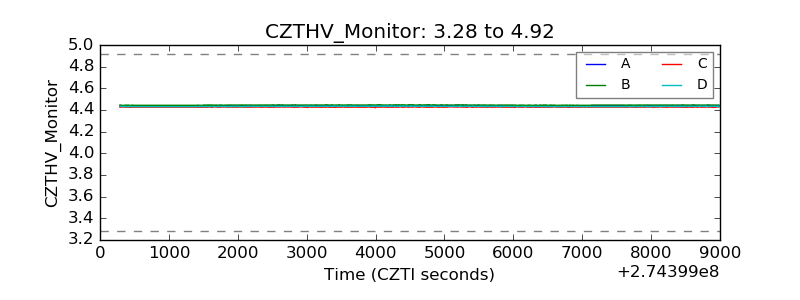 |
| D_VDD | 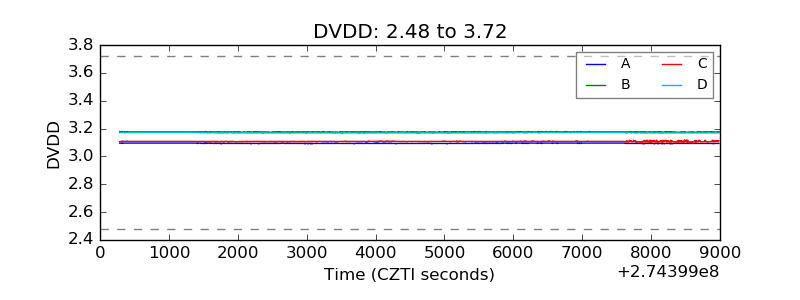 |
| Temperature 1 | 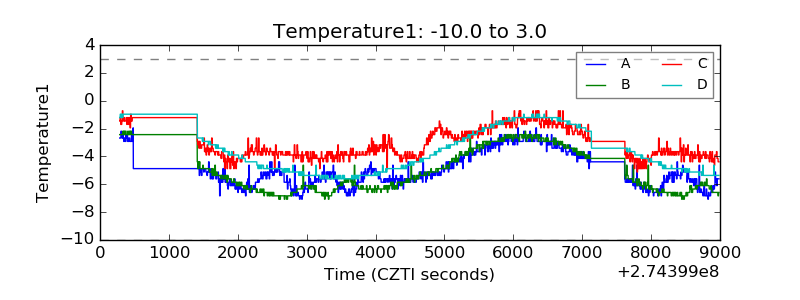 |
| Veto HV Monitor | 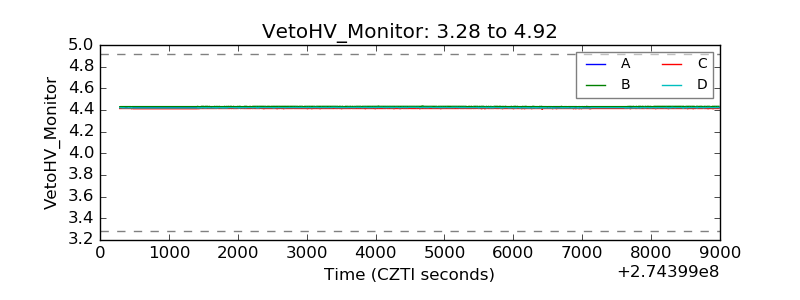 |
| Veto LLD |  |
| Alpha Counter |  |
| _CPM_Rate | 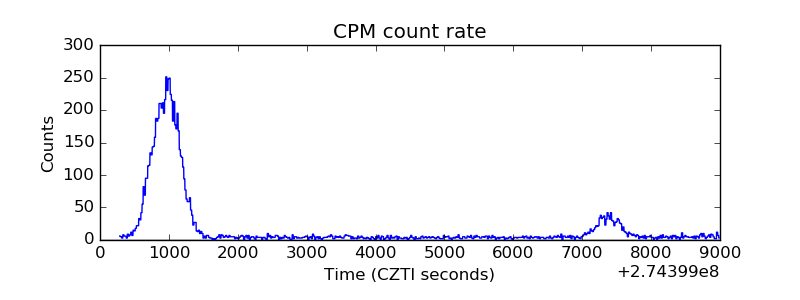 |
| CZT Counter | 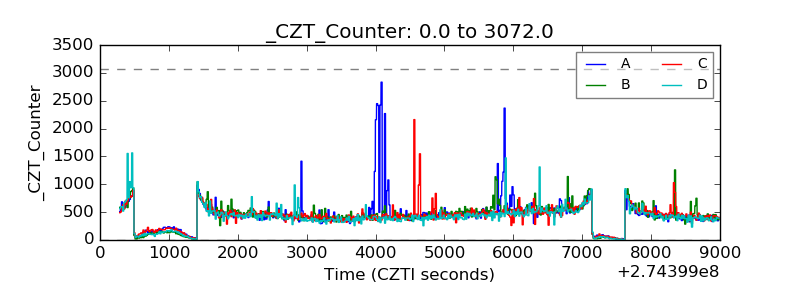 |
| +2.5 Volts monitor |  |
| +5 Volts monitor |  |
| _ROLL_ROT | 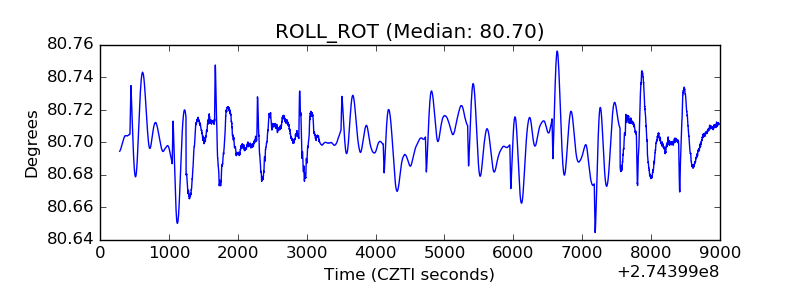 |
| _Roll_DEC | 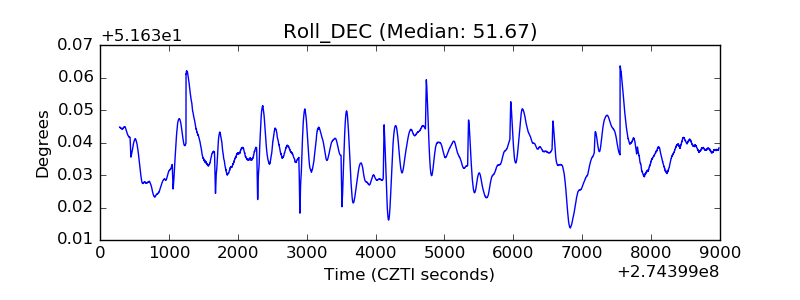 |
| _Roll_RA | 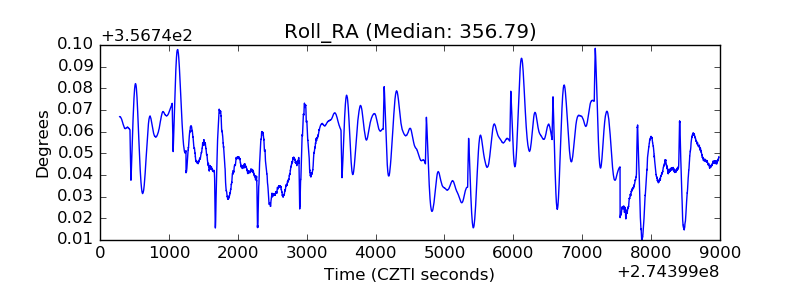 |
| Veto Counter | 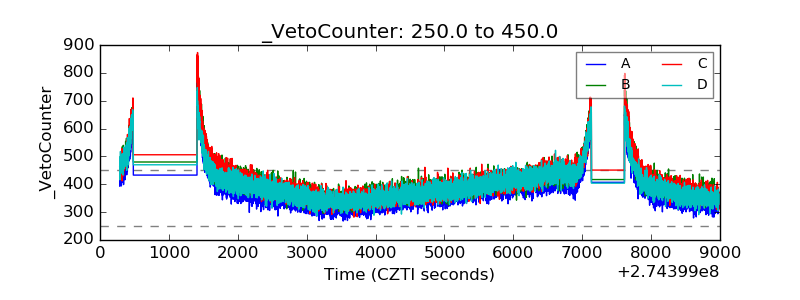 |