| Param | Original file | Final file |
|---|---|---|
| Filename | modeM0/AS1T02_104T01_9000002356_15985cztM0_level2.evt | modeM0/AS1T02_104T01_9000002356_15985cztM0_level2_quad_clean.evt |
| Size (bytes) | 34,277,760 | 10,944,000 |
| Size | 32.7 MB | 10.4 MB |
| Events in quadrant A | 241,788 | 70,274 |
| Events in quadrant B | 262,651 | 72,173 |
| Events in quadrant C | 258,468 | 69,998 |
| Events in quadrant D | 230,854 | 68,842 |
| Mode SS | |||
|---|---|---|---|
| Quadrant | BADHDUFLAG | Total packets | Discarded packets |
| A | 0 | 12 | 0 |
| B | 0 | 12 | 0 |
| C | 0 | 12 | 0 |
| D | 0 | 12 | 0 |
| Mode M0 | |||
|---|---|---|---|
| Quadrant | BADHDUFLAG | Total packets | Discarded packets |
| A | 0 | 1197 | 0 |
| B | 0 | 1213 | 0 |
| C | 0 | 1199 | 0 |
| D | 0 | 1196 | 0 |
| Quadrant | Total seconds | Saturated seconds | Saturation percentage |
|---|---|---|---|
| A | 598 | 0 | 0.000000% |
| B | 598 | 1 | 0.167224% |
| C | 598 | 2 | 0.334448% |
| D | 598 | 0 | 0.000000% |
Noise dominated data is calculated using 1-second bins in cleaned event files. If a bin has >2000 counts, and if more than 50% of those come from <1% of pixels, then it is considered to be noise-dominated and hence unusable.
| Quadrant | # 1 sec bins | Bins with >0 counts | Bins with >2000 counts | High rate bins dominated by noise | Noise dominated (total time) | Noise dominated (detector-on time) | Marked lightcurve |
|---|---|---|---|---|---|---|---|
| A | 599 | 599 | 0 | 0 | 0.00% | 0.00% | 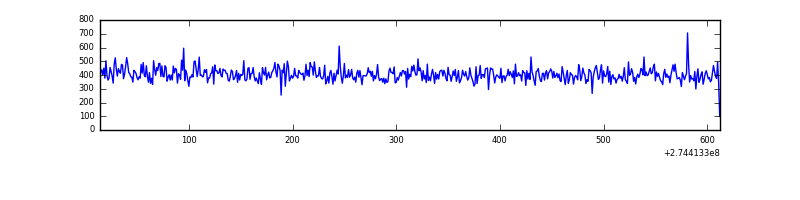 |
| B | 599 | 599 | 0 | 0 | 0.00% | 0.00% | 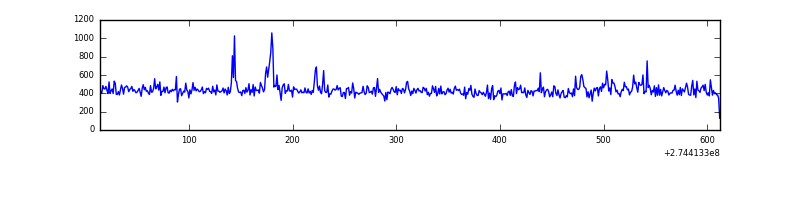 |
| C | 599 | 599 | 0 | 0 | 0.00% | 0.00% | 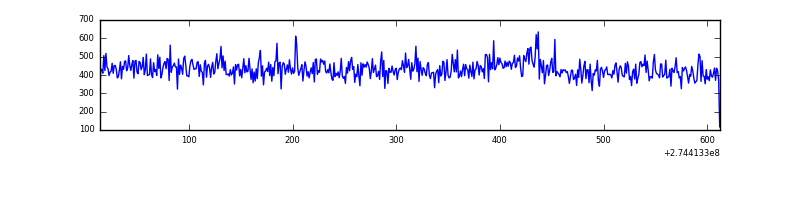 |
| D | 599 | 599 | 0 | 0 | 0.00% | 0.00% | 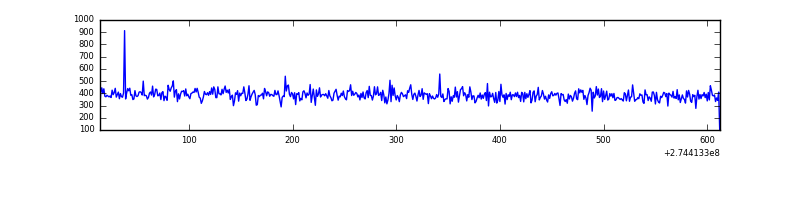 |
Top three noisy pixels from each quadrant. If the there are fewer than three noisy pixels in the level2.evt file, extra rows are filled as -1
| Pixel properties | Quadrant properties | ||||||
|---|---|---|---|---|---|---|---|
| Quadrant | DetID | PixID | Counts | Sigma | Mean | Median | Sigma |
| A | 0 | 226 | 535 | 31.99 | 62 | 61 | 14.8 |
| A | 3 | 137 | 456 | 26.66 | 62 | 61 | 14.8 |
| A | 12 | 194 | 400 | 22.88 | 62 | 61 | 14.8 |
| B | 4 | 173 | 7367 | 493.41 | 64 | 63 | 14.8 |
| B | 0 | 189 | 3442 | 228.26 | 64 | 63 | 14.8 |
| B | 12 | 111 | 1502 | 97.21 | 64 | 63 | 14.8 |
| C | 14 | 238 | 9580 | 577.55 | 62 | 62 | 16.5 |
| C | 10 | 22 | 3395 | 202.24 | 62 | 62 | 16.5 |
| C | 3 | 233 | 1005 | 57.22 | 62 | 62 | 16.5 |
| D | 2 | 234 | 2685 | 154.55 | 61 | 59 | 17.0 |
| D | 14 | 226 | 558 | 29.37 | 61 | 59 | 17.0 |
| D | 2 | 120 | 551 | 28.96 | 61 | 59 | 17.0 |
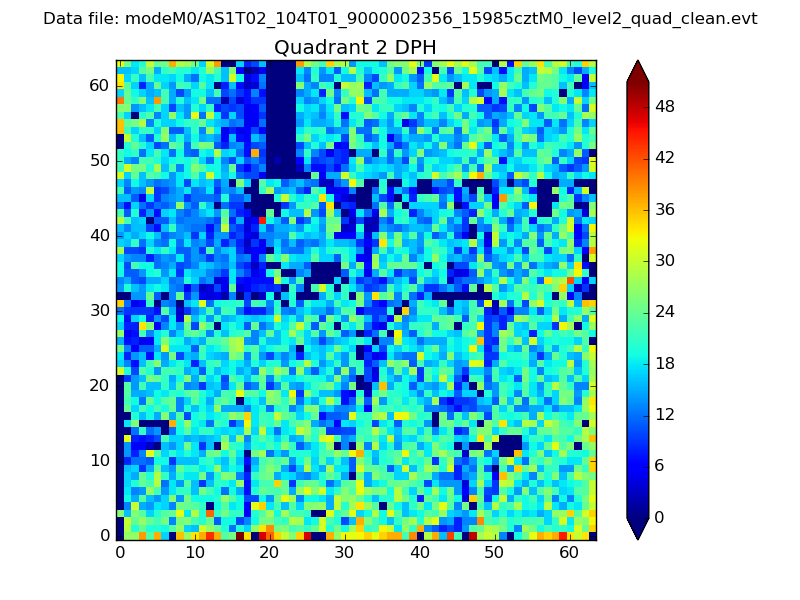
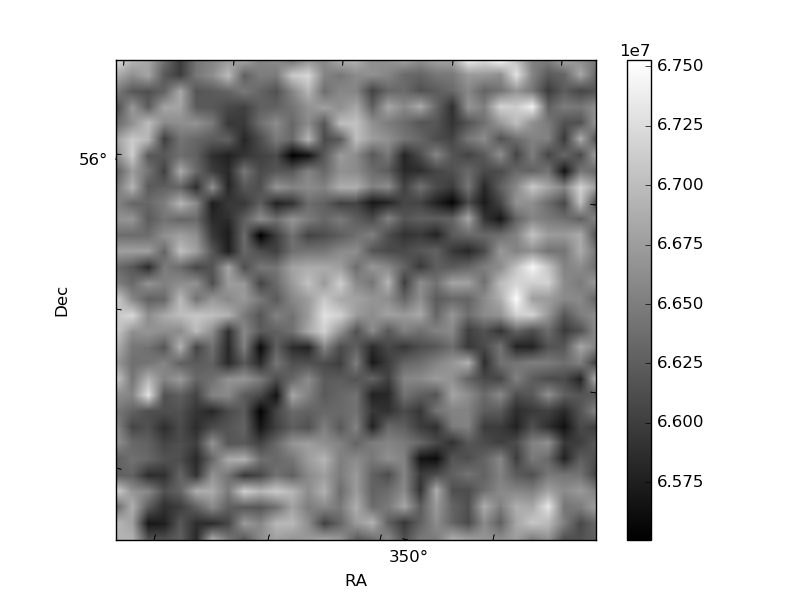
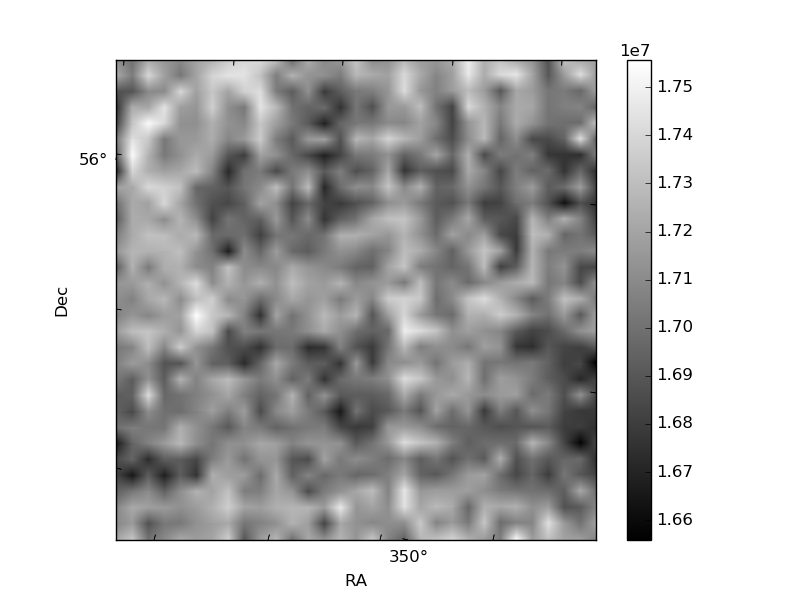
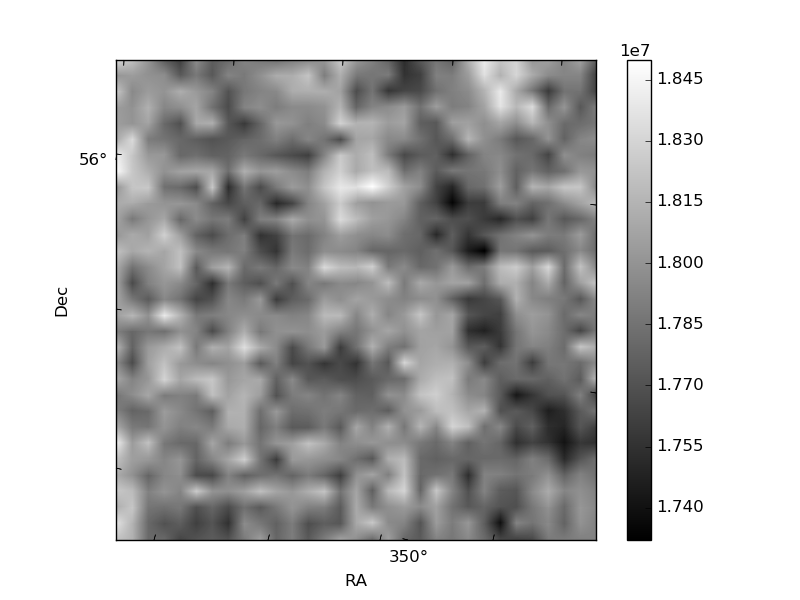
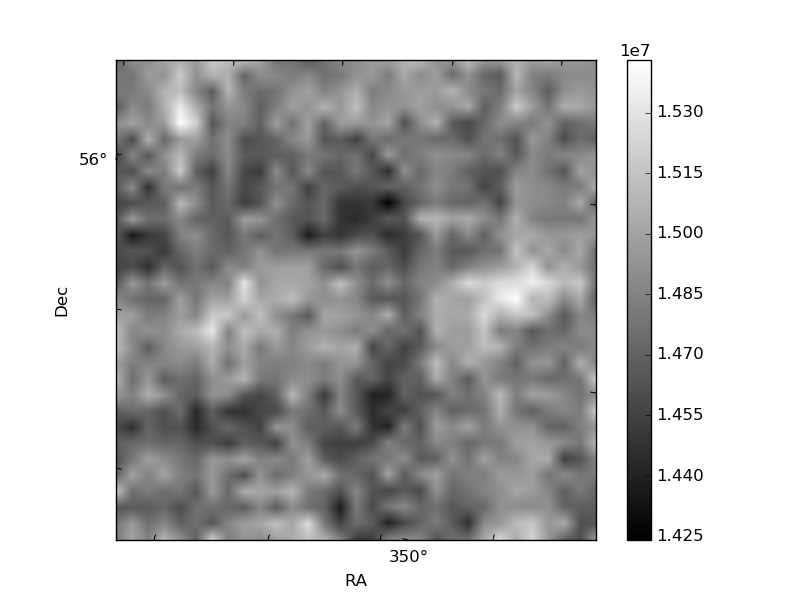
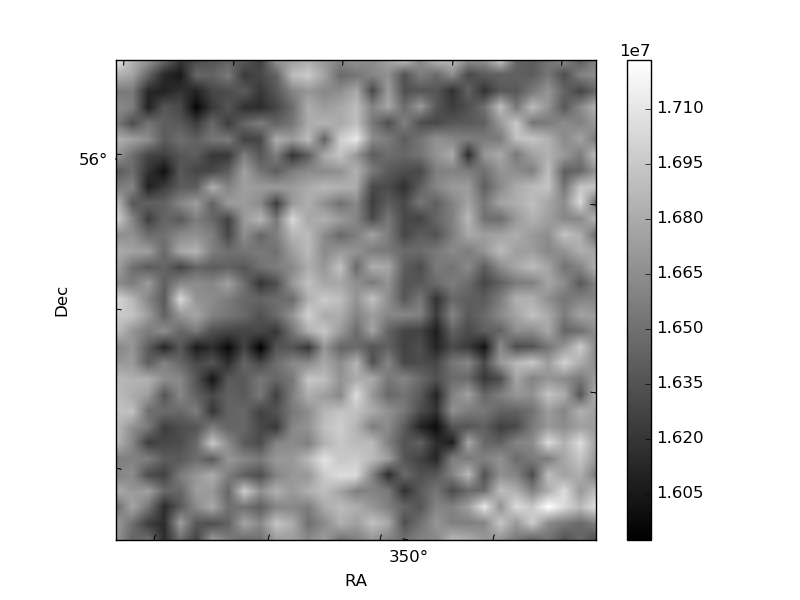
Histogram calculated using DETX and DETY for each event in the final _common_clean file
| Quadrant A | 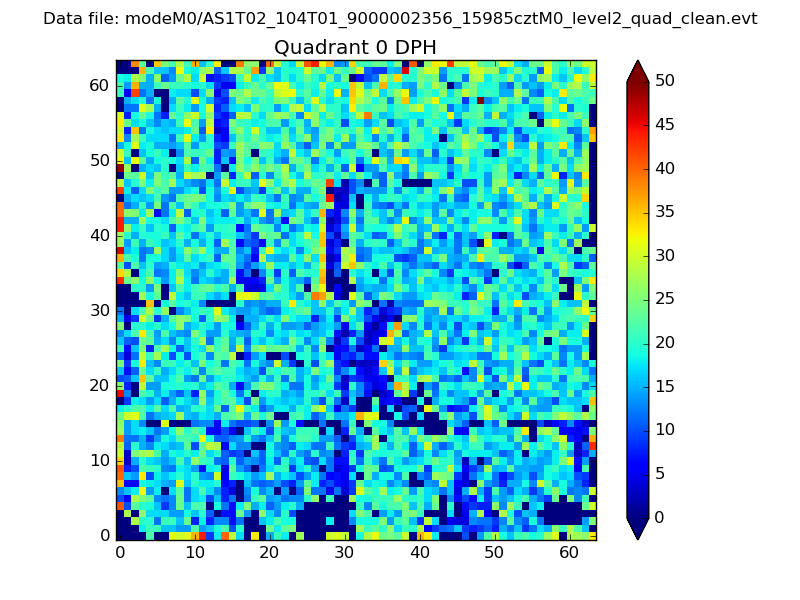 |
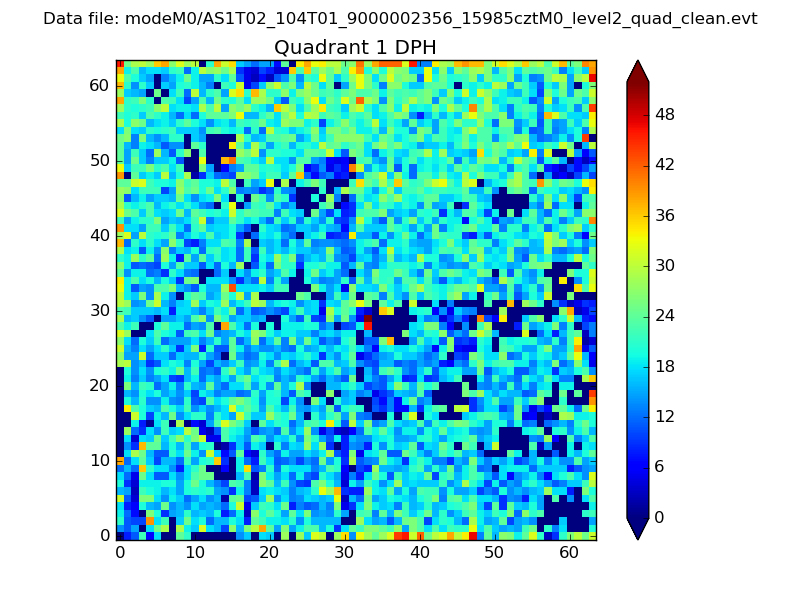 |
Quadrant B |
|---|---|---|---|
| Quadrant D | 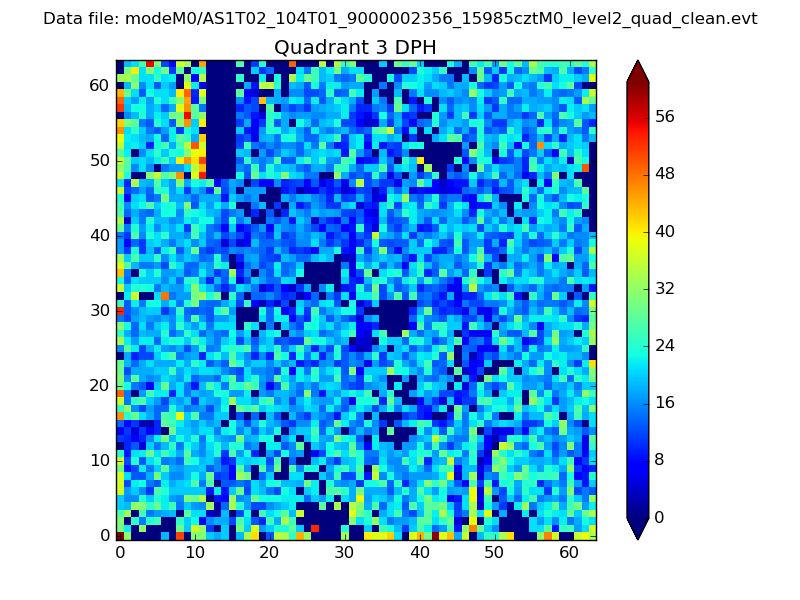 |
 |
Quadrant C |
| Plot type | Count rate plots | Images |
|---|---|---|
| Comparison with Poisson distribution Blue bars denote a histogram of data divided into 1 sec bins. Red curve is a Poisson curve with rate = median count rate of data. |
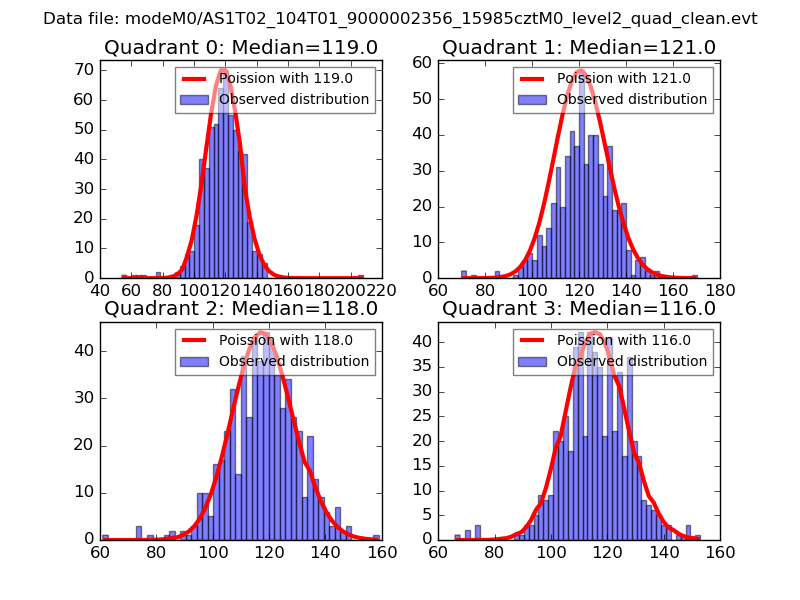 |
 |
| Quadrant-wise count rates Data is divided into 100 sec bins |
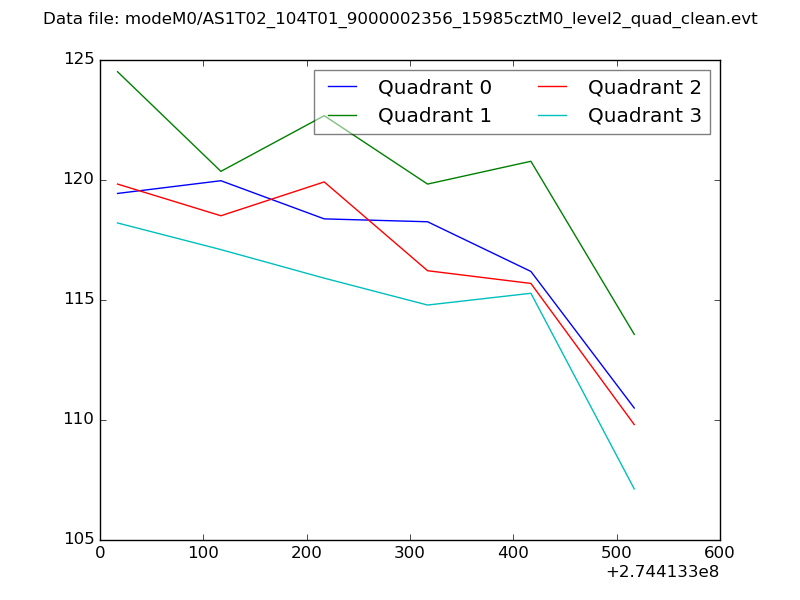 |
|
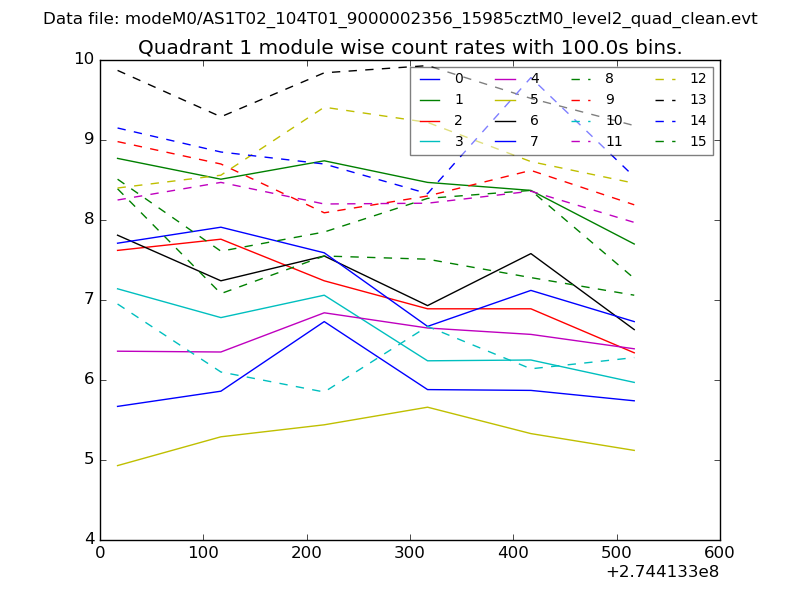
| Module-wise count rates for Quadrant A Data is divided into 100 sec bins |
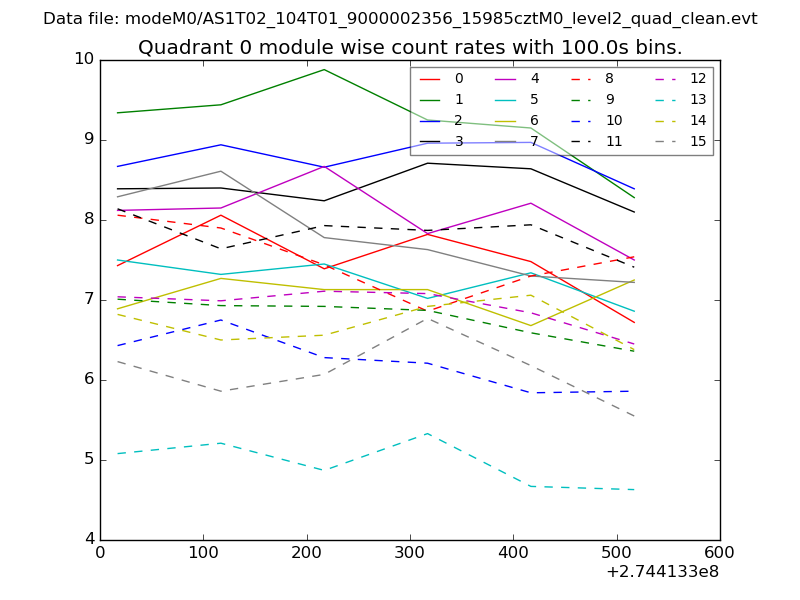 |
 |
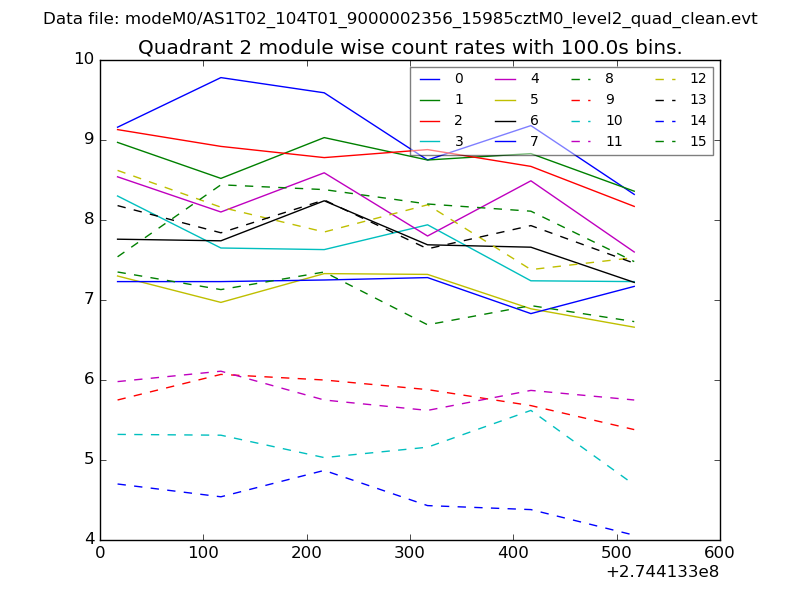
| Module-wise count rates for Quadrant B Data is divided into 100 sec bins |
 |
 |
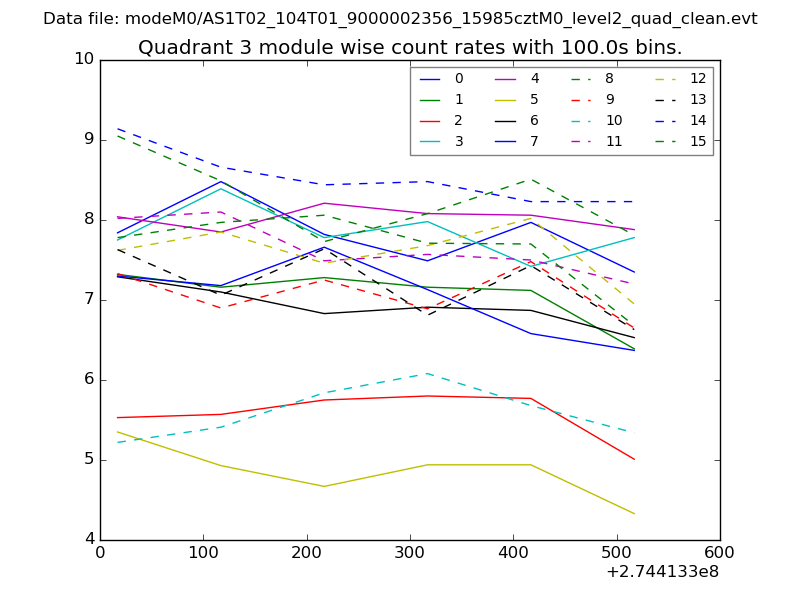
| Module-wise count rates for Quadrant C Data is divided into 100 sec bins |
 |
 |
| Module-wise count rates for Quadrant D Data is divided into 100 sec bins |
 |
 |
| Parameter | Plot |
|---|---|
| CZT HV Monitor | 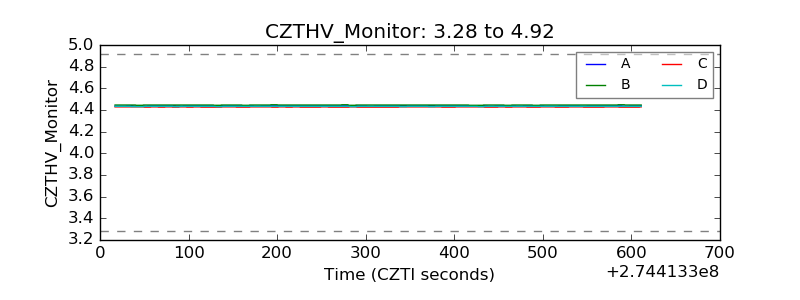 |
| D_VDD | 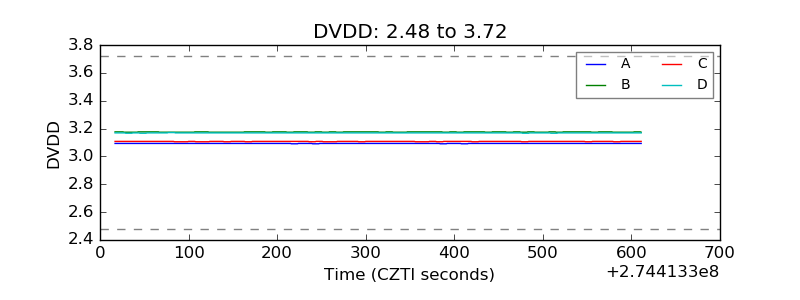 |
| Temperature 1 | 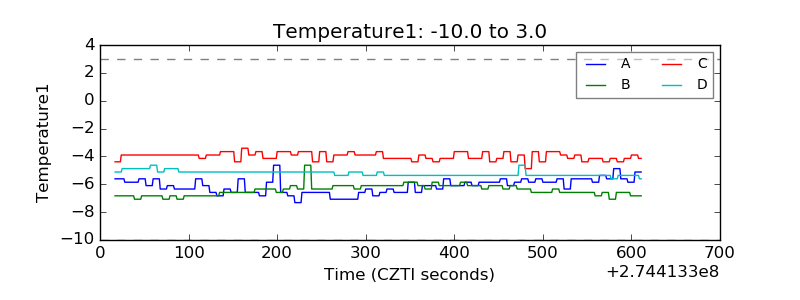 |
| Veto HV Monitor | 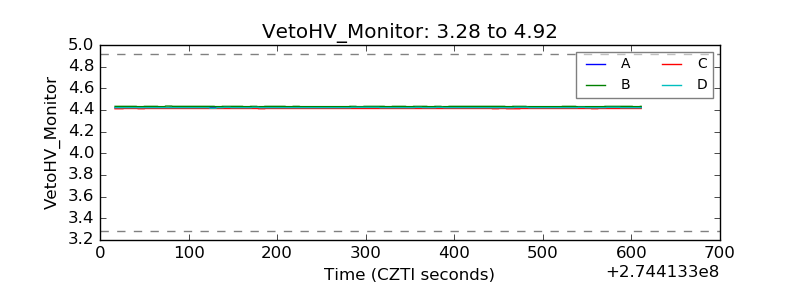 |
| Veto LLD | 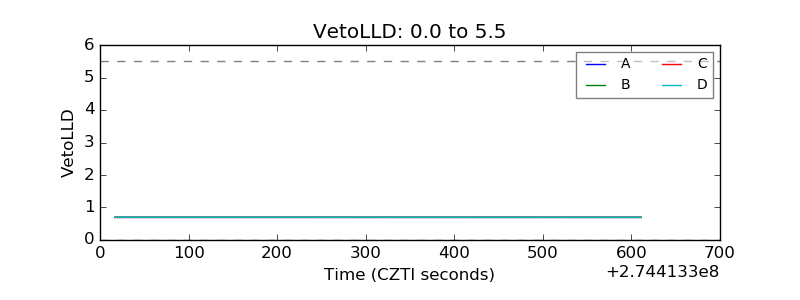 |
| Alpha Counter | 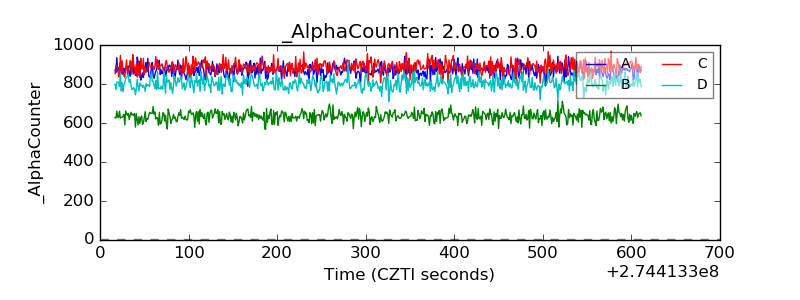 |
| _CPM_Rate | 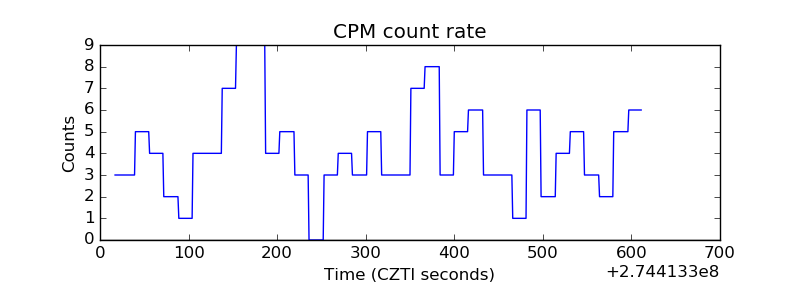 |
| CZT Counter | 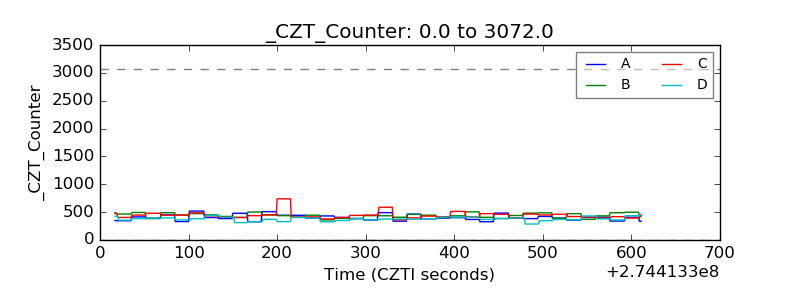 |
| +2.5 Volts monitor |  |
| +5 Volts monitor |  |
| _ROLL_ROT | 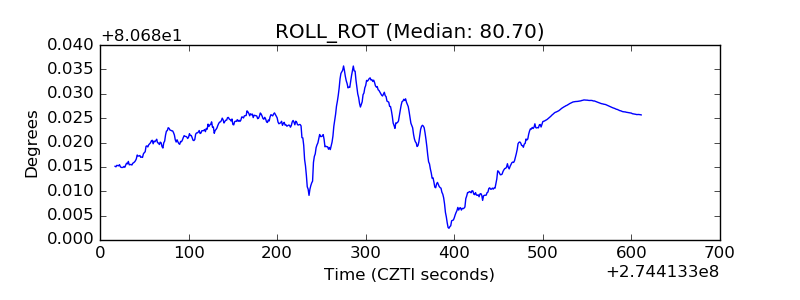 |
| _Roll_DEC | 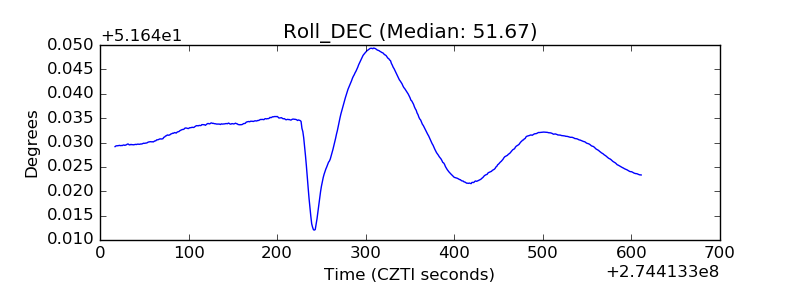 |
| _Roll_RA | 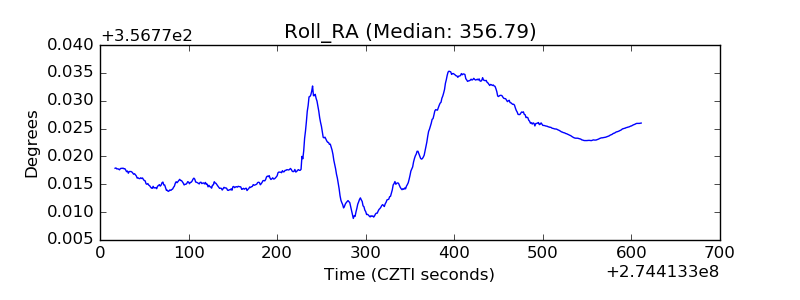 |
| Veto Counter | 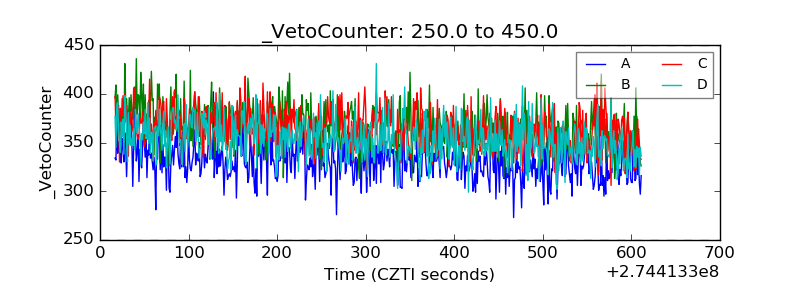 |