| Param | Original file | Final file |
|---|---|---|
| Filename | modeM0/AS1G08_046T09_9000002358cztM0_level2.fits | modeM0/AS1G08_046T09_9000002358cztM0_level2_quad_clean.evt |
| Size (bytes) | 328,996,800 | 356,437,440 |
| Size | 313.8 MB | 339.9 MB |
| Events in quadrant A | 1,979,236 | 2,176,366 |
| Events in quadrant B | 1,894,876 | 2,169,257 |
| Events in quadrant C | 1,929,056 | 2,061,236 |
| Events in quadrant D | 1,701,176 | 1,928,755 |
| Mode M0 | |||
|---|---|---|---|
| Quadrant | BADHDUFLAG | Total packets | Discarded packets |
| A | 0 | 76404 | 0 |
| B | 0 | 78105 | 0 |
| C | 0 | 73256 | 0 |
| D | 0 | 75380 | 0 |
| Mode M9 | |||
|---|---|---|---|
| Quadrant | BADHDUFLAG | Total packets | Discarded packets |
| A | 0 | 43 | 0 |
| B | 0 | 43 | 0 |
| C | 0 | 43 | 0 |
| D | 0 | 43 | 0 |
| Mode SS | |||
|---|---|---|---|
| Quadrant | BADHDUFLAG | Total packets | Discarded packets |
| A | 0 | 726 | 0 |
| B | 0 | 726 | 0 |
| C | 0 | 726 | 0 |
| D | 0 | 726 | 0 |
| Quadrant | Total seconds | Saturated seconds | Saturation percentage |
|---|---|---|---|
| A | 35806 | 757 | 2.114171% |
| B | 35806 | 591 | 1.650561% |
| C | 35806 | 455 | 1.270737% |
| D | 35806 | 426 | 1.189745% |
Noise dominated data is calculated using 1-second bins in cleaned event files. If a bin has >2000 counts, and if more than 50% of those come from <1% of pixels, then it is considered to be noise-dominated and hence unusable.
| Quadrant | # 1 sec bins | Bins with >0 counts | Bins with >2000 counts | High rate bins dominated by noise | Noise dominated (total time) | Noise dominated (detector-on time) | Marked lightcurve |
|---|---|---|---|---|---|---|---|
| A | 39981 | 35798 | 0 | 0 | 0.00% | 0.00% |  |
| B | 39981 | 35800 | 0 | 0 | 0.00% | 0.00% | 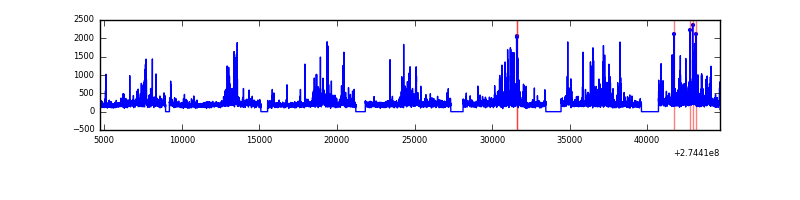 |
| C | 39981 | 35801 | 0 | 0 | 0.00% | 0.00% | 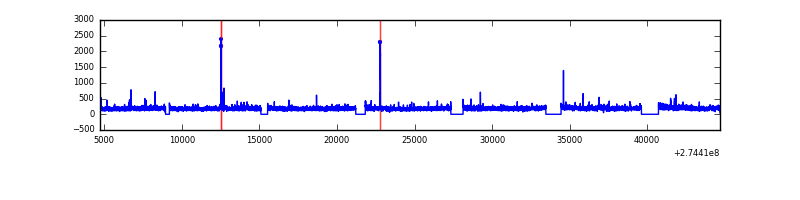 |
| D | 39981 | 35796 | 0 | 0 | 0.00% | 0.00% | 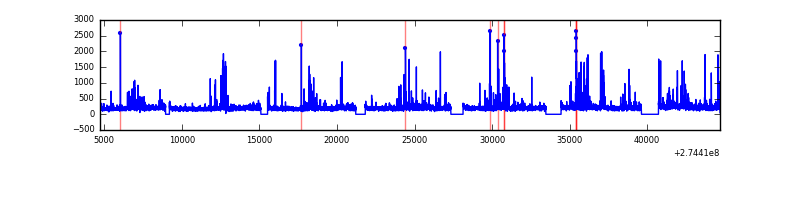 |
Top three noisy pixels from each quadrant. If the there are fewer than three noisy pixels in the level2.evt file, extra rows are filled as -1
| Pixel properties | Quadrant properties | ||||||
|---|---|---|---|---|---|---|---|
| Quadrant | DetID | PixID | Counts | Sigma | Mean | Median | Sigma |
| A | 0 | 29 | 1895 | 10.87 | 515 | 482 | 130.0 |
| A | 7 | 110 | 1584 | 8.47 | 515 | 482 | 130.0 |
| A | 0 | 30 | 1466 | 7.57 | 515 | 482 | 130.0 |
| B | 2 | 9 | 1501 | 10.05 | 502 | 478 | 101.8 |
| B | 14 | 254 | 1292 | 8.0 | 502 | 478 | 101.8 |
| B | 3 | 17 | 1268 | 7.76 | 502 | 478 | 101.8 |
| C | 12 | 241 | 1346 | 6.58 | 510 | 473 | 132.7 |
| C | 3 | 126 | 1291 | 6.17 | 510 | 473 | 132.7 |
| C | 2 | 191 | 1288 | 6.14 | 510 | 473 | 132.7 |
| D | 6 | 231 | 1266 | 6.26 | 486 | 440 | 132.0 |
| D | 3 | 14 | 1254 | 6.16 | 486 | 440 | 132.0 |
| D | 6 | 67 | 1215 | 5.87 | 486 | 440 | 132.0 |
Histogram calculated using DETX and DETY for each event in the final _common_clean file
| Quadrant A | 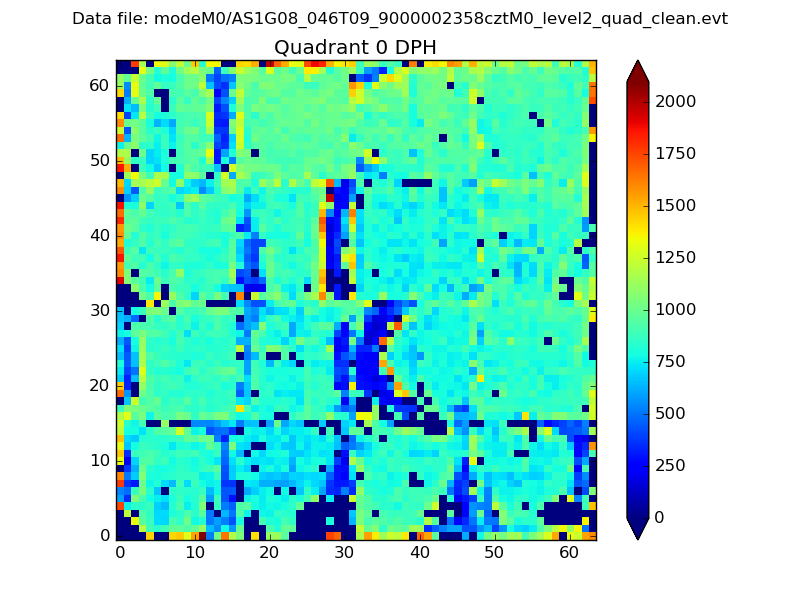 |
 |
Quadrant B |
|---|---|---|---|
| Quadrant D | 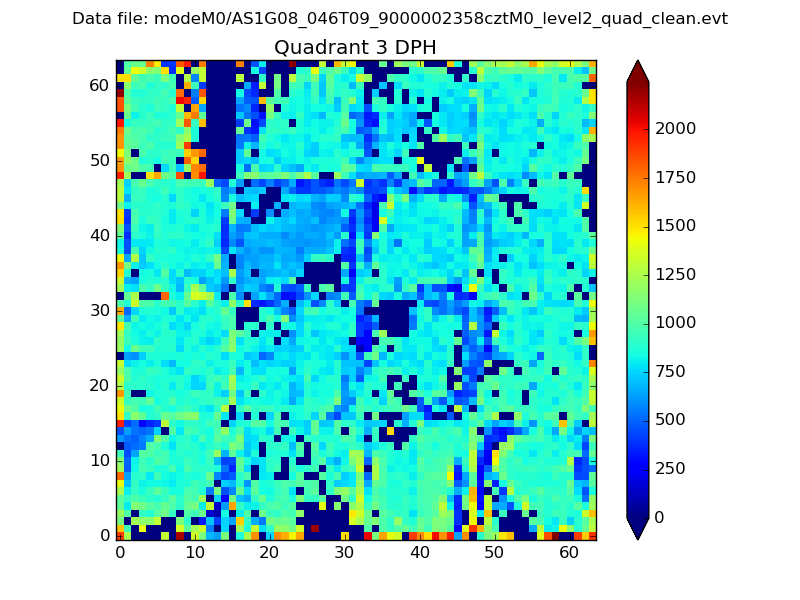 |
 |
Quadrant C |
| Plot type | Count rate plots | Images |
|---|---|---|
| Comparison with Poisson distribution Blue bars denote a histogram of data divided into 1 sec bins. Red curve is a Poisson curve with rate = median count rate of data. |
 |
 |
| Quadrant-wise count rates Data is divided into 100 sec bins |
 |
|
| Module-wise count rates for Quadrant A Data is divided into 100 sec bins |
 |
 |
| Module-wise count rates for Quadrant B Data is divided into 100 sec bins |
 |
 |
| Module-wise count rates for Quadrant C Data is divided into 100 sec bins |
 |
 |
| Module-wise count rates for Quadrant D Data is divided into 100 sec bins |
 |
 |
| Parameter | Plot |
|---|---|
| CZT HV Monitor |  |
| D_VDD |  |
| Temperature 1 |  |
| Veto HV Monitor | 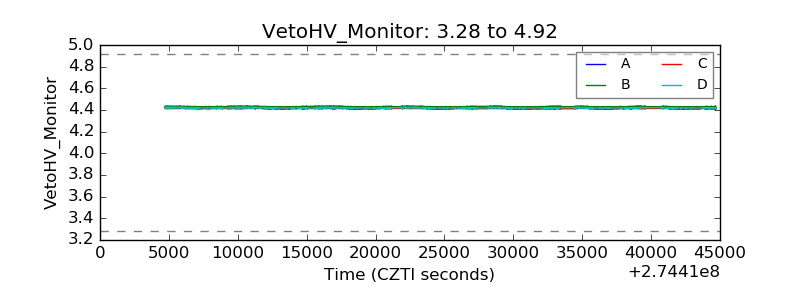 |
| Veto LLD |  |
| Alpha Counter |  |
| _CPM_Rate | 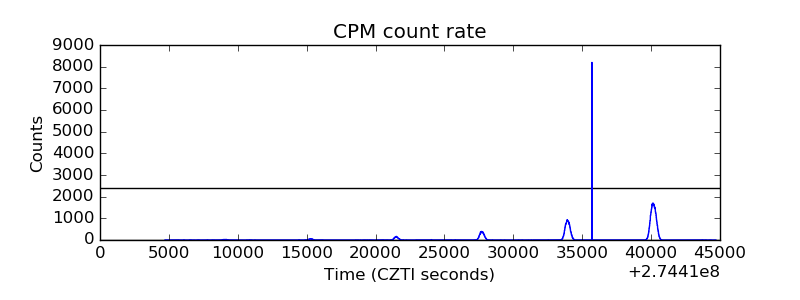 |
| CZT Counter |  |
| +2.5 Volts monitor |  |
| +5 Volts monitor |  |
| _ROLL_ROT |  |
| _Roll_DEC |  |
| _Roll_RA |  |
| Veto Counter | 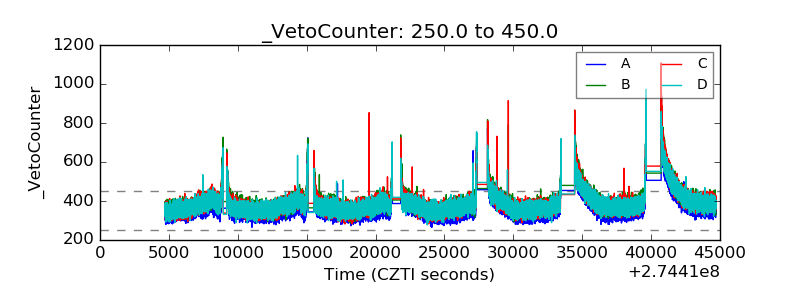 |