| Param | Original file | Final file |
|---|---|---|
| Filename | modeM0/AS1G08_046T09_9000002358_15985cztM0_level2.evt | modeM0/AS1G08_046T09_9000002358_15985cztM0_level2_quad_clean.evt |
| Size (bytes) | 372,623,040 | 75,588,480 |
| Size | 355.4 MB | 72.1 MB |
| Events in quadrant A | 2,702,365 | 477,536 |
| Events in quadrant B | 2,876,716 | 483,213 |
| Events in quadrant C | 2,703,455 | 462,004 |
| Events in quadrant D | 2,606,433 | 460,259 |
| Mode M0 | |||
|---|---|---|---|
| Quadrant | BADHDUFLAG | Total packets | Discarded packets |
| A | 0 | 12038 | 2 |
| B | 0 | 12404 | 1 |
| C | 0 | 11925 | 1 |
| D | 0 | 11978 | 1 |
| Mode M9 | |||
|---|---|---|---|
| Quadrant | BADHDUFLAG | Total packets | Discarded packets |
| A | 0 | 3 | 0 |
| B | 0 | 3 | 0 |
| C | 0 | 3 | 0 |
| D | 0 | 3 | 0 |
| Mode SS | |||
|---|---|---|---|
| Quadrant | BADHDUFLAG | Total packets | Discarded packets |
| A | 0 | 116 | 0 |
| B | 0 | 116 | 0 |
| C | 0 | 116 | 0 |
| D | 0 | 116 | 0 |
| Quadrant | Total seconds | Saturated seconds | Saturation percentage |
|---|---|---|---|
| A | 5815 | 124 | 2.132416% |
| B | 5815 | 131 | 2.252794% |
| C | 5815 | 124 | 2.132416% |
| D | 5815 | 68 | 1.169390% |
Noise dominated data is calculated using 1-second bins in cleaned event files. If a bin has >2000 counts, and if more than 50% of those come from <1% of pixels, then it is considered to be noise-dominated and hence unusable.
| Quadrant | # 1 sec bins | Bins with >0 counts | Bins with >2000 counts | High rate bins dominated by noise | Noise dominated (total time) | Noise dominated (detector-on time) | Marked lightcurve |
|---|---|---|---|---|---|---|---|
| A | 6066 | 5816 | 16 | 16 | 0.26% | 0.28% | 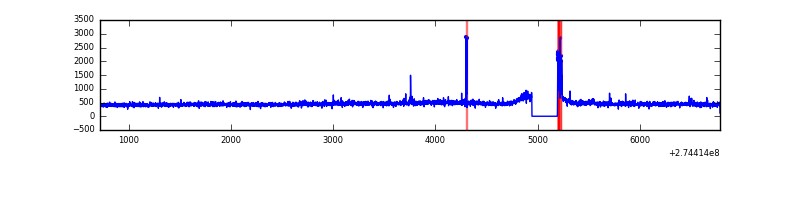 |
| B | 6066 | 5816 | 4 | 4 | 0.07% | 0.07% | 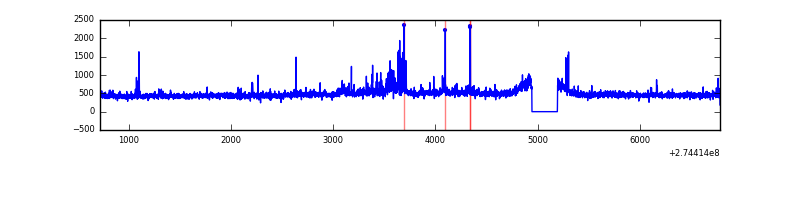 |
| C | 6066 | 5816 | 0 | 0 | 0.00% | 0.00% | 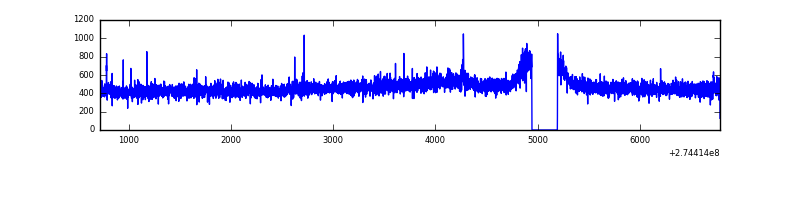 |
| D | 6066 | 5817 | 2 | 2 | 0.03% | 0.03% | 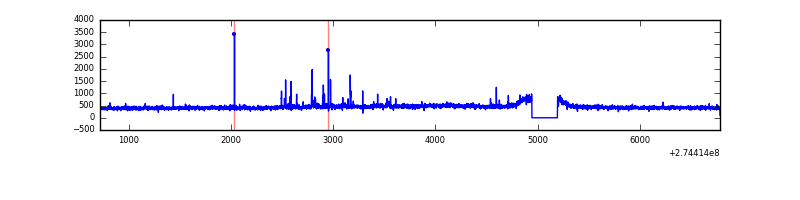 |
Top three noisy pixels from each quadrant. If the there are fewer than three noisy pixels in the level2.evt file, extra rows are filled as -1
| Pixel properties | Quadrant properties | ||||||
|---|---|---|---|---|---|---|---|
| Quadrant | DetID | PixID | Counts | Sigma | Mean | Median | Sigma |
| A | 15 | 239 | 74396 | 525.93 | 680 | 663 | 140.2 |
| A | 0 | 226 | 5954 | 37.74 | 680 | 663 | 140.2 |
| A | 12 | 96 | 5169 | 32.14 | 680 | 663 | 140.2 |
| B | 4 | 142 | 47890 | 357.45 | 683 | 662 | 132.1 |
| B | 4 | 173 | 27113 | 200.2 | 683 | 662 | 132.1 |
| B | 3 | 209 | 27018 | 199.48 | 683 | 662 | 132.1 |
| C | 14 | 238 | 101899 | 654.15 | 657 | 660 | 154.8 |
| C | 3 | 233 | 24609 | 154.74 | 657 | 660 | 154.8 |
| C | 9 | 236 | 11453 | 69.74 | 657 | 660 | 154.8 |
| D | 2 | 234 | 26712 | 160.26 | 667 | 647 | 162.6 |
| D | 10 | 70 | 24892 | 149.07 | 667 | 647 | 162.6 |
| D | 2 | 152 | 24664 | 147.67 | 667 | 647 | 162.6 |
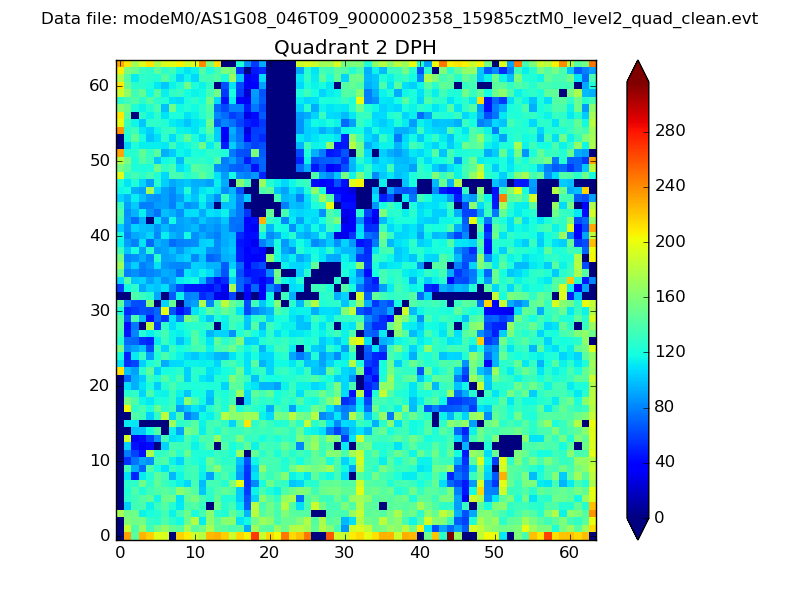
Histogram calculated using DETX and DETY for each event in the final _common_clean file
| Quadrant A | 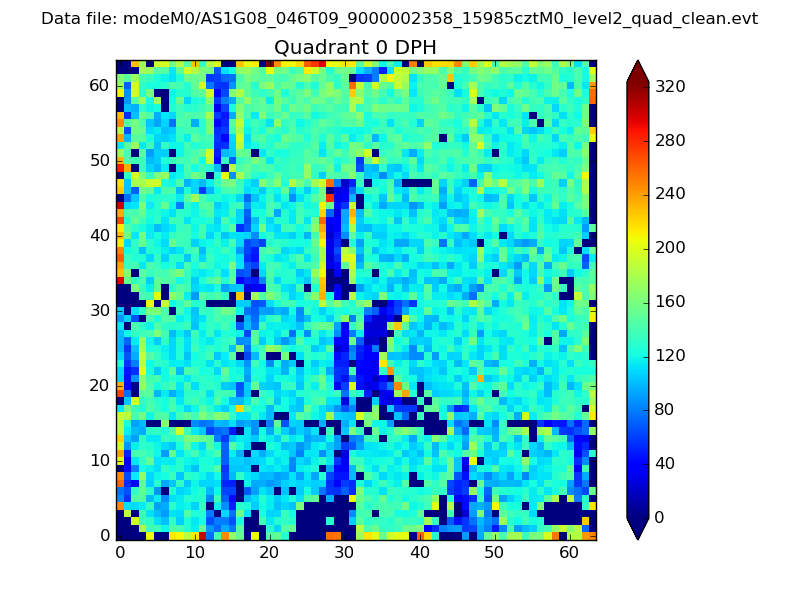 |
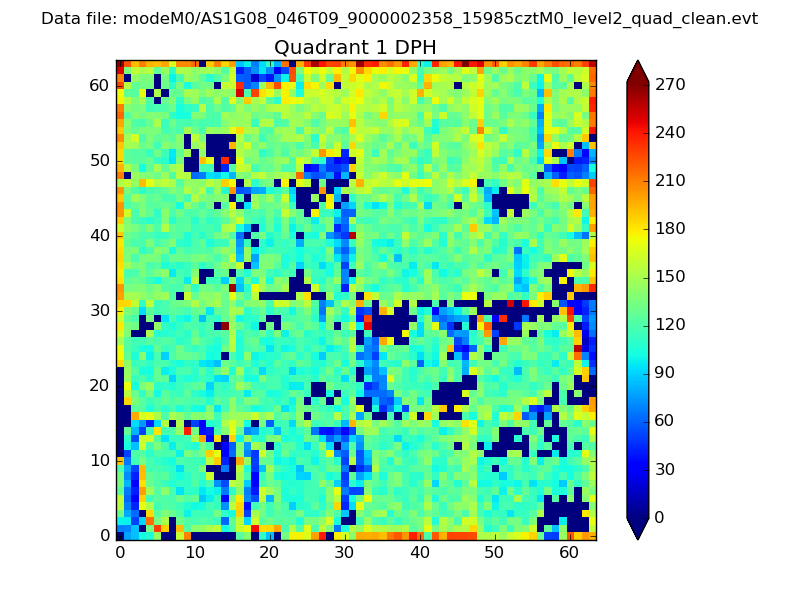 |
Quadrant B |
|---|---|---|---|
| Quadrant D | 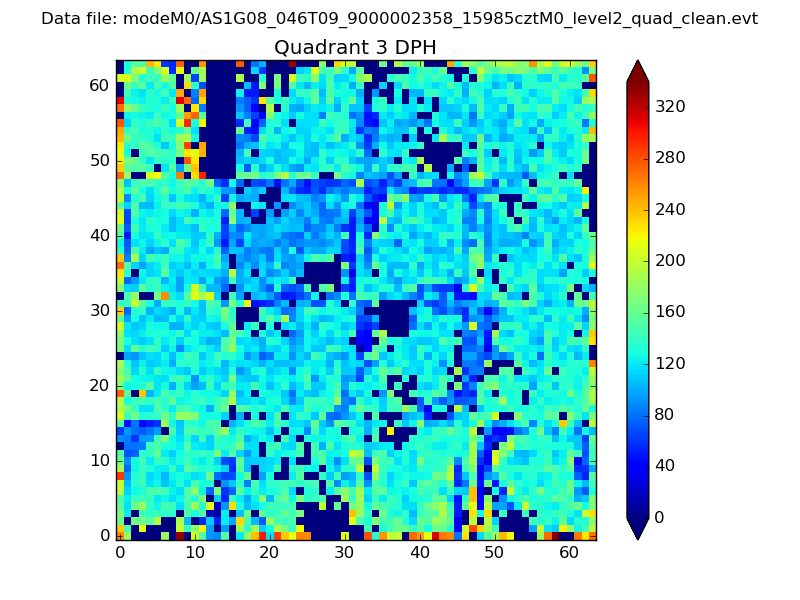 |
 |
Quadrant C |
| Plot type | Count rate plots | Images |
|---|---|---|
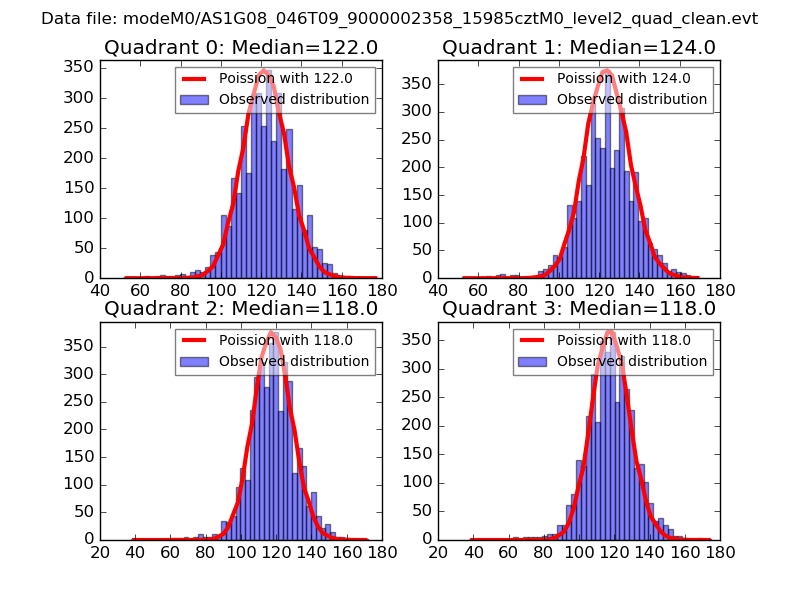
| Comparison with Poisson distribution Blue bars denote a histogram of data divided into 1 sec bins. Red curve is a Poisson curve with rate = median count rate of data. |
 |
 |
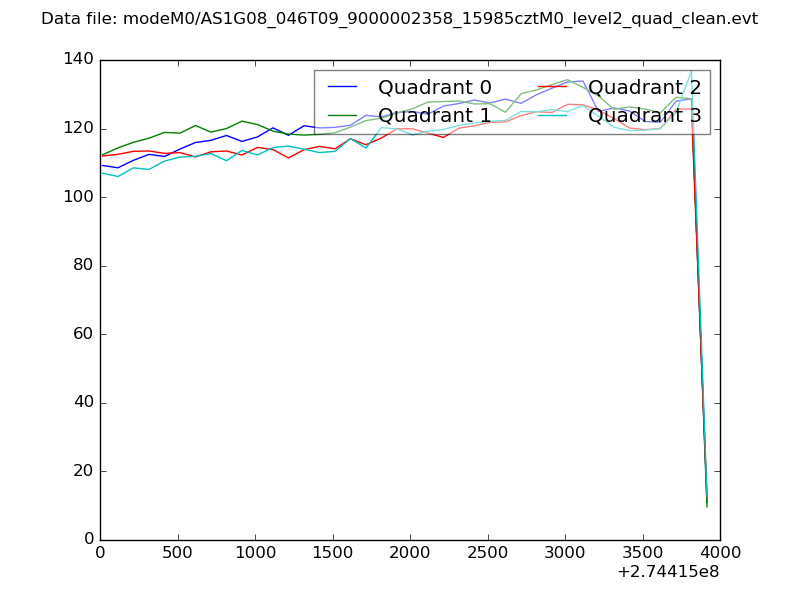
| Quadrant-wise count rates Data is divided into 100 sec bins |
 |
|
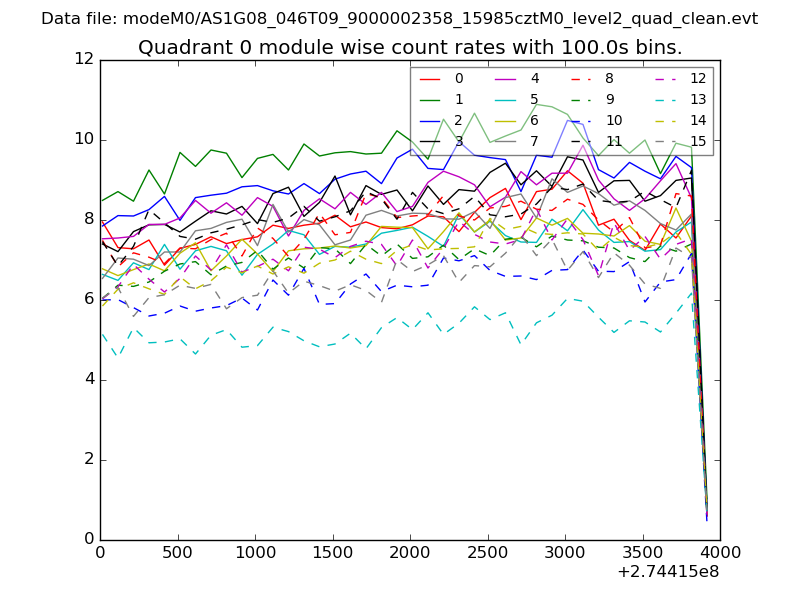
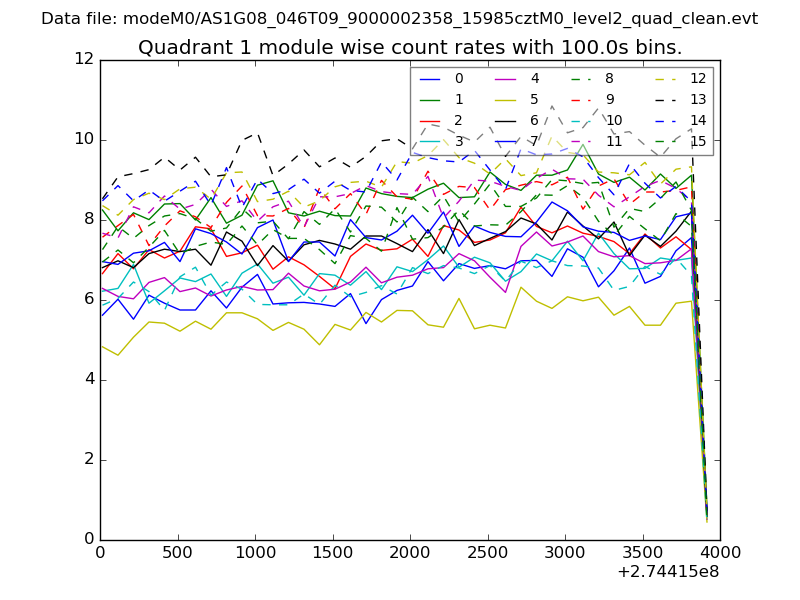
| Module-wise count rates for Quadrant A Data is divided into 100 sec bins |
 |
 |
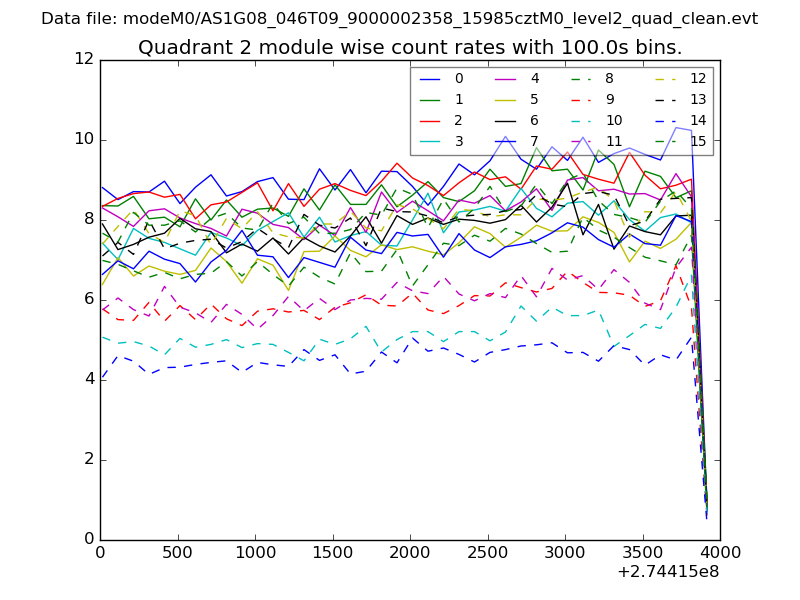
| Module-wise count rates for Quadrant B Data is divided into 100 sec bins |
 |
 |
| Module-wise count rates for Quadrant C Data is divided into 100 sec bins |
 |
 |
| Module-wise count rates for Quadrant D Data is divided into 100 sec bins |
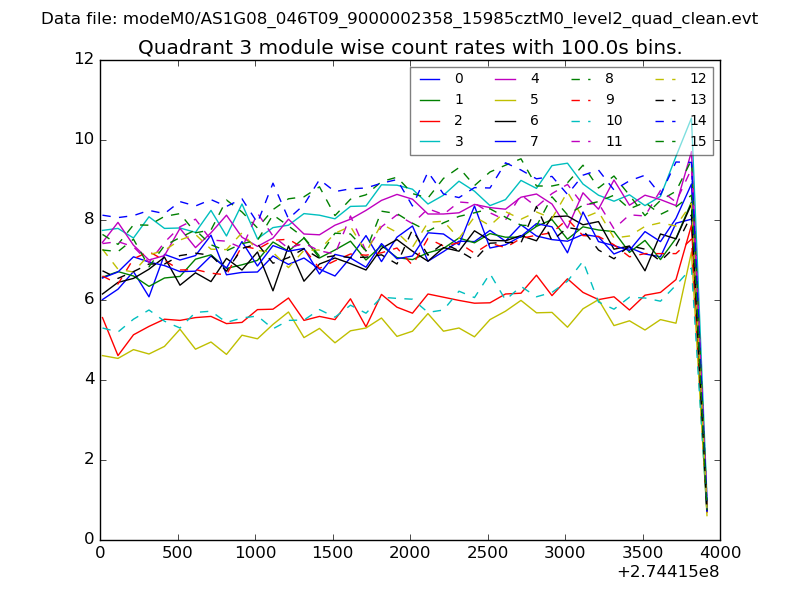 |
 |
| Parameter | Plot |
|---|---|
| CZT HV Monitor |  |
| D_VDD | 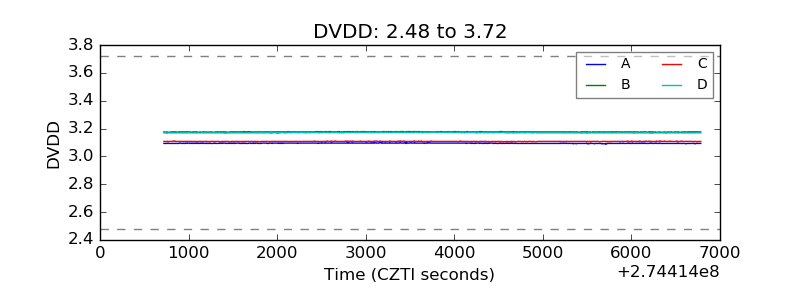 |
| Temperature 1 | 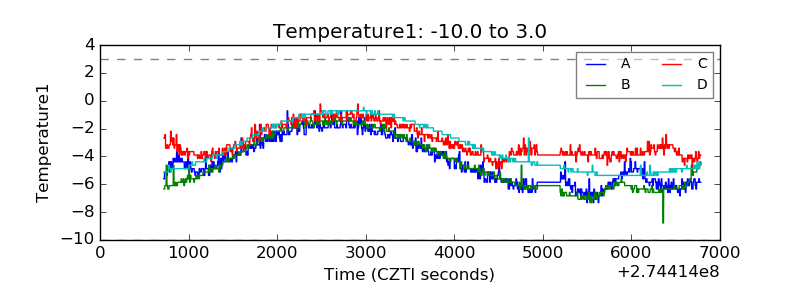 |
| Veto HV Monitor | 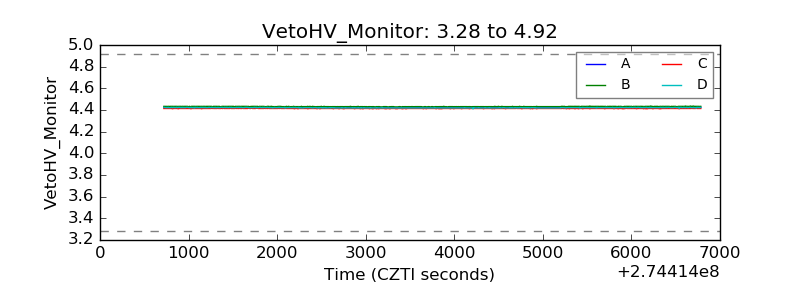 |
| Veto LLD | 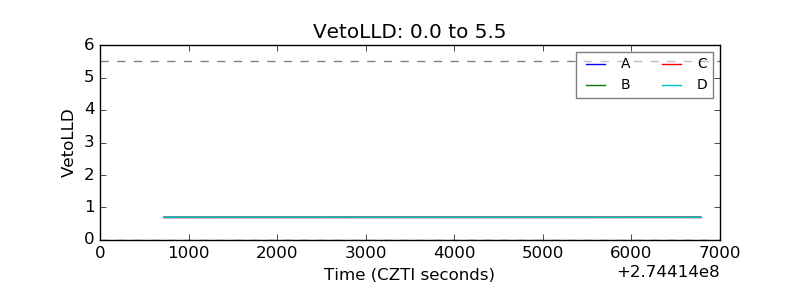 |
| Alpha Counter | 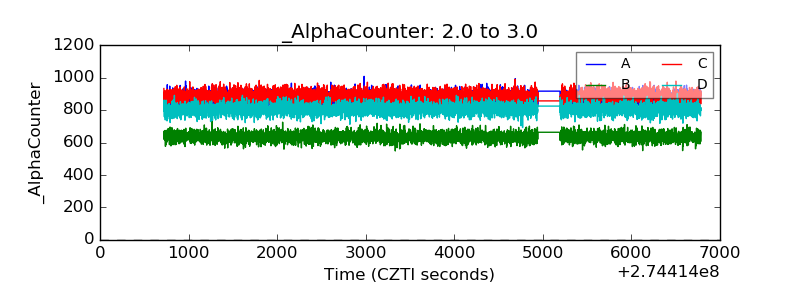 |
| _CPM_Rate | 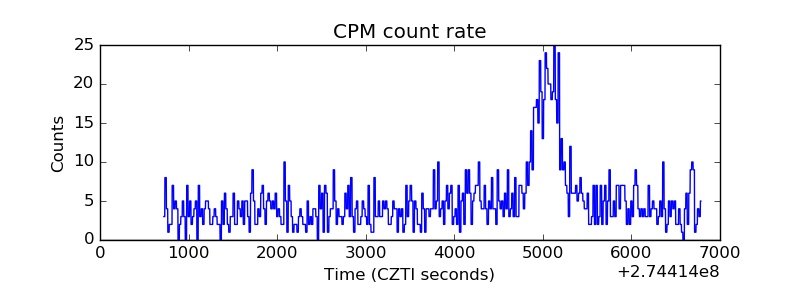 |
| CZT Counter | 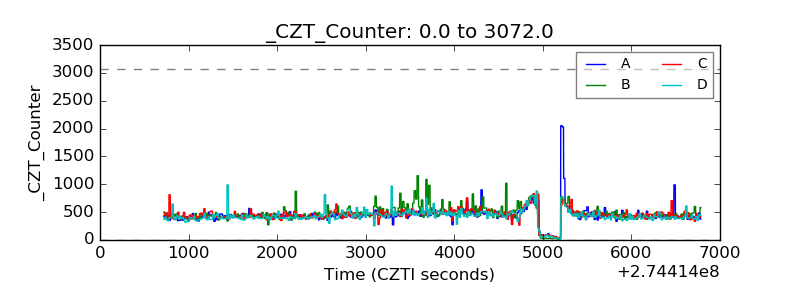 |
| +2.5 Volts monitor | 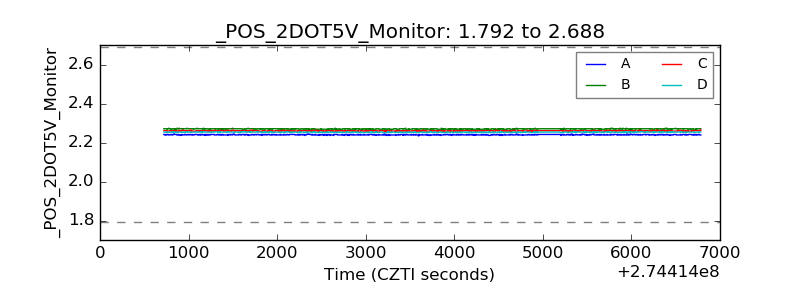 |
| +5 Volts monitor | 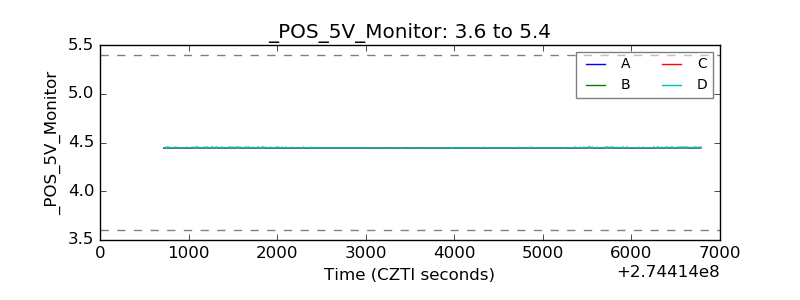 |
| _ROLL_ROT | 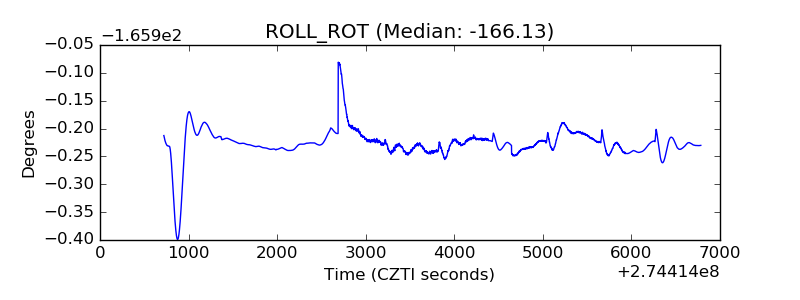 |
| _Roll_DEC | 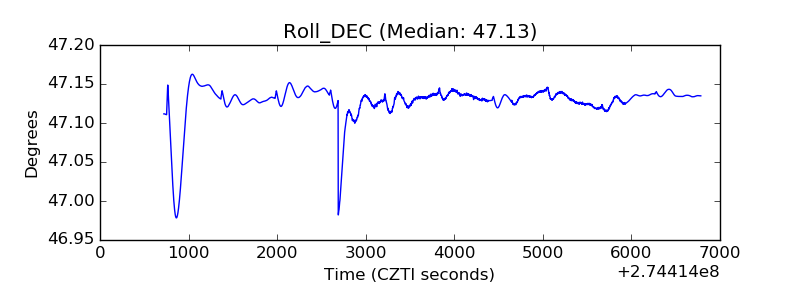 |
| _Roll_RA | 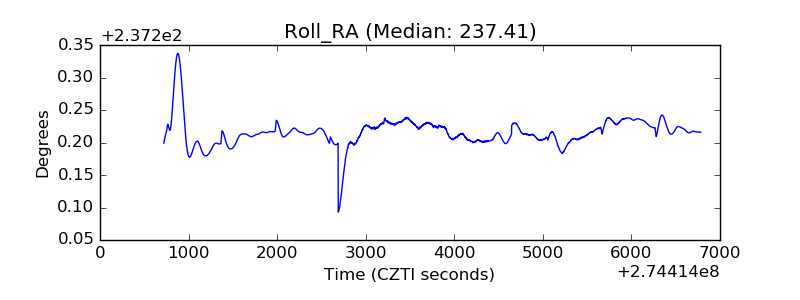 |
| Veto Counter | 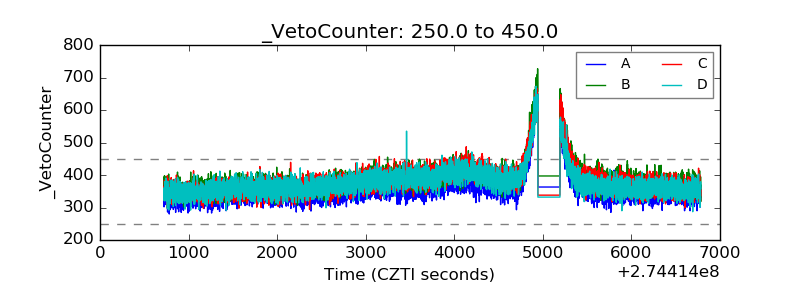 |