| Param | Original file | Final file |
|---|---|---|
| Filename | modeM0/AS1G08_046T09_9000002358_15987cztM0_level2.evt | modeM0/AS1G08_046T09_9000002358_15987cztM0_level2_quad_clean.evt |
| Size (bytes) | 239,976,000 | 42,105,600 |
| Size | 228.9 MB | 40.2 MB |
| Events in quadrant A | 1,784,449 | 253,494 |
| Events in quadrant B | 1,794,578 | 256,328 |
| Events in quadrant C | 1,756,795 | 247,257 |
| Events in quadrant D | 1,669,321 | 246,512 |
| Mode M0 | |||
|---|---|---|---|
| Quadrant | BADHDUFLAG | Total packets | Discarded packets |
| A | 0 | 8026 | 2 |
| B | 0 | 7989 | 1 |
| C | 0 | 7906 | 1 |
| D | 0 | 7911 | 1 |
| Mode M9 | |||
|---|---|---|---|
| Quadrant | BADHDUFLAG | Total packets | Discarded packets |
| A | 0 | 3 | 0 |
| B | 0 | 3 | 0 |
| C | 0 | 3 | 0 |
| D | 0 | 3 | 0 |
| Mode SS | |||
|---|---|---|---|
| Quadrant | BADHDUFLAG | Total packets | Discarded packets |
| A | 0 | 78 | 0 |
| B | 0 | 78 | 0 |
| C | 0 | 78 | 0 |
| D | 0 | 78 | 0 |
| Quadrant | Total seconds | Saturated seconds | Saturation percentage |
|---|---|---|---|
| A | 3836 | 119 | 3.102190% |
| B | 3836 | 125 | 3.258603% |
| C | 3836 | 106 | 2.763295% |
| D | 3836 | 65 | 1.694473% |
Noise dominated data is calculated using 1-second bins in cleaned event files. If a bin has >2000 counts, and if more than 50% of those come from <1% of pixels, then it is considered to be noise-dominated and hence unusable.
| Quadrant | # 1 sec bins | Bins with >0 counts | Bins with >2000 counts | High rate bins dominated by noise | Noise dominated (total time) | Noise dominated (detector-on time) | Marked lightcurve |
|---|---|---|---|---|---|---|---|
| A | 4087 | 3837 | 14 | 14 | 0.34% | 0.36% | 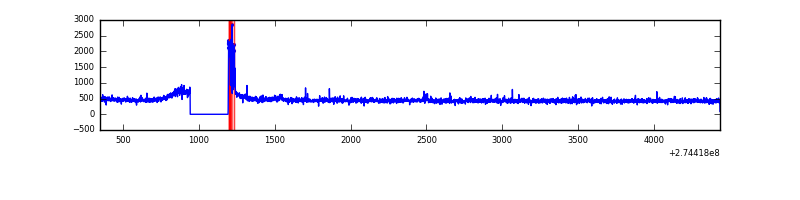 |
| B | 4087 | 3837 | 0 | 0 | 0.00% | 0.00% | 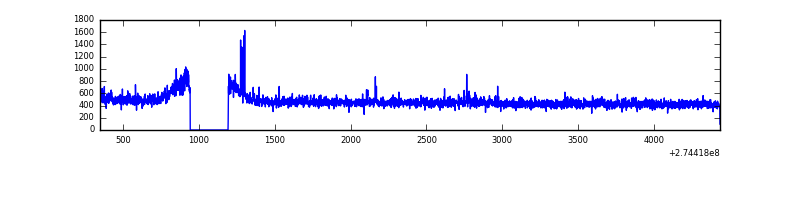 |
| C | 4087 | 3837 | 0 | 0 | 0.00% | 0.00% | 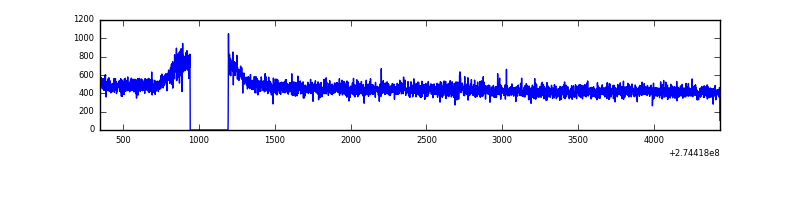 |
| D | 4087 | 3838 | 1 | 1 | 0.02% | 0.03% | 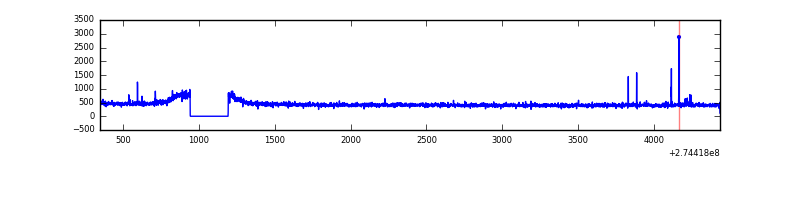 |
Top three noisy pixels from each quadrant. If the there are fewer than three noisy pixels in the level2.evt file, extra rows are filled as -1
| Pixel properties | Quadrant properties | ||||||
|---|---|---|---|---|---|---|---|
| Quadrant | DetID | PixID | Counts | Sigma | Mean | Median | Sigma |
| A | 15 | 239 | 62514 | 674.11 | 446 | 436 | 92.1 |
| A | 0 | 226 | 3836 | 36.92 | 446 | 436 | 92.1 |
| A | 12 | 96 | 3626 | 34.64 | 446 | 436 | 92.1 |
| B | 4 | 173 | 20140 | 221.97 | 447 | 433 | 88.8 |
| B | 0 | 189 | 12172 | 132.22 | 447 | 433 | 88.8 |
| B | 12 | 111 | 10533 | 113.76 | 447 | 433 | 88.8 |
| C | 14 | 238 | 66206 | 650.05 | 429 | 431 | 101.2 |
| C | 3 | 233 | 10495 | 99.46 | 429 | 431 | 101.2 |
| C | 13 | 61 | 3145 | 26.82 | 429 | 431 | 101.2 |
| D | 2 | 234 | 17039 | 156.36 | 435 | 421 | 106.3 |
| D | 13 | 172 | 12913 | 117.54 | 435 | 421 | 106.3 |
| D | 2 | 120 | 4836 | 41.54 | 435 | 421 | 106.3 |
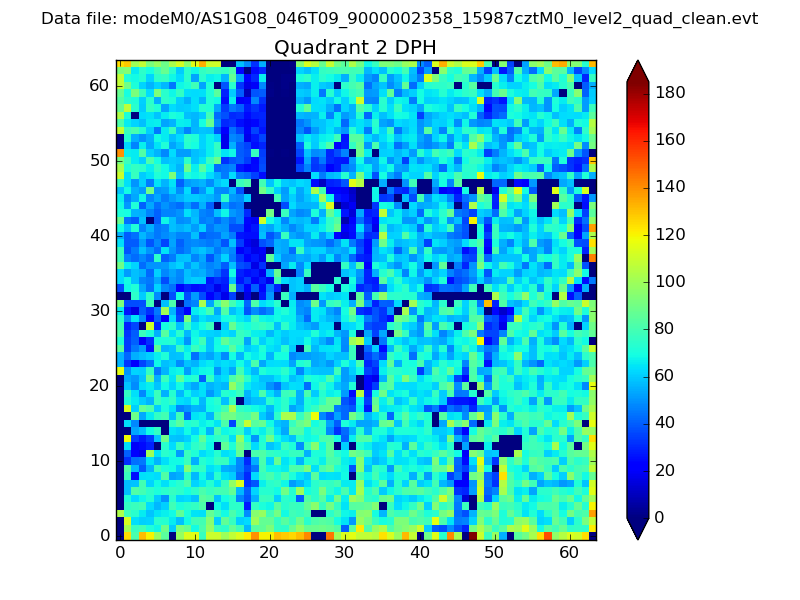
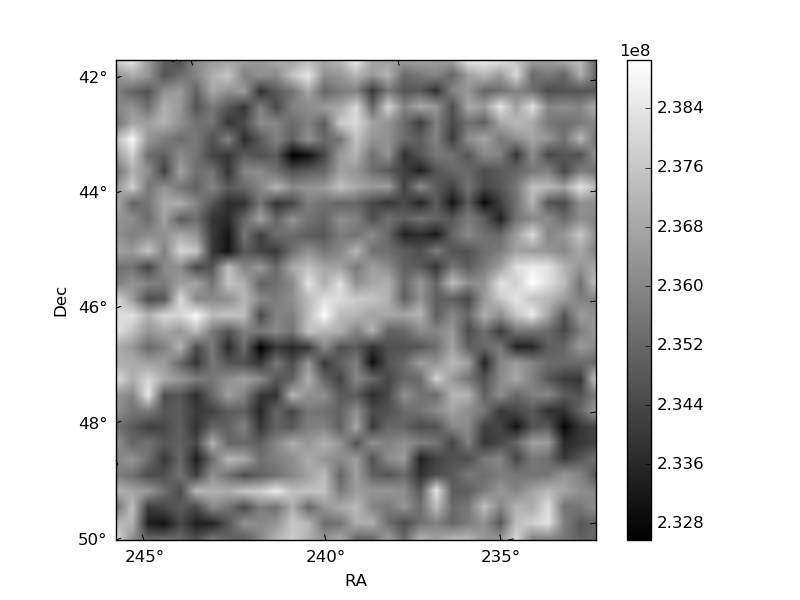
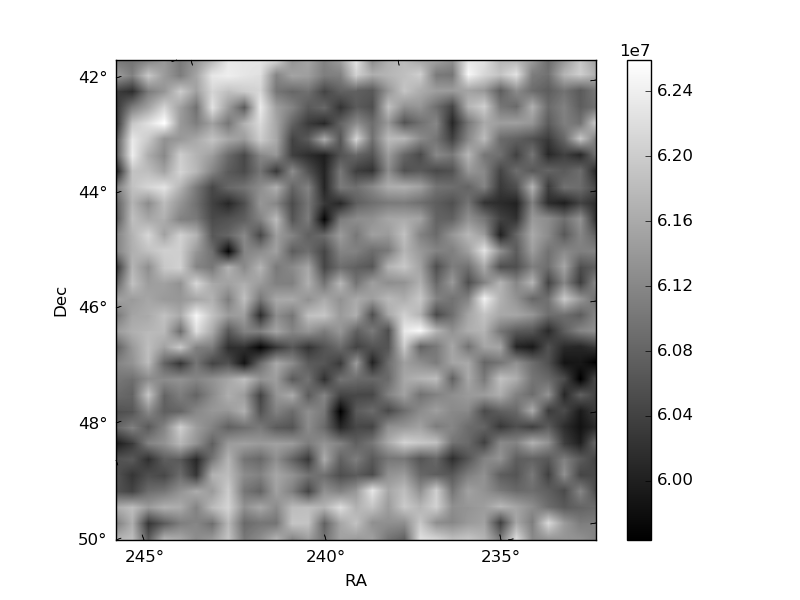
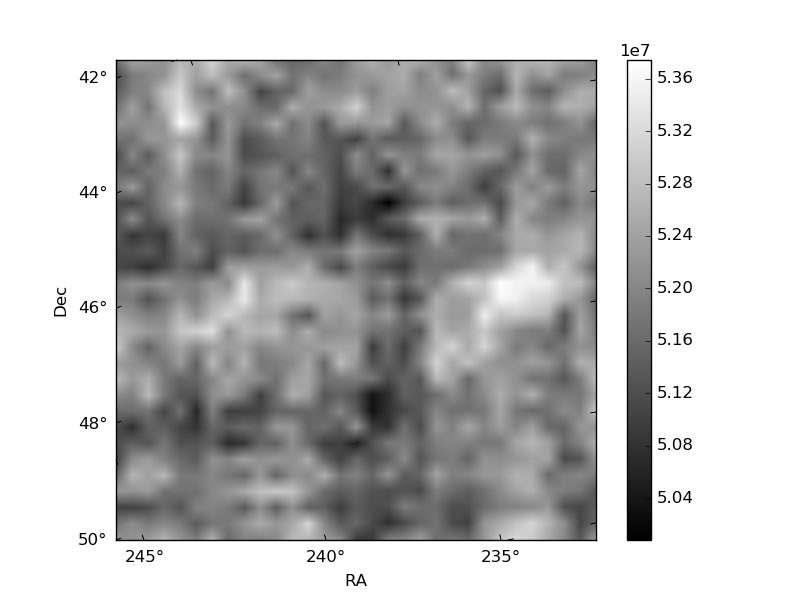
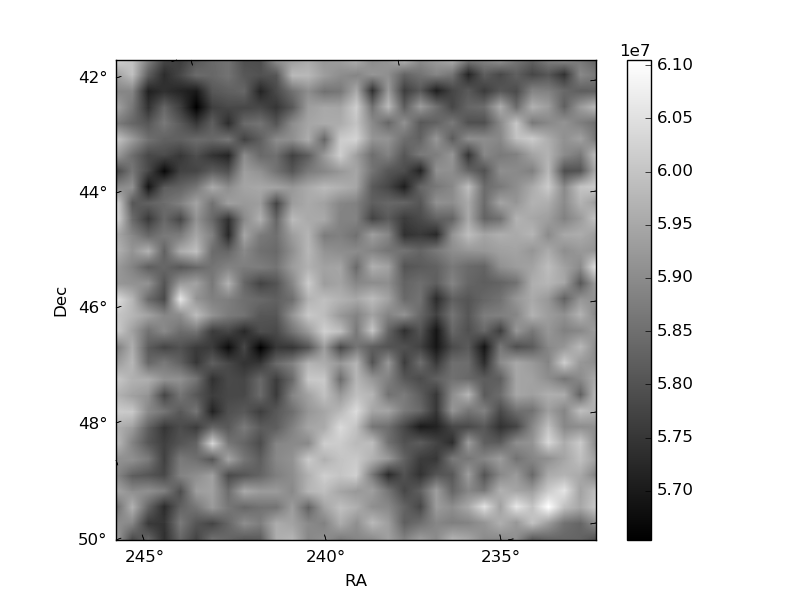
Histogram calculated using DETX and DETY for each event in the final _common_clean file
| Quadrant A | 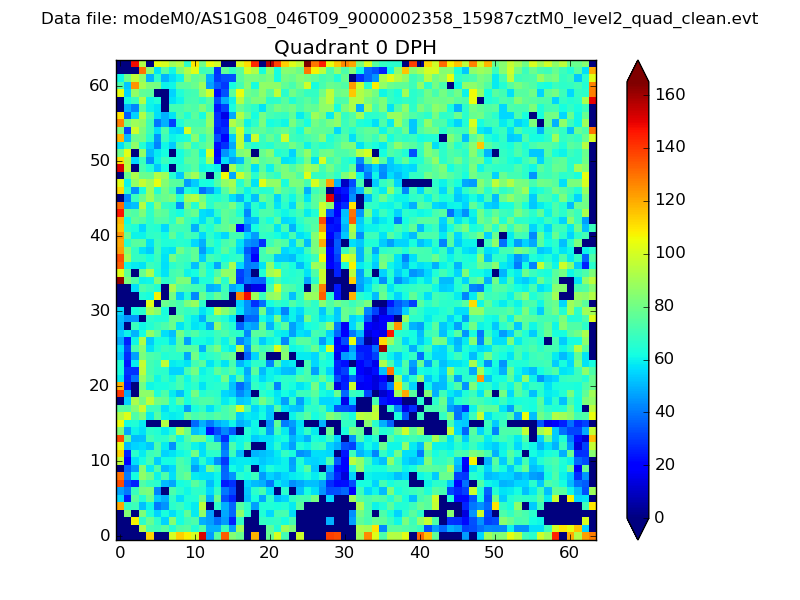 |
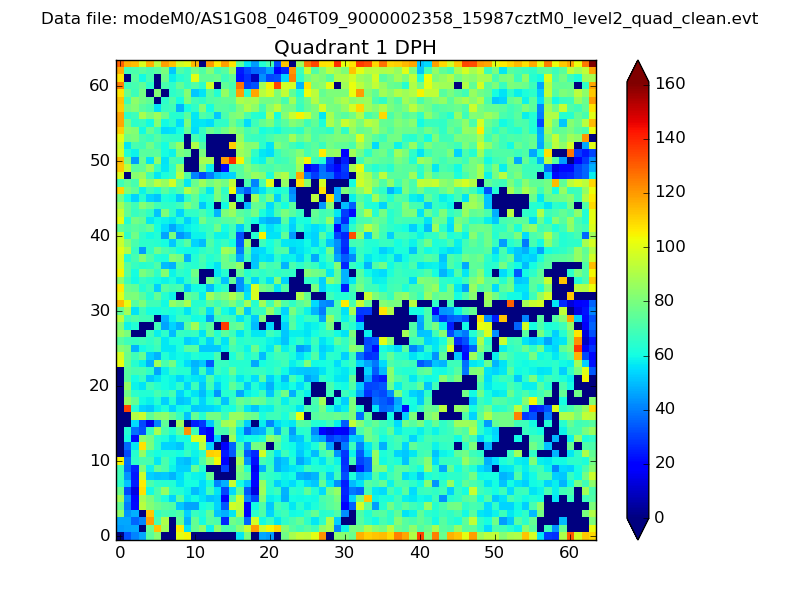 |
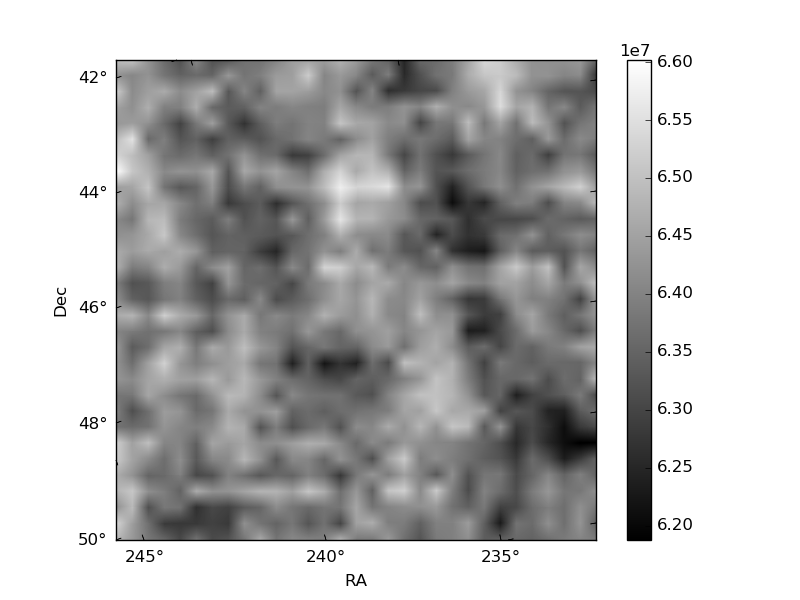
Quadrant B |
|---|---|---|---|
| Quadrant D | 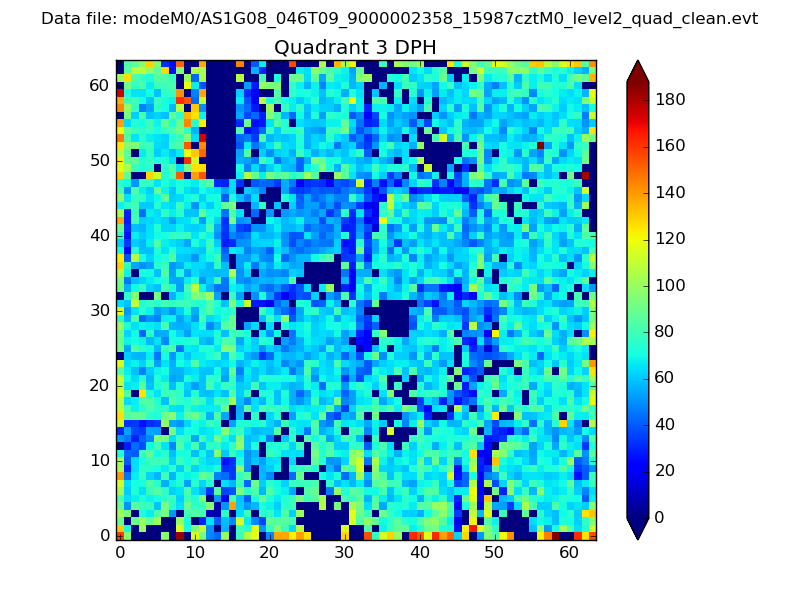 |
 |
Quadrant C |
| Plot type | Count rate plots | Images |
|---|---|---|
| Comparison with Poisson distribution Blue bars denote a histogram of data divided into 1 sec bins. Red curve is a Poisson curve with rate = median count rate of data. |
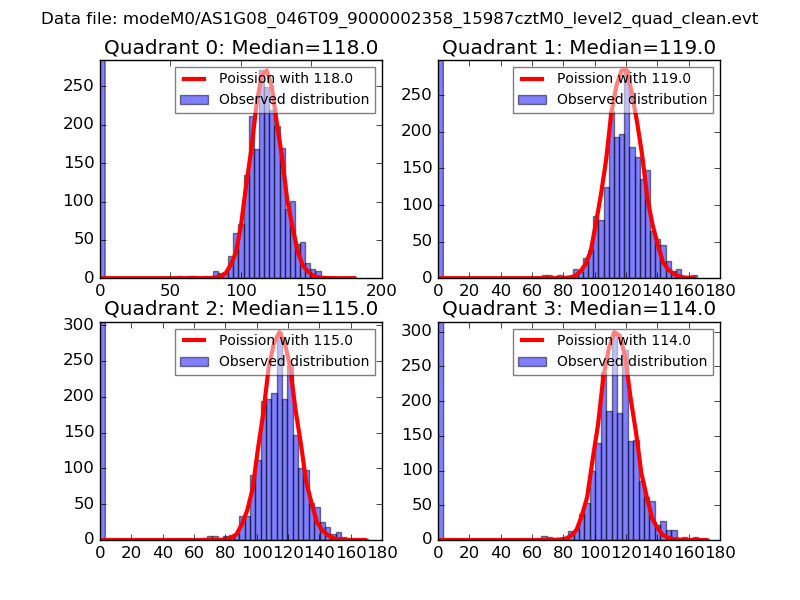 |
 |
| Quadrant-wise count rates Data is divided into 100 sec bins |
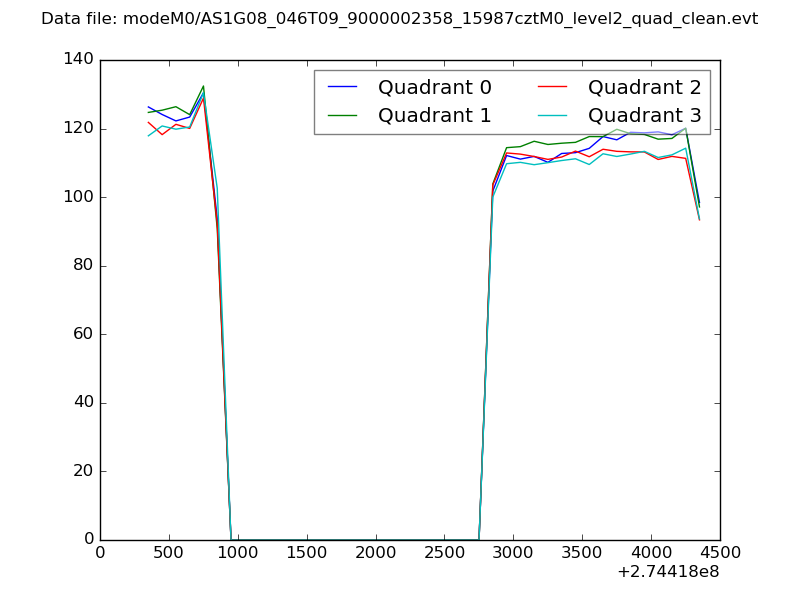 |
|
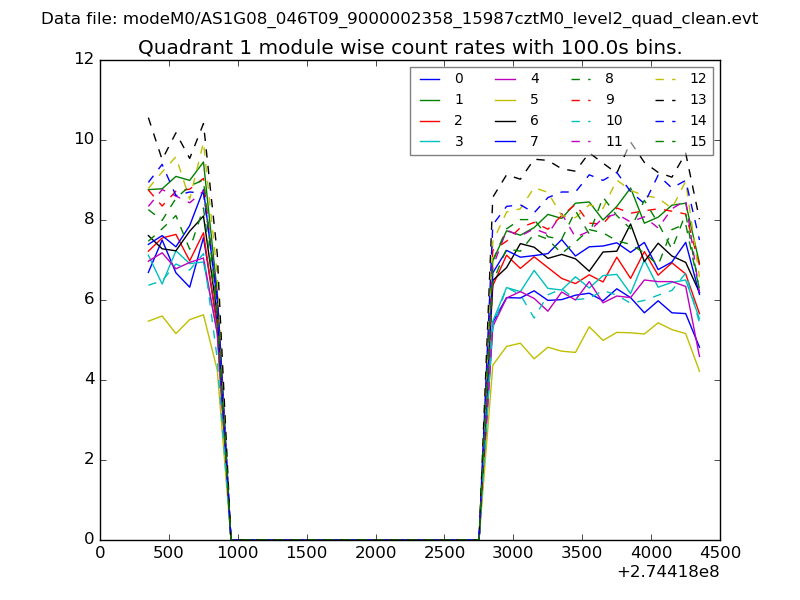
| Module-wise count rates for Quadrant A Data is divided into 100 sec bins |
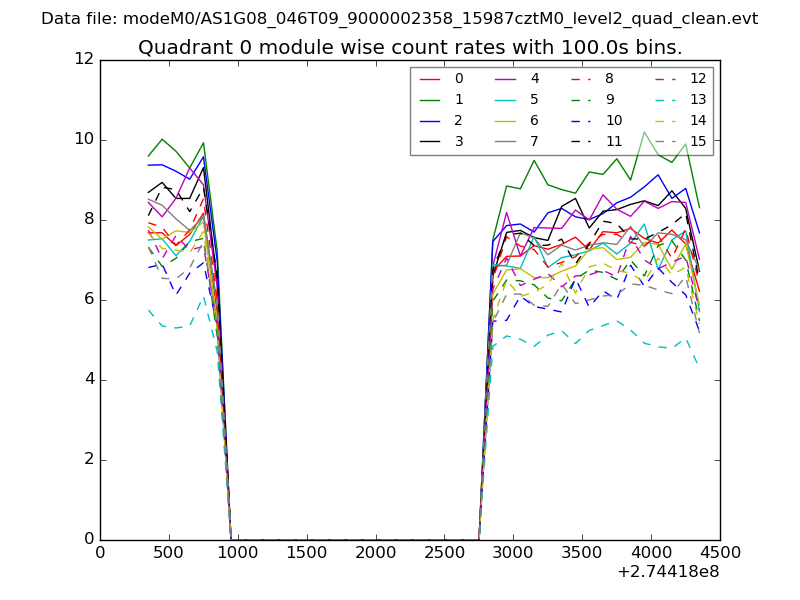 |
 |
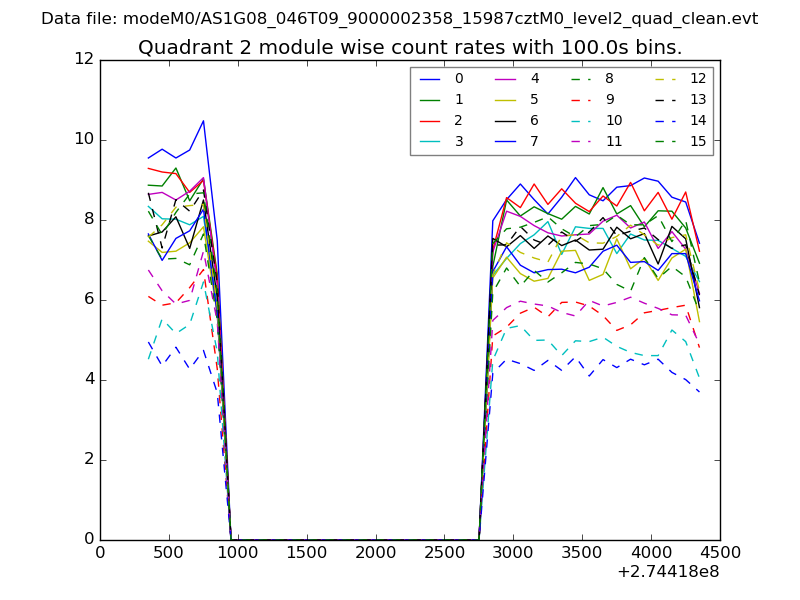
| Module-wise count rates for Quadrant B Data is divided into 100 sec bins |
 |
 |
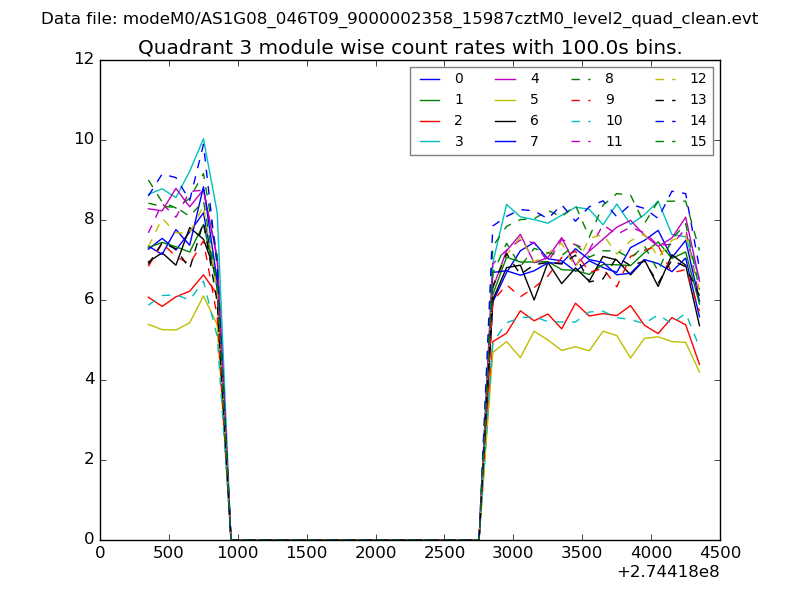
| Module-wise count rates for Quadrant C Data is divided into 100 sec bins |
 |
 |
| Module-wise count rates for Quadrant D Data is divided into 100 sec bins |
 |
 |
| Parameter | Plot |
|---|---|
| CZT HV Monitor | 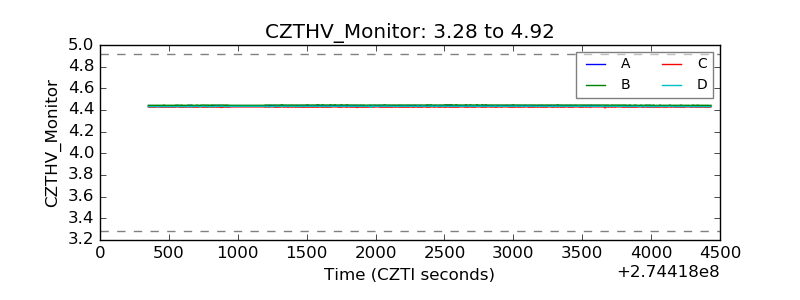 |
| D_VDD | 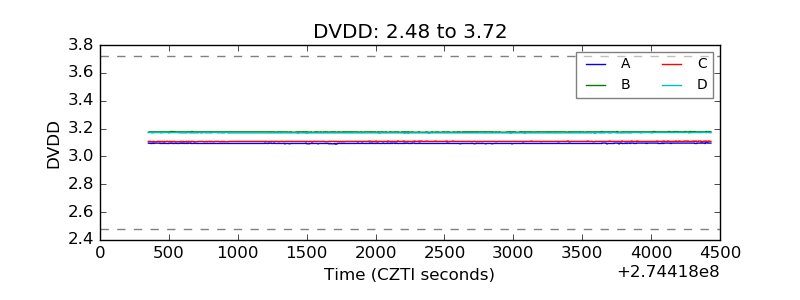 |
| Temperature 1 | 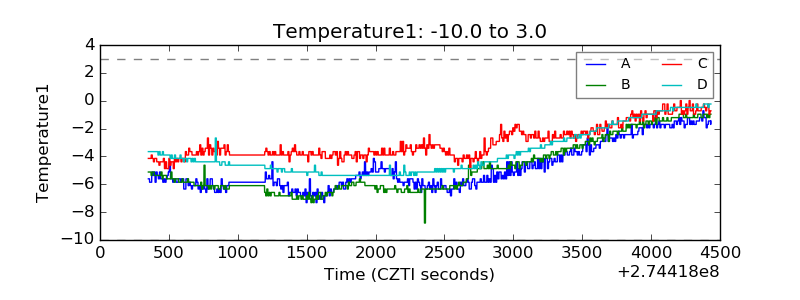 |
| Veto HV Monitor | 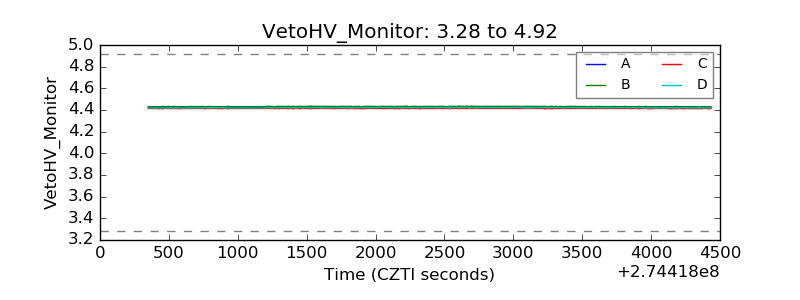 |
| Veto LLD | 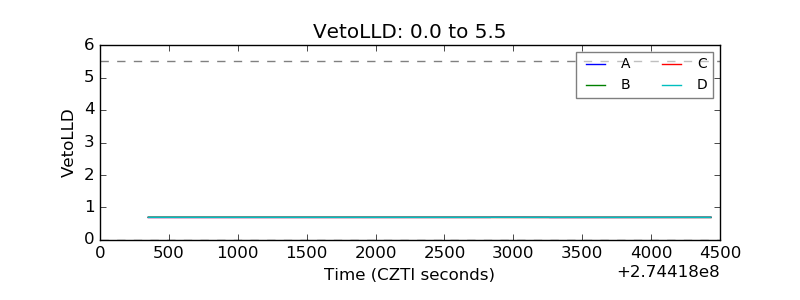 |
| Alpha Counter | 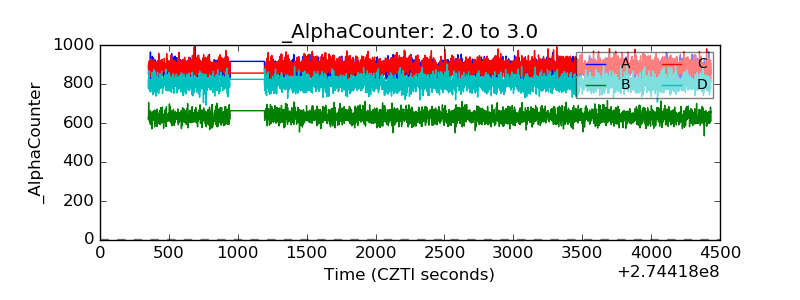 |
| _CPM_Rate | 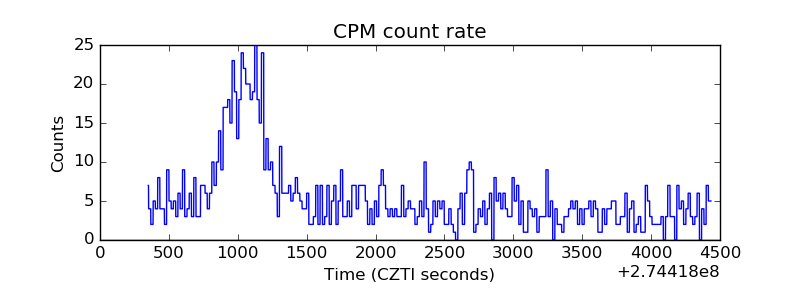 |
| CZT Counter | 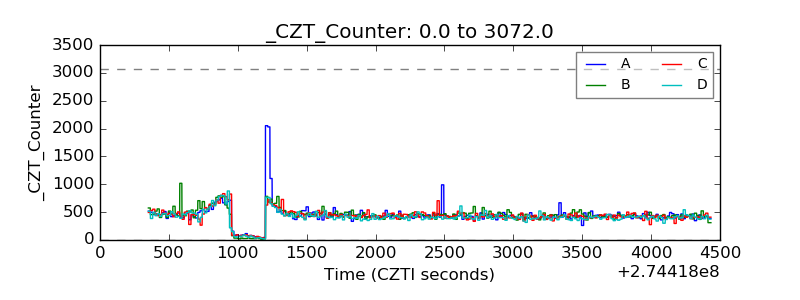 |
| +2.5 Volts monitor |  |
| +5 Volts monitor | 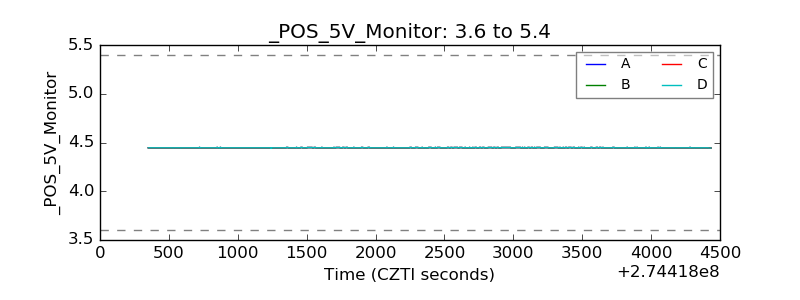 |
| _ROLL_ROT | 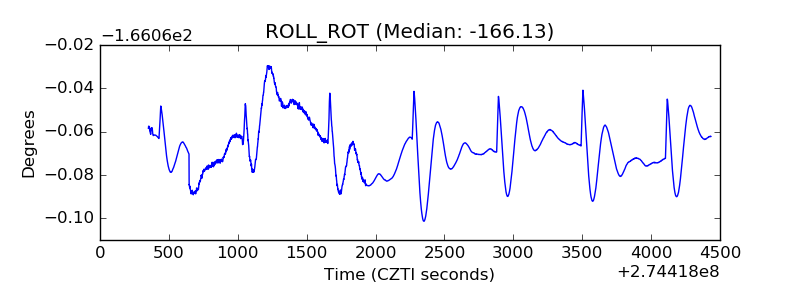 |
| _Roll_DEC | 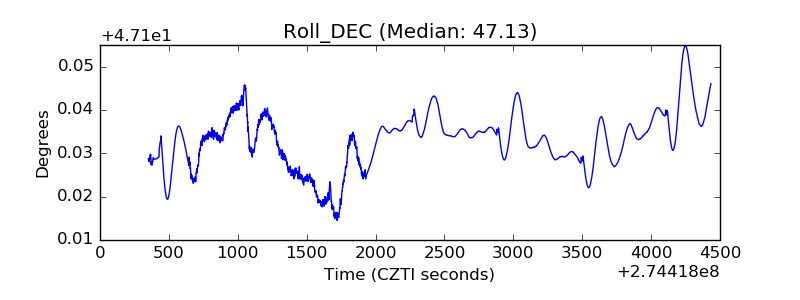 |
| _Roll_RA | 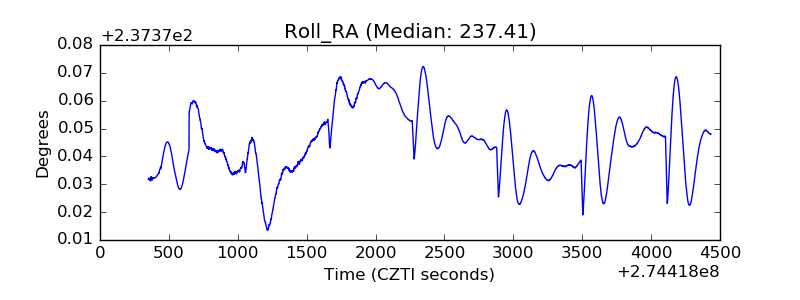 |
| Veto Counter | 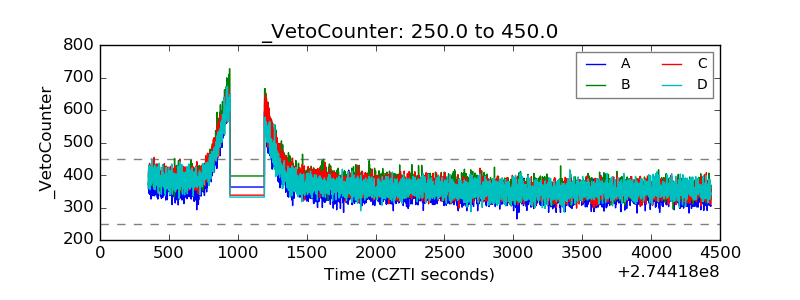 |