| Param | Original file | Final file |
|---|---|---|
| Filename | modeM0/AS1G08_046T09_9000002358_15988cztM0_level2.evt | modeM0/AS1G08_046T09_9000002358_15988cztM0_level2_quad_clean.evt |
| Size (bytes) | 1,034,058,240 | 222,845,760 |
| Size | 986.2 MB | 212.5 MB |
| Events in quadrant A | 7,362,580 | 1,445,522 |
| Events in quadrant B | 8,021,666 | 1,446,599 |
| Events in quadrant C | 7,420,464 | 1,383,389 |
| Events in quadrant D | 7,435,675 | 1,377,795 |
| Mode M0 | |||
|---|---|---|---|
| Quadrant | BADHDUFLAG | Total packets | Discarded packets |
| A | 0 | 32425 | 4 |
| B | 0 | 33989 | 3 |
| C | 0 | 32505 | 3 |
| D | 0 | 33346 | 3 |
| Mode M9 | |||
|---|---|---|---|
| Quadrant | BADHDUFLAG | Total packets | Discarded packets |
| A | 0 | 19 | 0 |
| B | 0 | 19 | 0 |
| C | 0 | 19 | 0 |
| D | 0 | 19 | 0 |
| Mode SS | |||
|---|---|---|---|
| Quadrant | BADHDUFLAG | Total packets | Discarded packets |
| A | 0 | 324 | 0 |
| B | 0 | 324 | 0 |
| C | 0 | 324 | 0 |
| D | 0 | 324 | 0 |
| Quadrant | Total seconds | Saturated seconds | Saturation percentage |
|---|---|---|---|
| A | 15893 | 186 | 1.170327% |
| B | 15893 | 256 | 1.610772% |
| C | 15893 | 234 | 1.472346% |
| D | 15893 | 233 | 1.466054% |
Noise dominated data is calculated using 1-second bins in cleaned event files. If a bin has >2000 counts, and if more than 50% of those come from <1% of pixels, then it is considered to be noise-dominated and hence unusable.
| Quadrant | # 1 sec bins | Bins with >0 counts | Bins with >2000 counts | High rate bins dominated by noise | Noise dominated (total time) | Noise dominated (detector-on time) | Marked lightcurve |
|---|---|---|---|---|---|---|---|
| A | 17734 | 15894 | 5 | 5 | 0.03% | 0.03% | 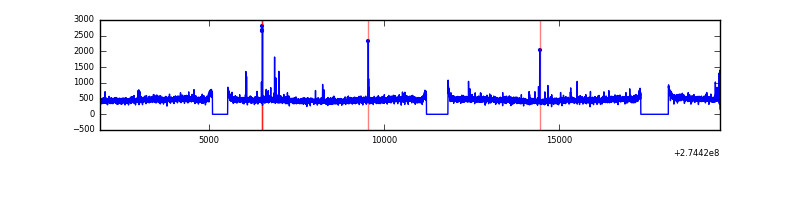 |
| B | 17734 | 15894 | 47 | 47 | 0.27% | 0.30% | 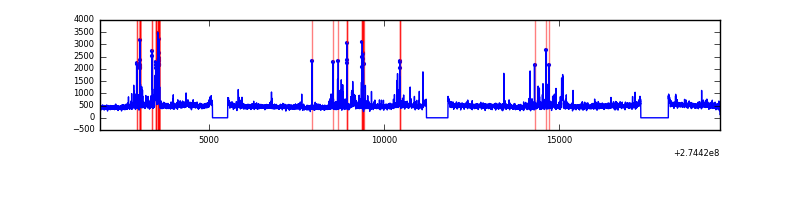 |
| C | 17734 | 15894 | 24 | 24 | 0.14% | 0.15% | 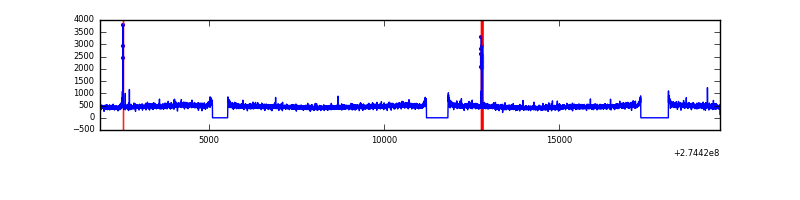 |
| D | 17734 | 15894 | 97 | 97 | 0.55% | 0.61% | 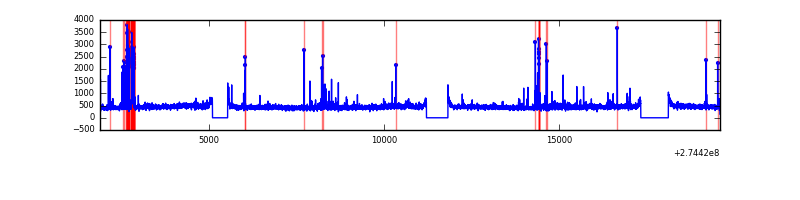 |
Top three noisy pixels from each quadrant. If the there are fewer than three noisy pixels in the level2.evt file, extra rows are filled as -1
| Pixel properties | Quadrant properties | ||||||
|---|---|---|---|---|---|---|---|
| Quadrant | DetID | PixID | Counts | Sigma | Mean | Median | Sigma |
| A | 15 | 239 | 82256 | 212.96 | 1868 | 1826 | 377.7 |
| A | 13 | 210 | 69381 | 178.87 | 1868 | 1826 | 377.7 |
| A | 9 | 143 | 21315 | 51.6 | 1868 | 1826 | 377.7 |
| B | 7 | 220 | 269258 | 751.06 | 1861 | 1810 | 356.1 |
| B | 4 | 216 | 99401 | 274.06 | 1861 | 1810 | 356.1 |
| B | 0 | 189 | 60121 | 163.75 | 1861 | 1810 | 356.1 |
| C | 14 | 238 | 273272 | 651.58 | 1785 | 1789 | 416.7 |
| C | 3 | 233 | 118102 | 279.16 | 1785 | 1789 | 416.7 |
| C | 0 | 207 | 32932 | 74.75 | 1785 | 1789 | 416.7 |
| D | 10 | 70 | 265058 | 598.29 | 1816 | 1761 | 440.1 |
| D | 2 | 152 | 107868 | 241.11 | 1816 | 1761 | 440.1 |
| D | 12 | 218 | 88984 | 198.2 | 1816 | 1761 | 440.1 |
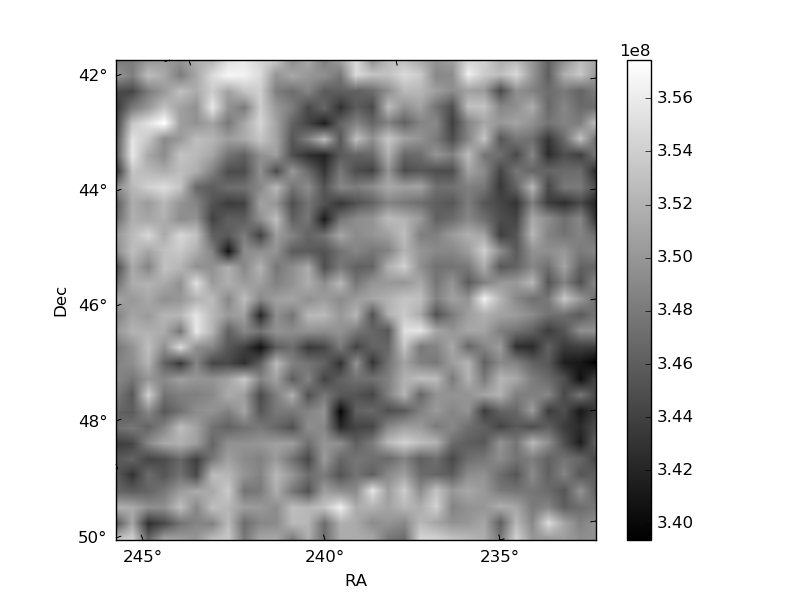
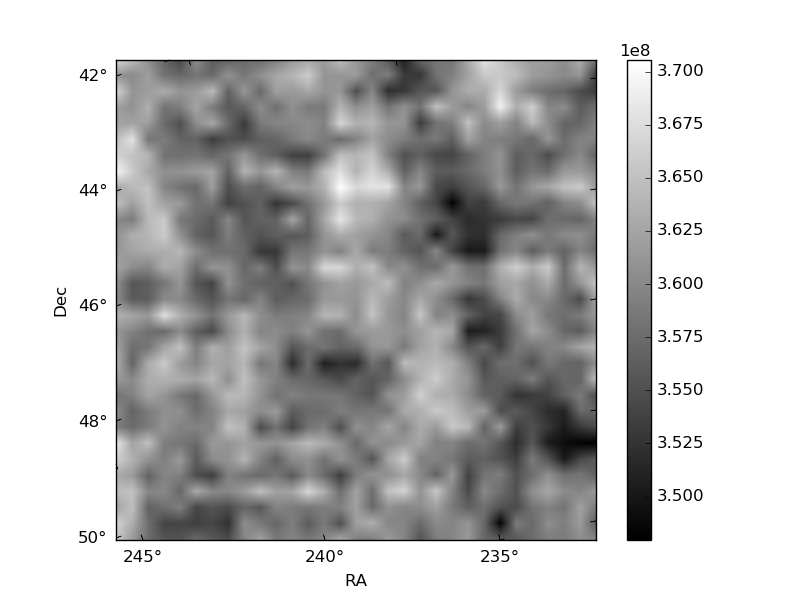
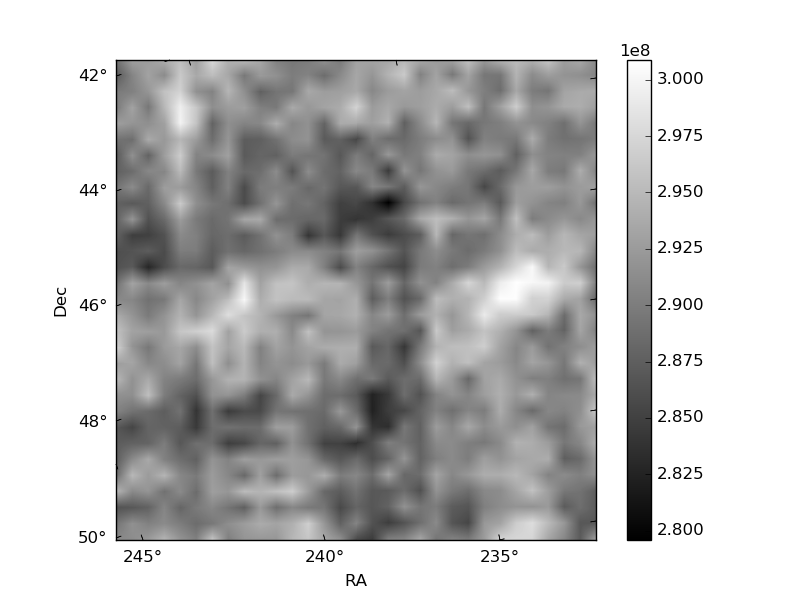
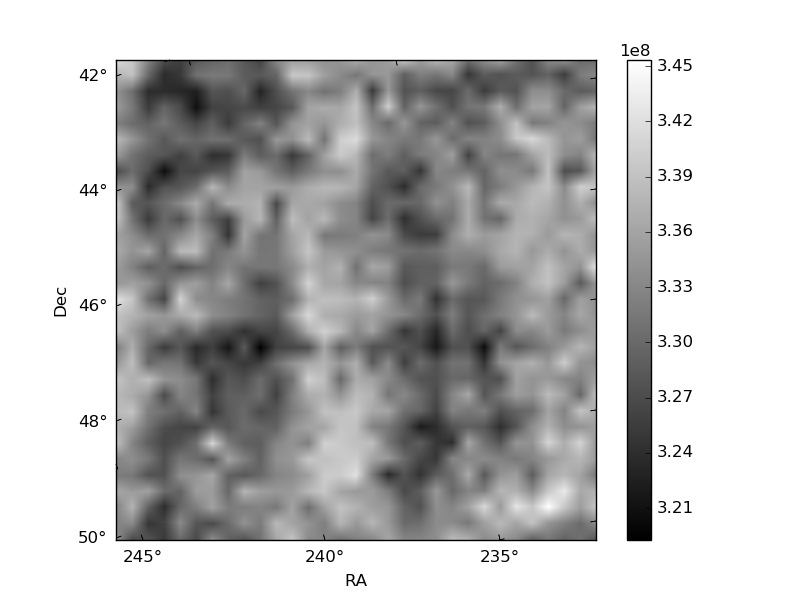
Histogram calculated using DETX and DETY for each event in the final _common_clean file
| Quadrant A |  |
 |
Quadrant B |
|---|---|---|---|
| Quadrant D |  |
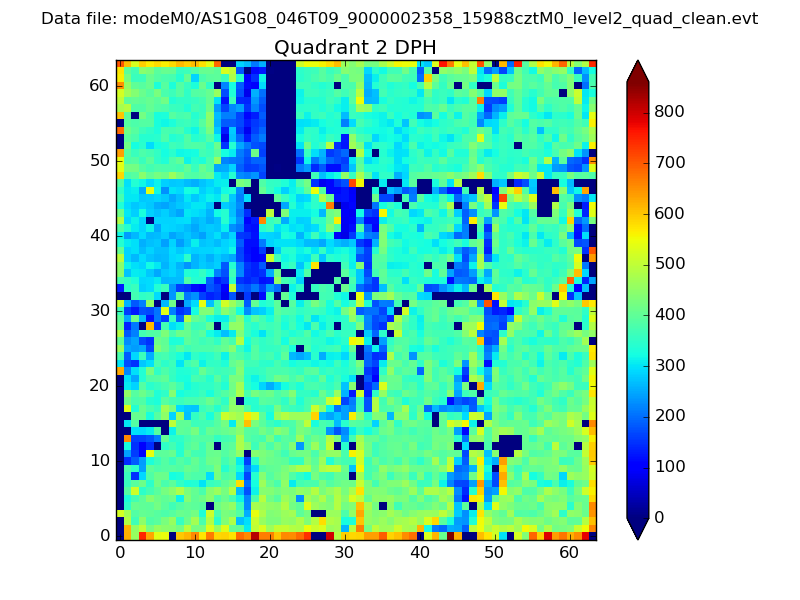 |
Quadrant C |
| Plot type | Count rate plots | Images |
|---|---|---|
| Comparison with Poisson distribution Blue bars denote a histogram of data divided into 1 sec bins. Red curve is a Poisson curve with rate = median count rate of data. |
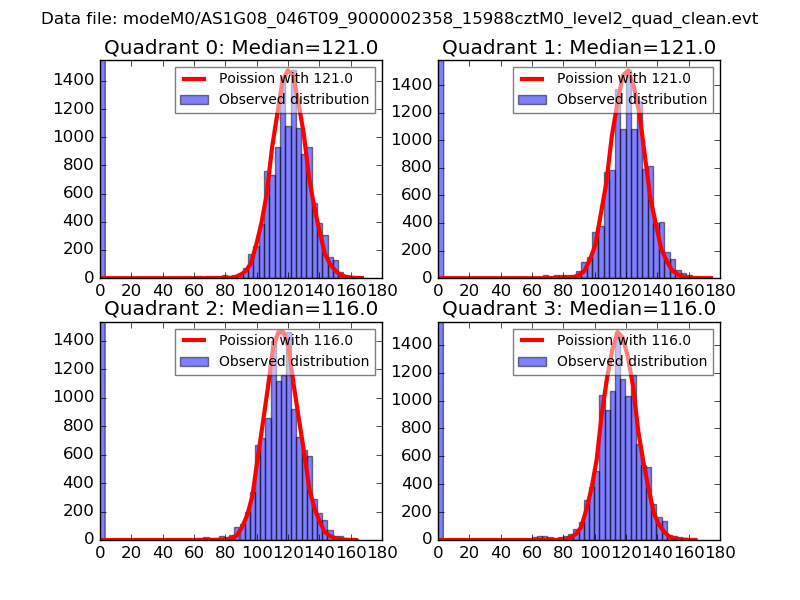 |
 |
| Quadrant-wise count rates Data is divided into 100 sec bins |
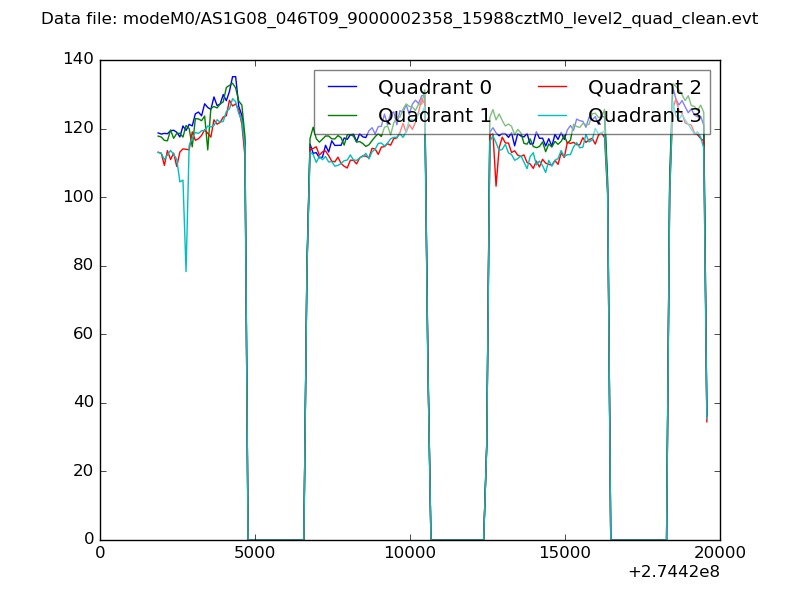 |
|
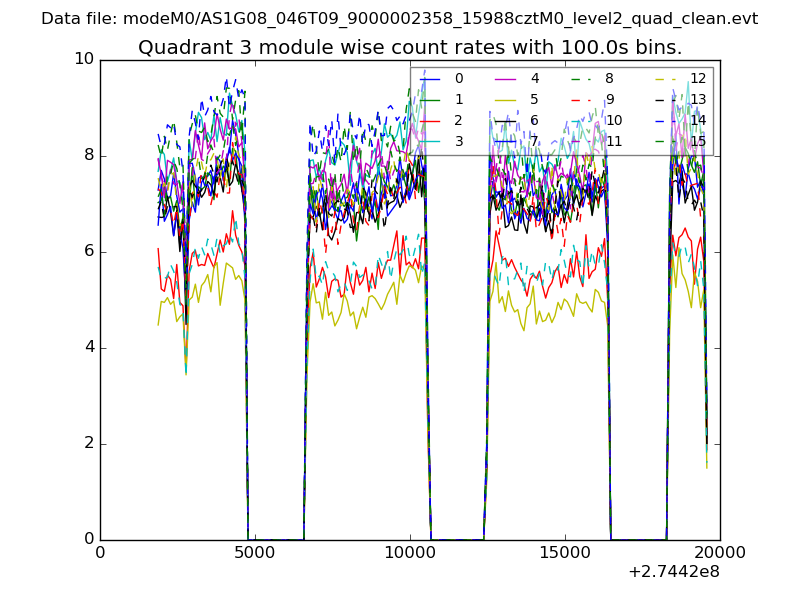
| Module-wise count rates for Quadrant A Data is divided into 100 sec bins |
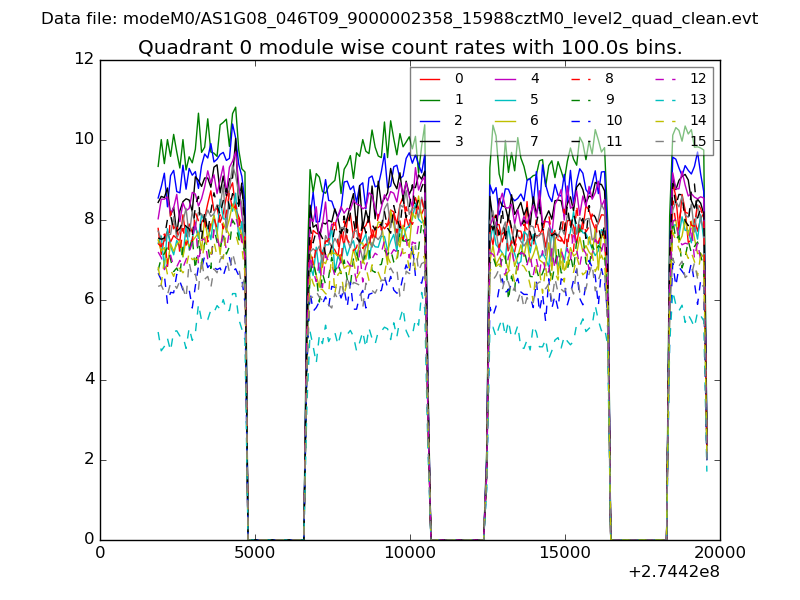 |
 |
| Module-wise count rates for Quadrant B Data is divided into 100 sec bins |
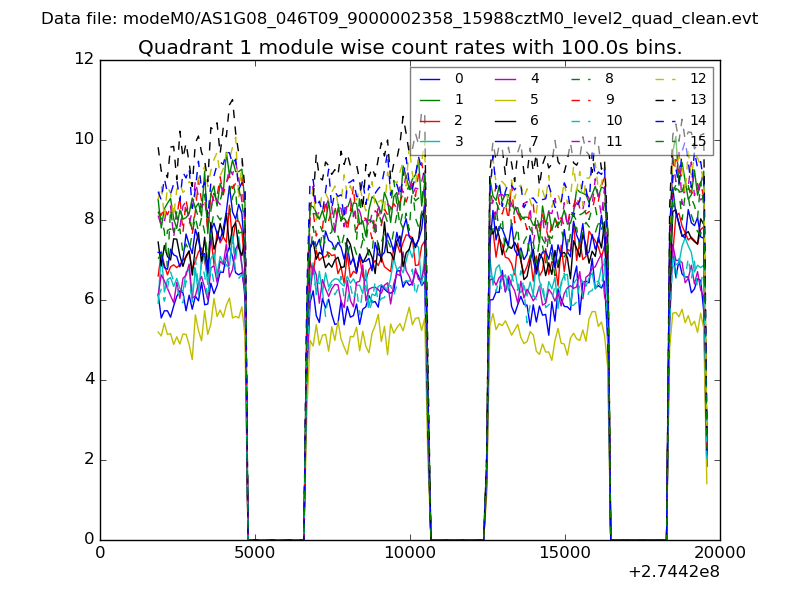 |
 |
| Module-wise count rates for Quadrant C Data is divided into 100 sec bins |
 |
 |
| Module-wise count rates for Quadrant D Data is divided into 100 sec bins |
 |
 |
| Parameter | Plot |
|---|---|
| CZT HV Monitor |  |
| D_VDD | 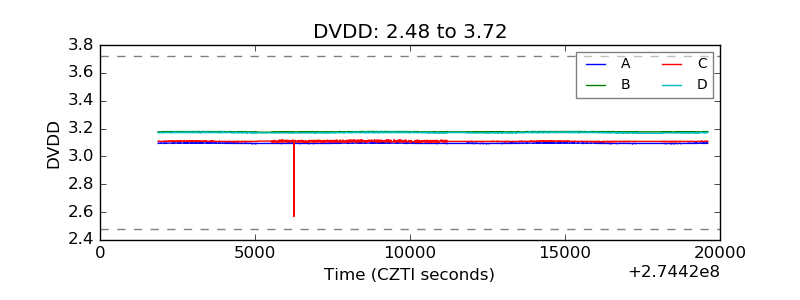 |
| Temperature 1 | 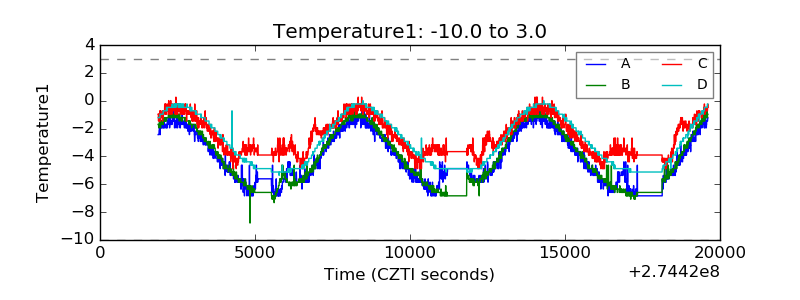 |
| Veto HV Monitor | 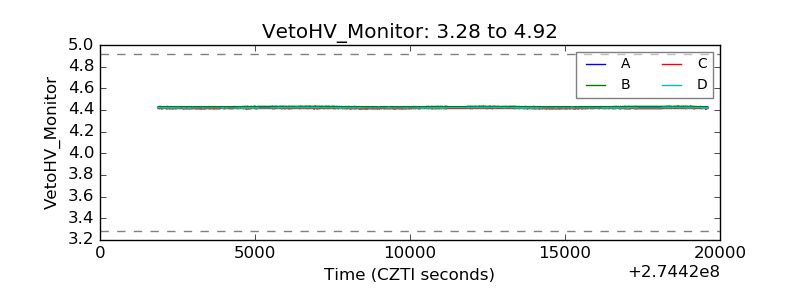 |
| Veto LLD | 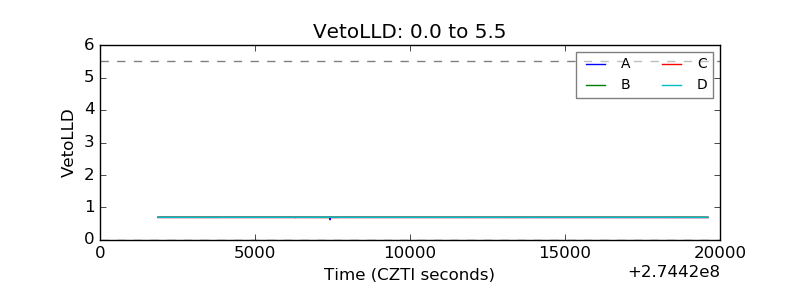 |
| Alpha Counter | 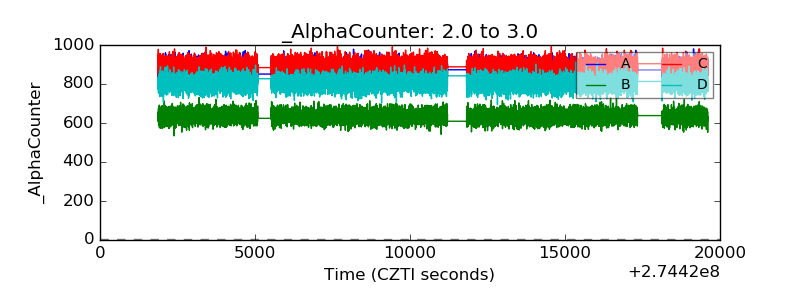 |
| _CPM_Rate | 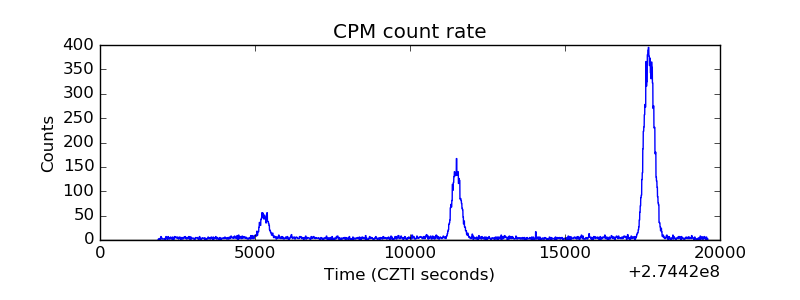 |
| CZT Counter | 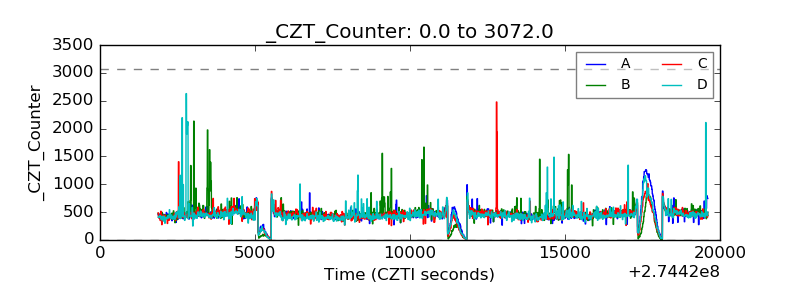 |
| +2.5 Volts monitor |  |
| +5 Volts monitor |  |
| _ROLL_ROT | 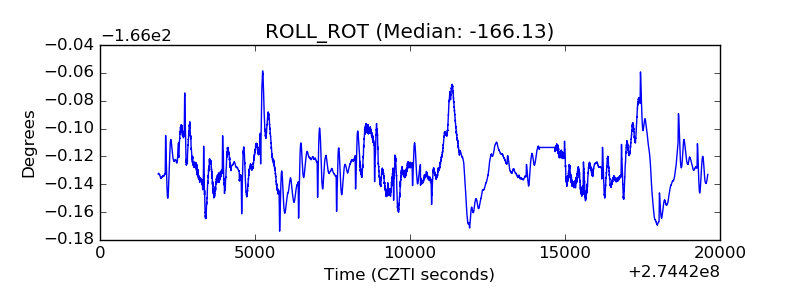 |
| _Roll_DEC | 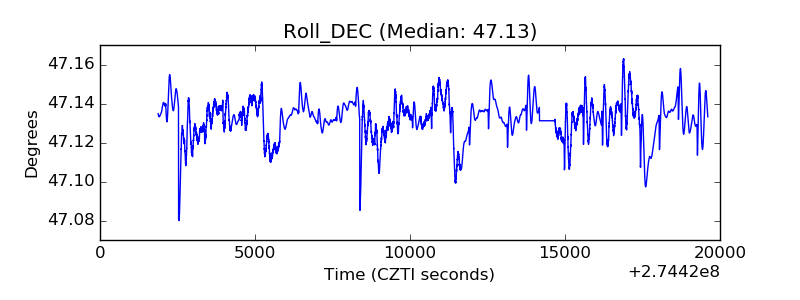 |
| _Roll_RA | 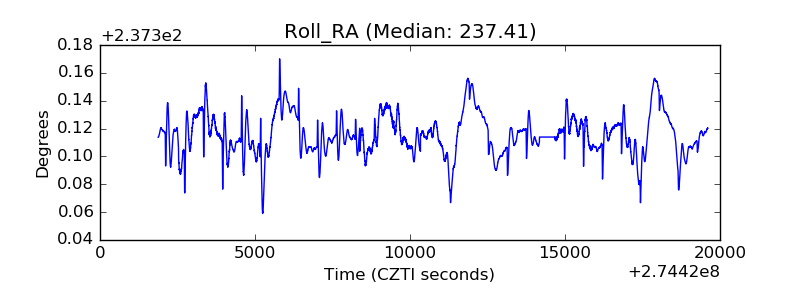 |
| Veto Counter | 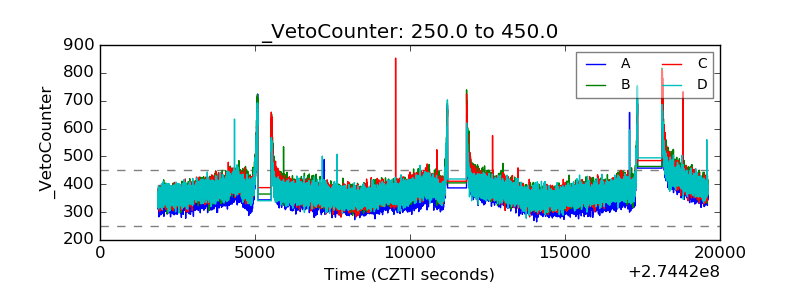 |