| Param | Original file | Final file |
|---|---|---|
| Filename | modeM0/AS1G08_046T09_9000002358_15989cztM0_level2.evt | modeM0/AS1G08_046T09_9000002358_15989cztM0_level2_quad_clean.evt |
| Size (bytes) | 450,619,200 | 98,383,680 |
| Size | 429.7 MB | 93.8 MB |
| Events in quadrant A | 3,822,556 | 638,470 |
| Events in quadrant B | 3,354,199 | 651,438 |
| Events in quadrant C | 2,984,634 | 623,778 |
| Events in quadrant D | 3,054,550 | 623,352 |
| Mode M0 | |||
|---|---|---|---|
| Quadrant | BADHDUFLAG | Total packets | Discarded packets |
| A | 0 | 15519 | 2 |
| B | 0 | 13994 | 1 |
| C | 0 | 12916 | 1 |
| D | 0 | 13425 | 1 |
| Mode M9 | |||
|---|---|---|---|
| Quadrant | BADHDUFLAG | Total packets | Discarded packets |
| A | 0 | 10 | 0 |
| B | 0 | 10 | 0 |
| C | 0 | 10 | 0 |
| D | 0 | 10 | 0 |
| Mode SS | |||
|---|---|---|---|
| Quadrant | BADHDUFLAG | Total packets | Discarded packets |
| A | 0 | 128 | 0 |
| B | 0 | 128 | 0 |
| C | 0 | 128 | 0 |
| D | 0 | 128 | 0 |
| Quadrant | Total seconds | Saturated seconds | Saturation percentage |
|---|---|---|---|
| A | 6343 | 328 | 5.171055% |
| B | 6343 | 104 | 1.639603% |
| C | 6343 | 40 | 0.630616% |
| D | 6343 | 48 | 0.756740% |
Noise dominated data is calculated using 1-second bins in cleaned event files. If a bin has >2000 counts, and if more than 50% of those come from <1% of pixels, then it is considered to be noise-dominated and hence unusable.
| Quadrant | # 1 sec bins | Bins with >0 counts | Bins with >2000 counts | High rate bins dominated by noise | Noise dominated (total time) | Noise dominated (detector-on time) | Marked lightcurve |
|---|---|---|---|---|---|---|---|
| A | 7329 | 6344 | 247 | 247 | 3.37% | 3.89% | 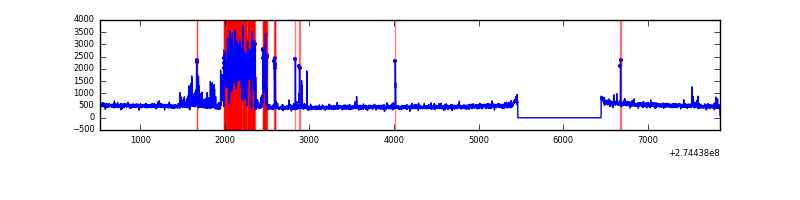 |
| B | 7329 | 6344 | 78 | 78 | 1.06% | 1.23% | 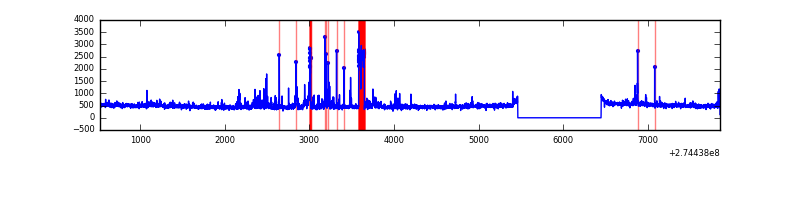 |
| C | 7329 | 6345 | 0 | 0 | 0.00% | 0.00% | 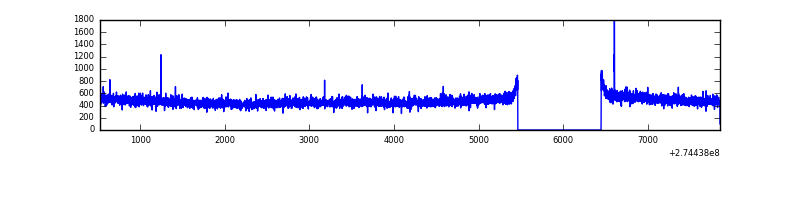 |
| D | 7329 | 6344 | 27 | 27 | 0.37% | 0.43% | 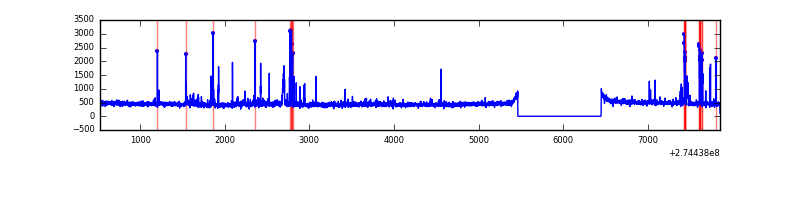 |
Top three noisy pixels from each quadrant. If the there are fewer than three noisy pixels in the level2.evt file, extra rows are filled as -1
| Pixel properties | Quadrant properties | ||||||
|---|---|---|---|---|---|---|---|
| Quadrant | DetID | PixID | Counts | Sigma | Mean | Median | Sigma |
| A | 15 | 239 | 933914 | 6215.28 | 743 | 728 | 150.1 |
| A | 13 | 210 | 20084 | 128.92 | 743 | 728 | 150.1 |
| A | 15 | 69 | 8843 | 54.05 | 743 | 728 | 150.1 |
| B | 10 | 245 | 168040 | 1175.69 | 745 | 726 | 142.3 |
| B | 7 | 220 | 109913 | 767.24 | 745 | 726 | 142.3 |
| B | 15 | 222 | 26069 | 178.08 | 745 | 726 | 142.3 |
| C | 14 | 238 | 110264 | 659.18 | 714 | 717 | 166.2 |
| C | 3 | 233 | 73593 | 438.52 | 714 | 717 | 166.2 |
| C | 0 | 207 | 9994 | 55.82 | 714 | 717 | 166.2 |
| D | 10 | 70 | 57574 | 315.15 | 733 | 709 | 180.4 |
| D | 12 | 218 | 57212 | 313.14 | 733 | 709 | 180.4 |
| D | 2 | 152 | 50489 | 275.88 | 733 | 709 | 180.4 |
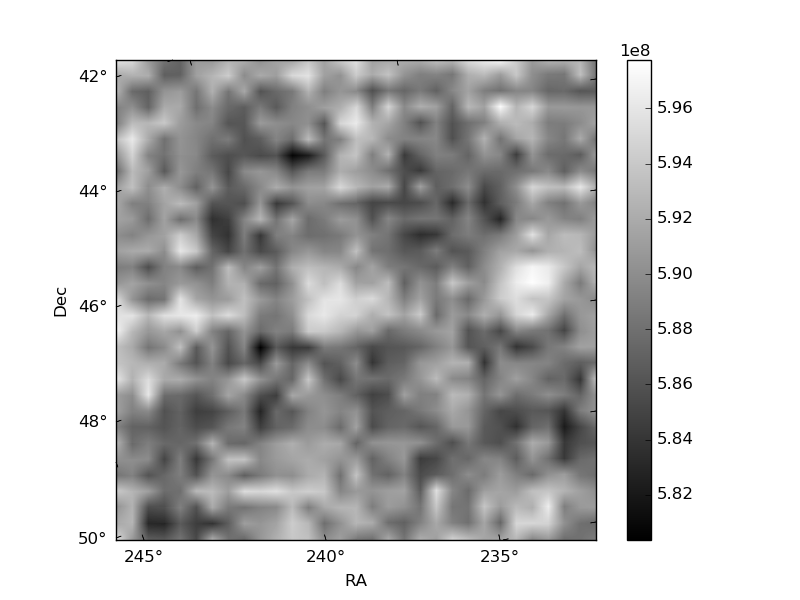
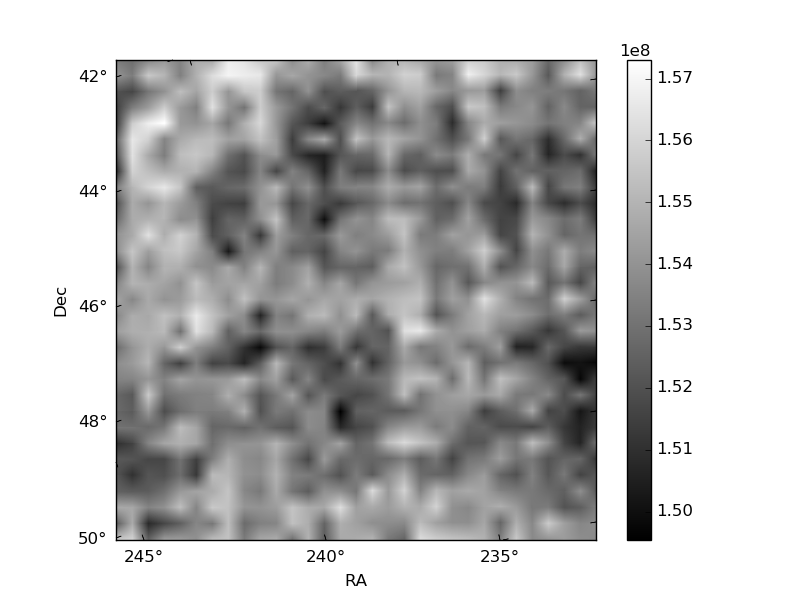
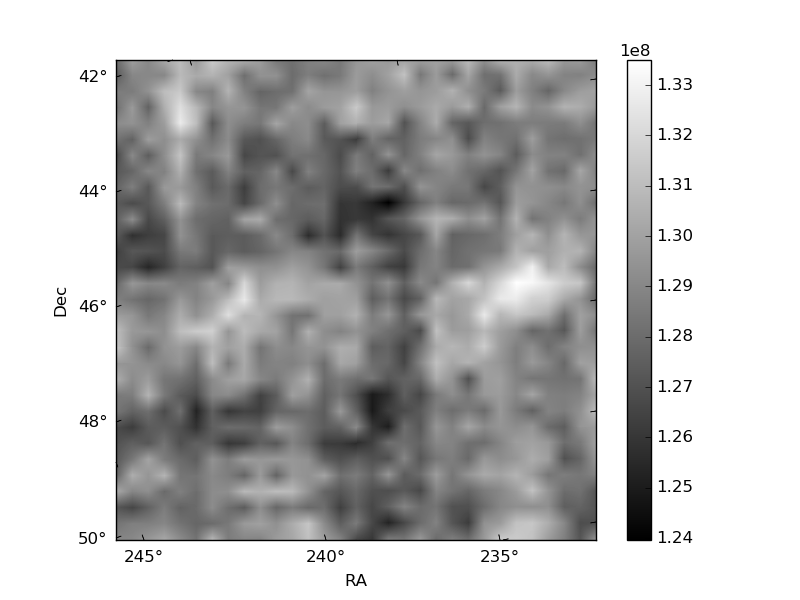
Histogram calculated using DETX and DETY for each event in the final _common_clean file
| Quadrant A | 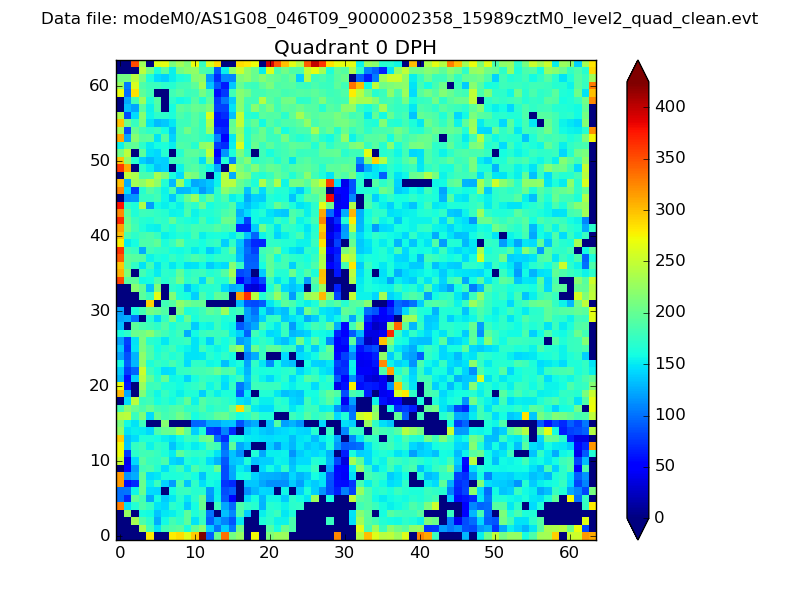 |
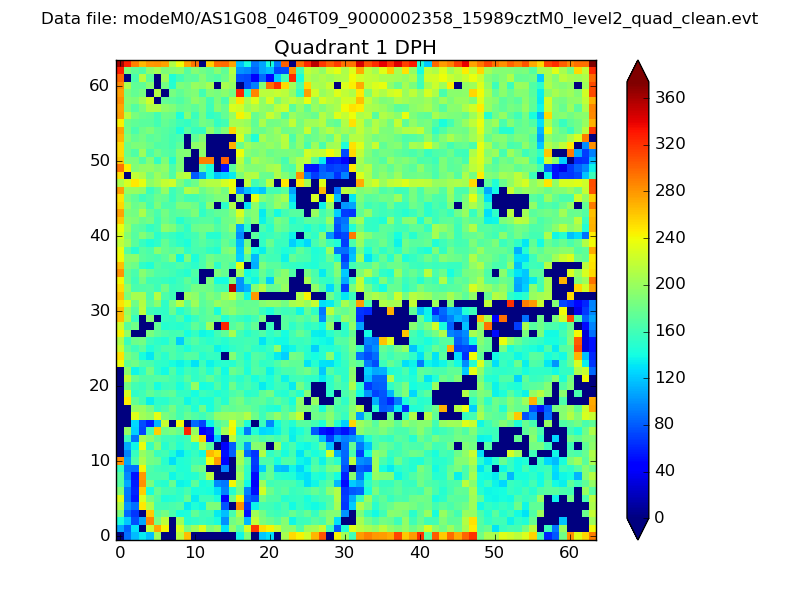 |
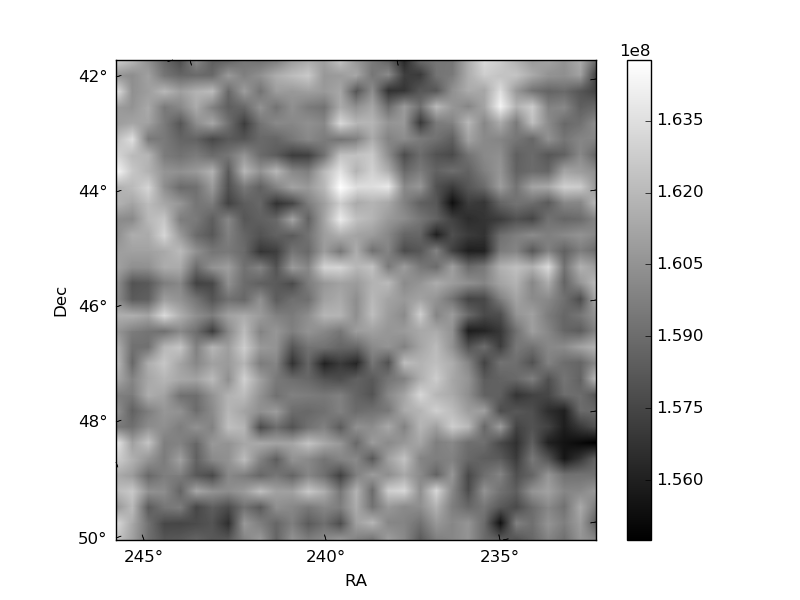
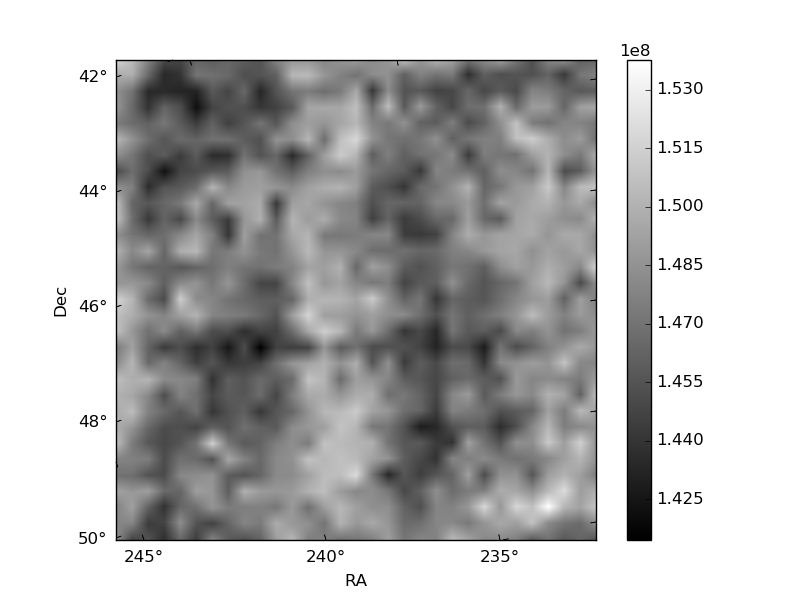
Quadrant B |
|---|---|---|---|
| Quadrant D | 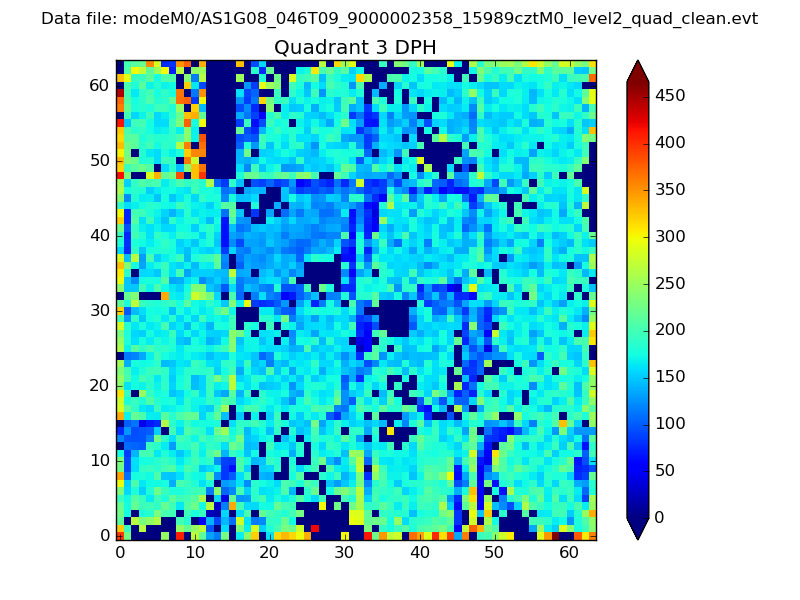 |
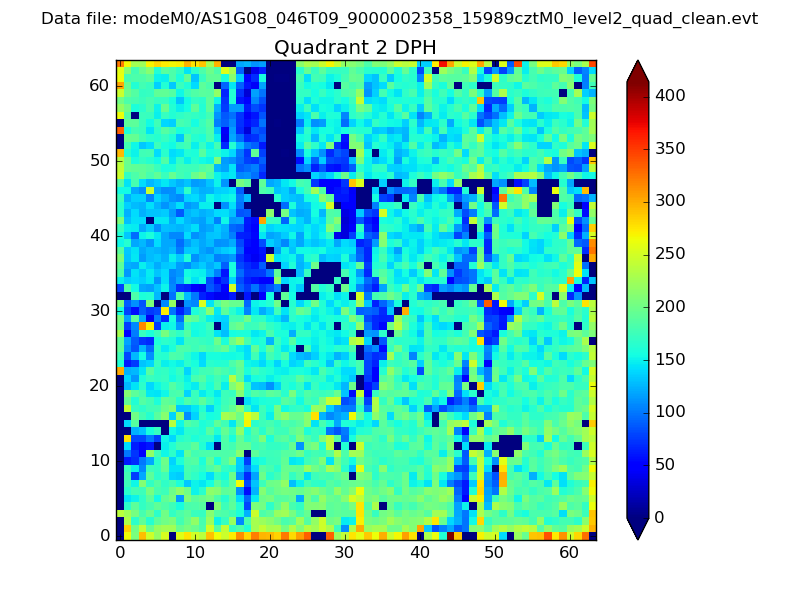 |
Quadrant C |
| Plot type | Count rate plots | Images |
|---|---|---|
| Comparison with Poisson distribution Blue bars denote a histogram of data divided into 1 sec bins. Red curve is a Poisson curve with rate = median count rate of data. |
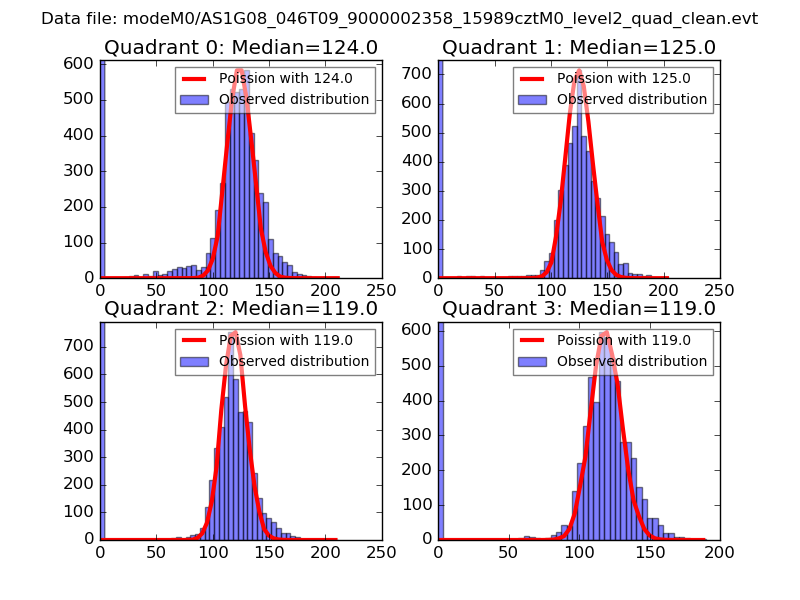 |
 |
| Quadrant-wise count rates Data is divided into 100 sec bins |
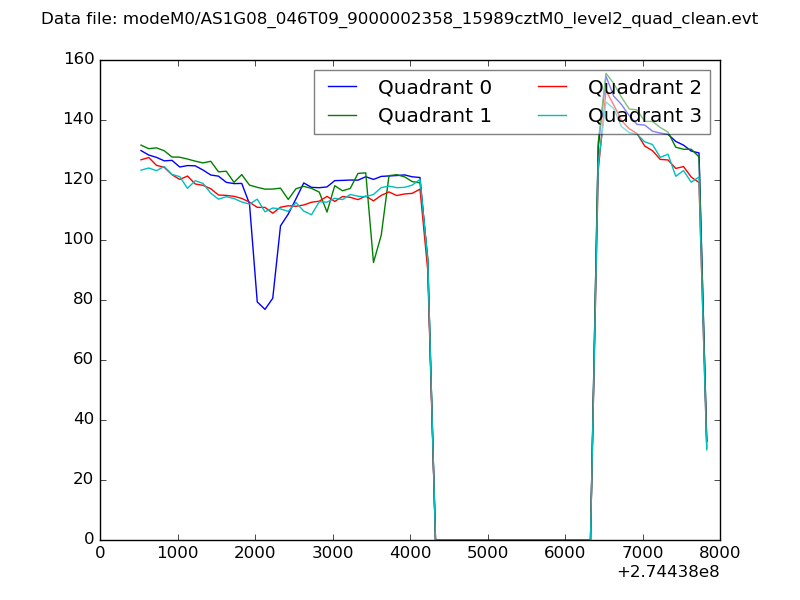 |
|
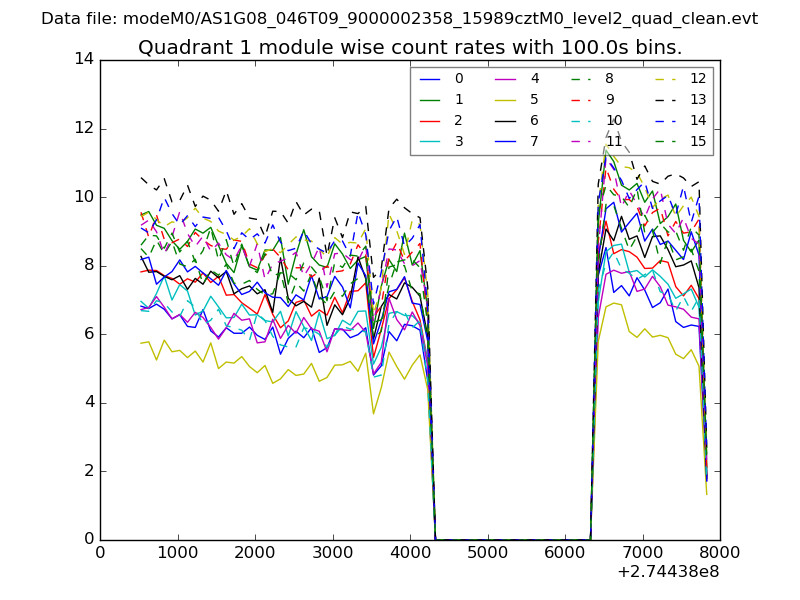
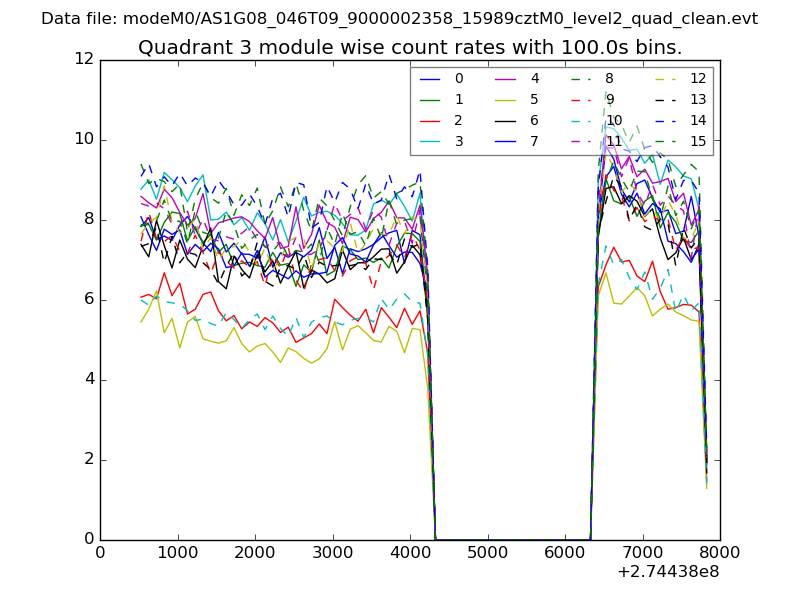
| Module-wise count rates for Quadrant A Data is divided into 100 sec bins |
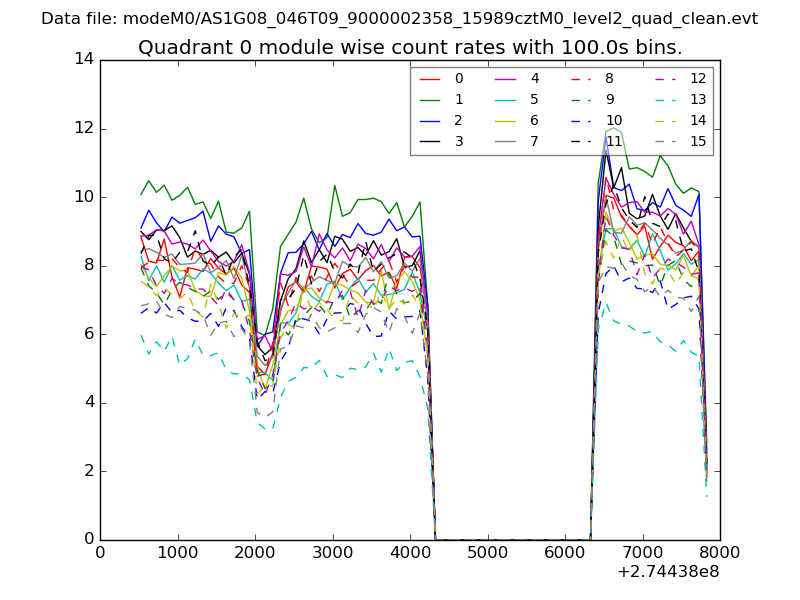 |
 |
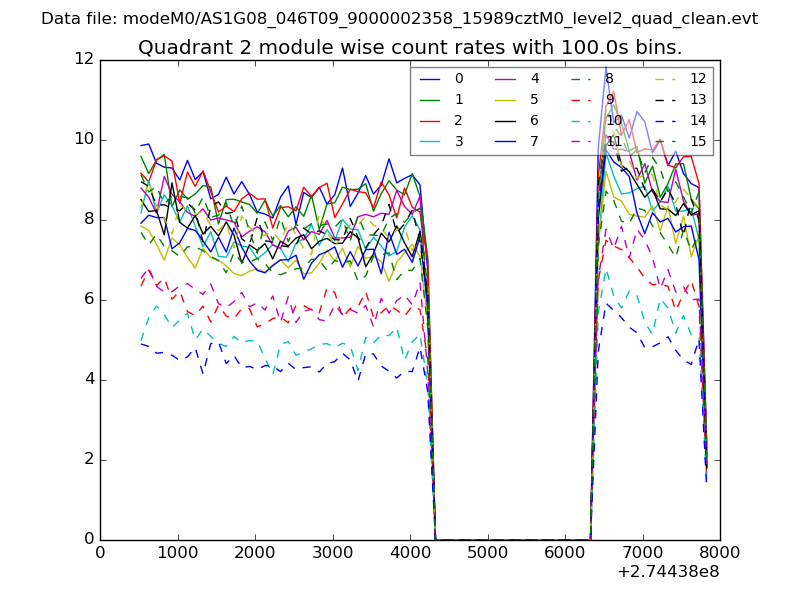
| Module-wise count rates for Quadrant B Data is divided into 100 sec bins |
 |
 |
| Module-wise count rates for Quadrant C Data is divided into 100 sec bins |
 |
 |
| Module-wise count rates for Quadrant D Data is divided into 100 sec bins |
 |
 |
| Parameter | Plot |
|---|---|
| CZT HV Monitor | 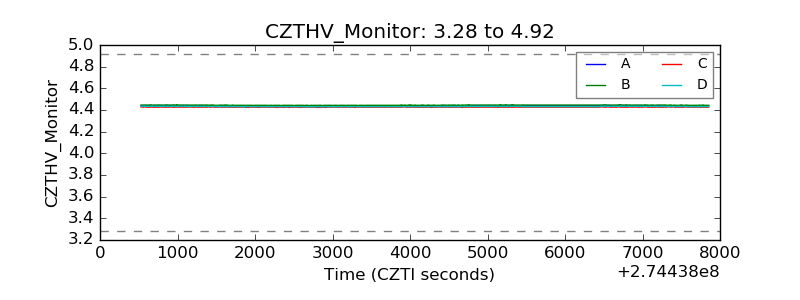 |
| D_VDD | 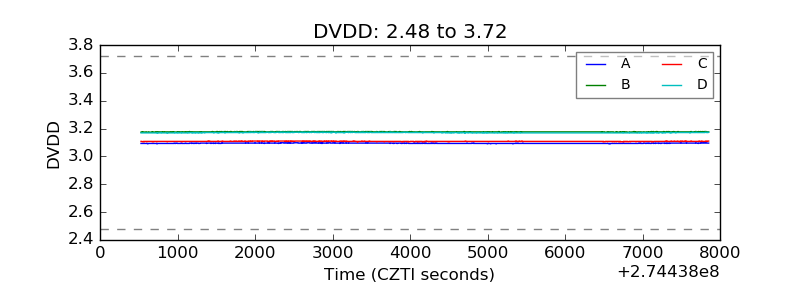 |
| Temperature 1 | 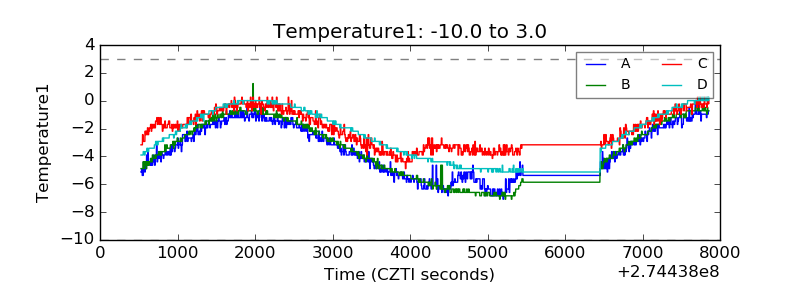 |
| Veto HV Monitor | 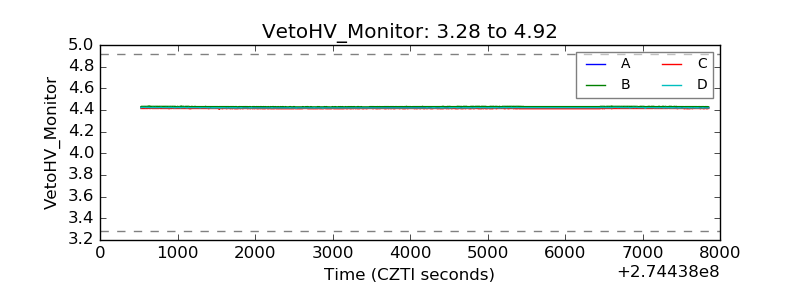 |
| Veto LLD | 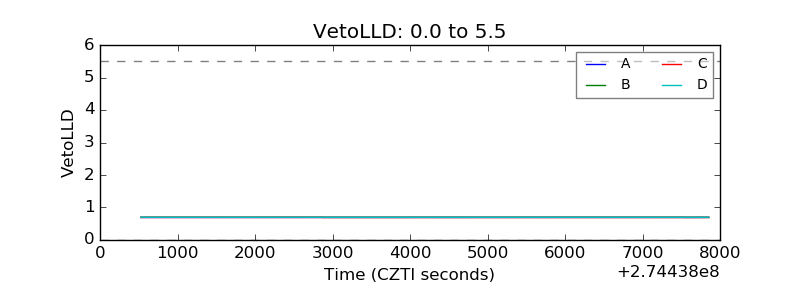 |
| Alpha Counter | 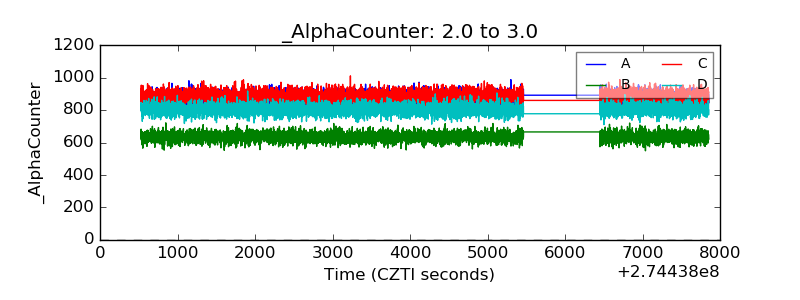 |
| _CPM_Rate | 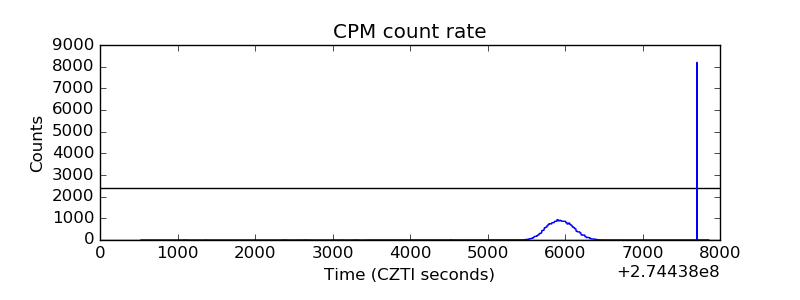 |
| CZT Counter | 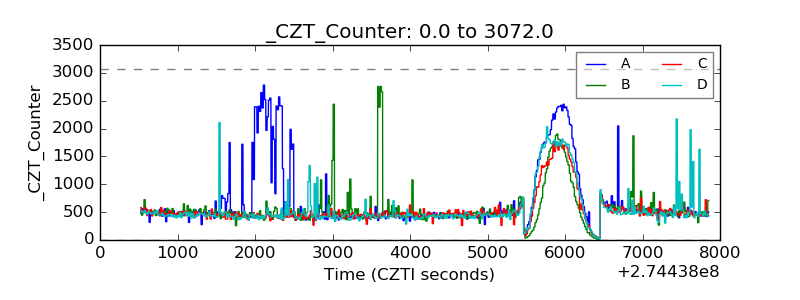 |
| +2.5 Volts monitor | 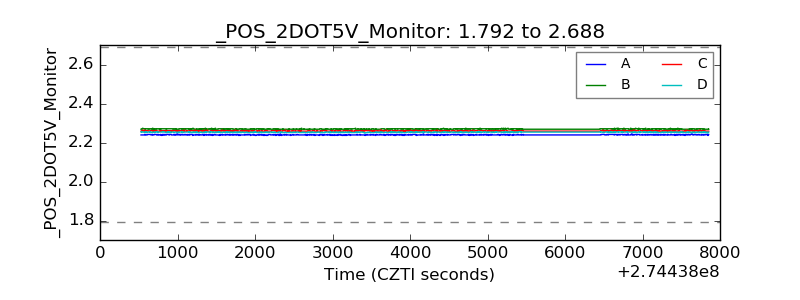 |
| +5 Volts monitor | 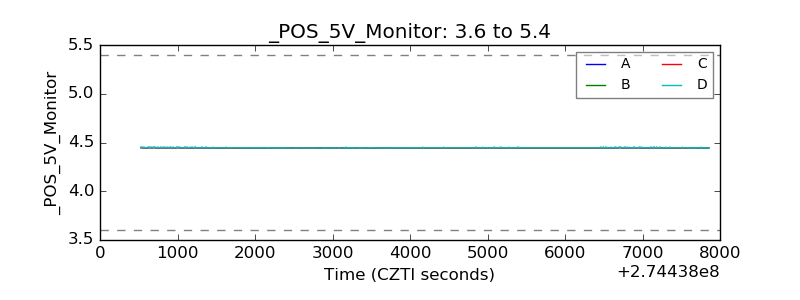 |
| _ROLL_ROT | 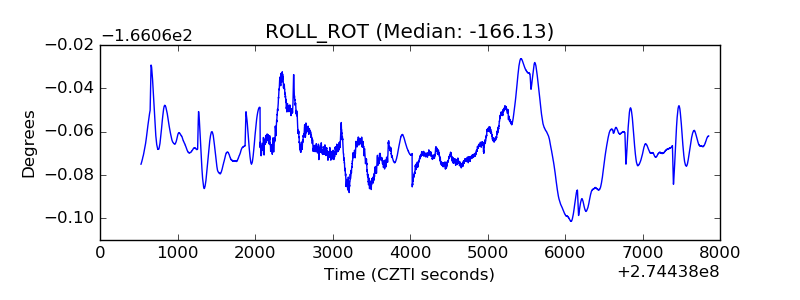 |
| _Roll_DEC | 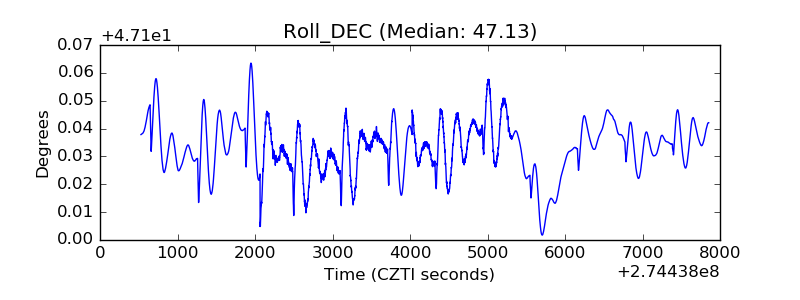 |
| _Roll_RA | 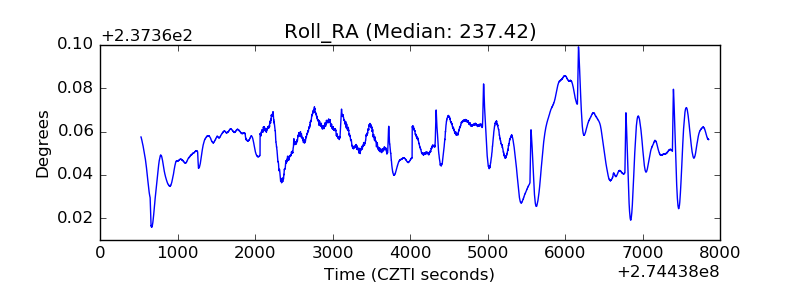 |
| Veto Counter | 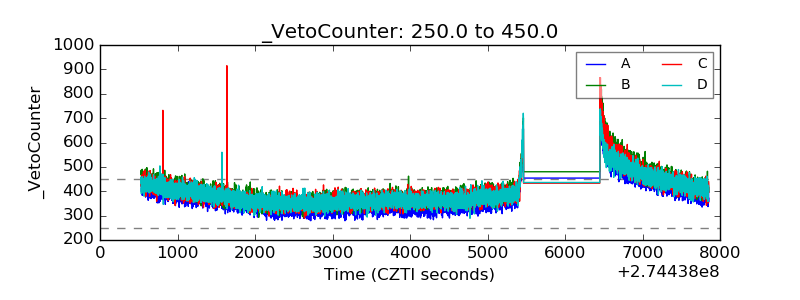 |