| Param | Original file | Final file |
|---|---|---|
| Filename | modeM0/AS1G08_046T09_9000002358_15991cztM0_level2.evt | modeM0/AS1G08_046T09_9000002358_15991cztM0_level2_quad_clean.evt |
| Size (bytes) | 434,206,080 | 96,932,160 |
| Size | 414.1 MB | 92.4 MB |
| Events in quadrant A | 3,132,391 | 638,852 |
| Events in quadrant B | 3,389,248 | 642,598 |
| Events in quadrant C | 3,008,706 | 607,463 |
| Events in quadrant D | 3,192,189 | 607,898 |
| Mode M0 | |||
|---|---|---|---|
| Quadrant | BADHDUFLAG | Total packets | Discarded packets |
| A | 0 | 13543 | 2 |
| B | 0 | 14070 | 1 |
| C | 0 | 12993 | 1 |
| D | 0 | 13764 | 1 |
| Mode M9 | |||
|---|---|---|---|
| Quadrant | BADHDUFLAG | Total packets | Discarded packets |
| A | 0 | 11 | 0 |
| B | 0 | 11 | 0 |
| C | 0 | 11 | 0 |
| D | 0 | 11 | 0 |
| Mode SS | |||
|---|---|---|---|
| Quadrant | BADHDUFLAG | Total packets | Discarded packets |
| A | 0 | 128 | 0 |
| B | 0 | 128 | 0 |
| C | 0 | 128 | 0 |
| D | 0 | 128 | 0 |
| Quadrant | Total seconds | Saturated seconds | Saturation percentage |
|---|---|---|---|
| A | 6285 | 123 | 1.957041% |
| B | 6285 | 72 | 1.145585% |
| C | 6285 | 60 | 0.954654% |
| D | 6285 | 80 | 1.272872% |
Noise dominated data is calculated using 1-second bins in cleaned event files. If a bin has >2000 counts, and if more than 50% of those come from <1% of pixels, then it is considered to be noise-dominated and hence unusable.
| Quadrant | # 1 sec bins | Bins with >0 counts | Bins with >2000 counts | High rate bins dominated by noise | Noise dominated (total time) | Noise dominated (detector-on time) | Marked lightcurve |
|---|---|---|---|---|---|---|---|
| A | 7386 | 6286 | 64 | 64 | 0.87% | 1.02% | 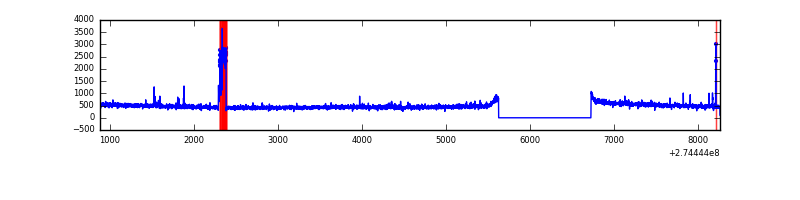 |
| B | 7386 | 6286 | 23 | 23 | 0.31% | 0.37% | 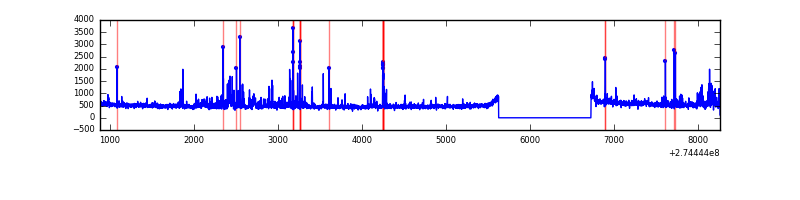 |
| C | 7386 | 6286 | 0 | 0 | 0.00% | 0.00% | 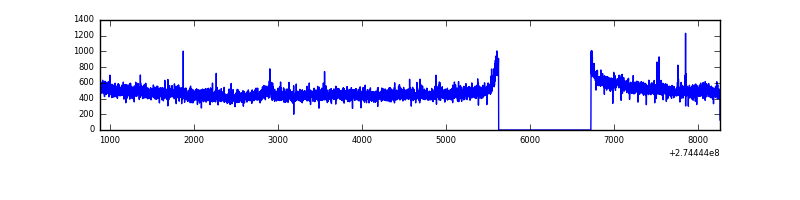 |
| D | 7386 | 6286 | 40 | 40 | 0.54% | 0.64% | 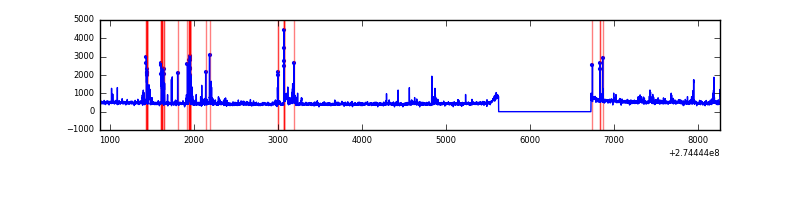 |
Top three noisy pixels from each quadrant. If the there are fewer than three noisy pixels in the level2.evt file, extra rows are filled as -1
| Pixel properties | Quadrant properties | ||||||
|---|---|---|---|---|---|---|---|
| Quadrant | DetID | PixID | Counts | Sigma | Mean | Median | Sigma |
| A | 15 | 157 | 167691 | 1097.33 | 758 | 743 | 152.1 |
| A | 15 | 239 | 17365 | 109.25 | 758 | 743 | 152.1 |
| A | 13 | 210 | 16978 | 106.71 | 758 | 743 | 152.1 |
| B | 7 | 220 | 150035 | 1060.72 | 755 | 737 | 140.8 |
| B | 10 | 245 | 98235 | 692.7 | 755 | 737 | 140.8 |
| B | 3 | 209 | 38585 | 268.9 | 755 | 737 | 140.8 |
| C | 14 | 238 | 110712 | 654.98 | 722 | 726 | 167.9 |
| C | 3 | 233 | 63347 | 372.91 | 722 | 726 | 167.9 |
| C | 0 | 207 | 20642 | 118.6 | 722 | 726 | 167.9 |
| D | 10 | 70 | 110580 | 607.29 | 741 | 717 | 180.9 |
| D | 2 | 120 | 74589 | 408.34 | 741 | 717 | 180.9 |
| D | 2 | 152 | 42144 | 229.0 | 741 | 717 | 180.9 |
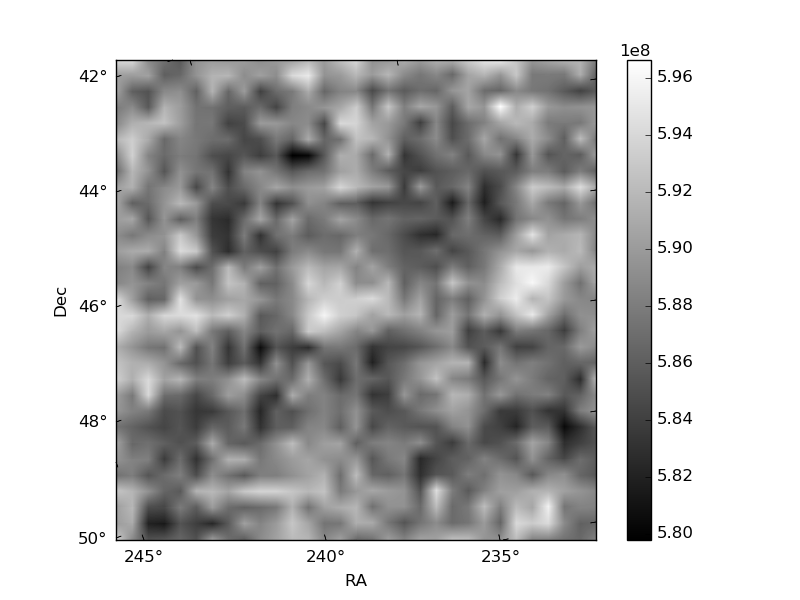
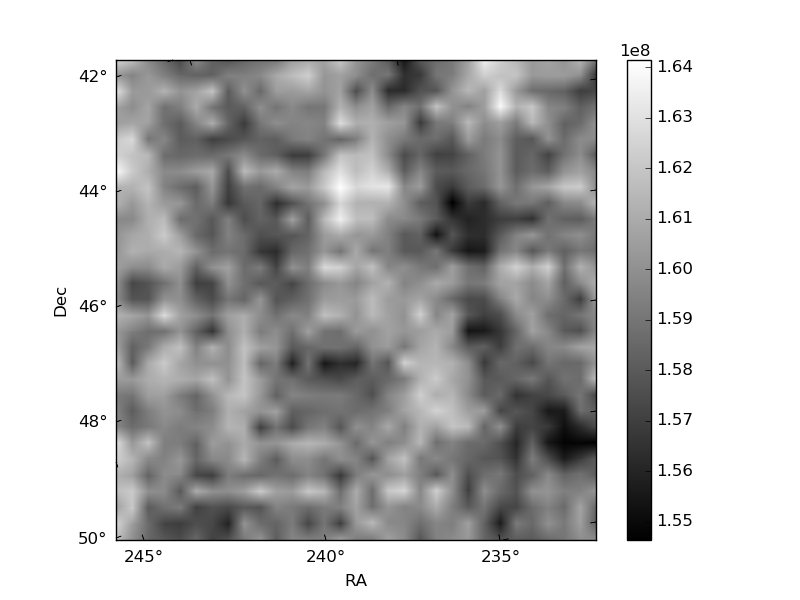
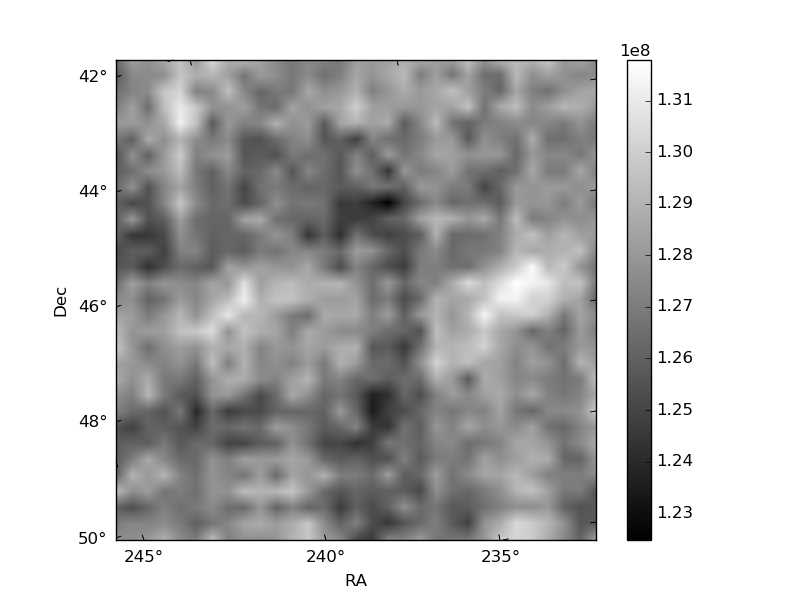
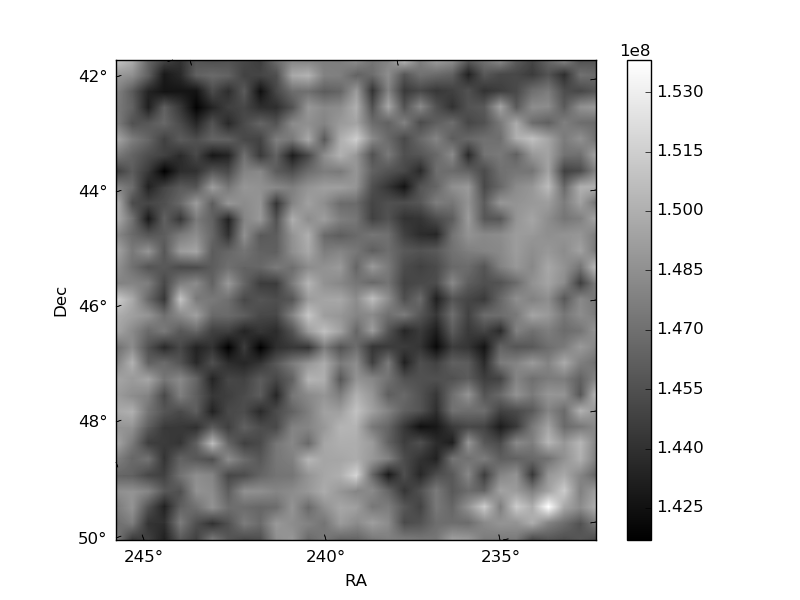
Histogram calculated using DETX and DETY for each event in the final _common_clean file
| Quadrant A | 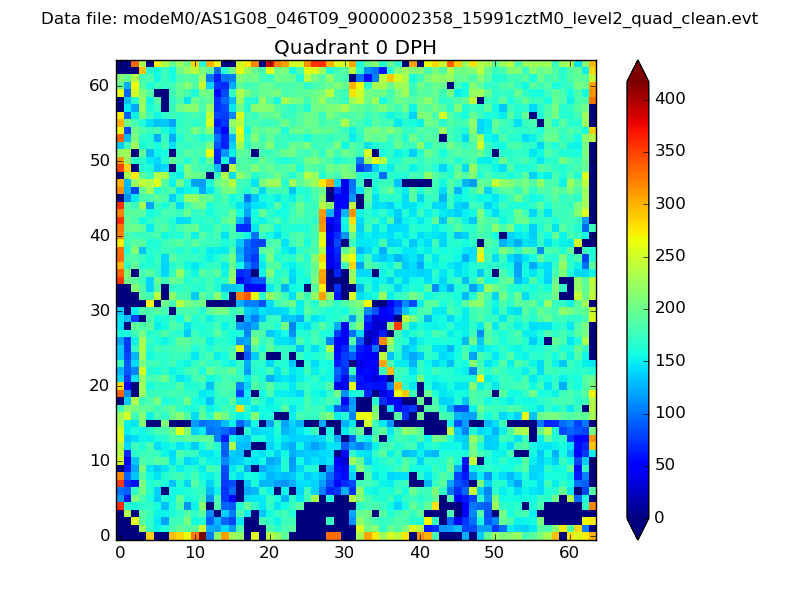 |
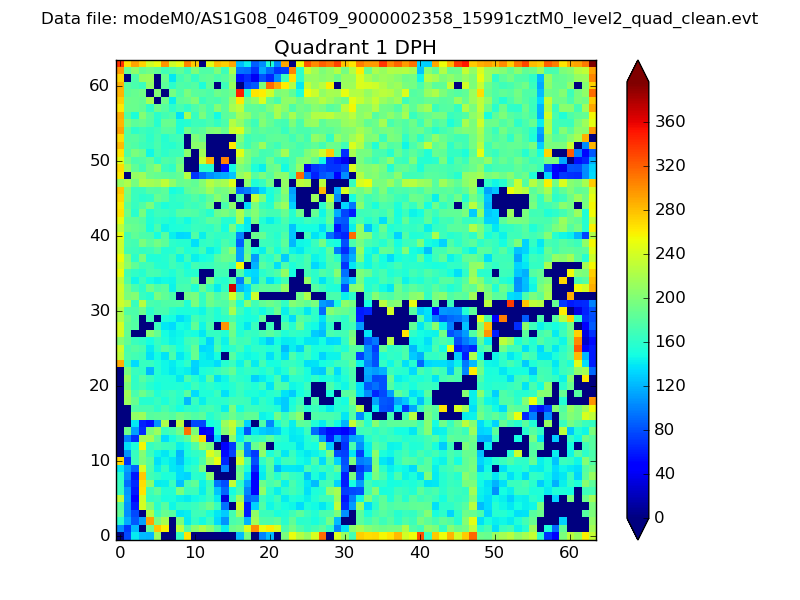 |
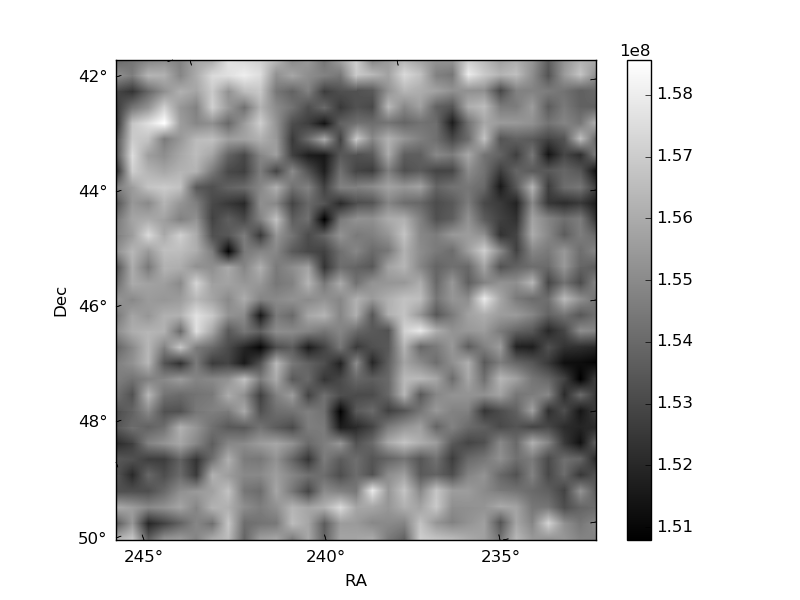
Quadrant B |
|---|---|---|---|
| Quadrant D | 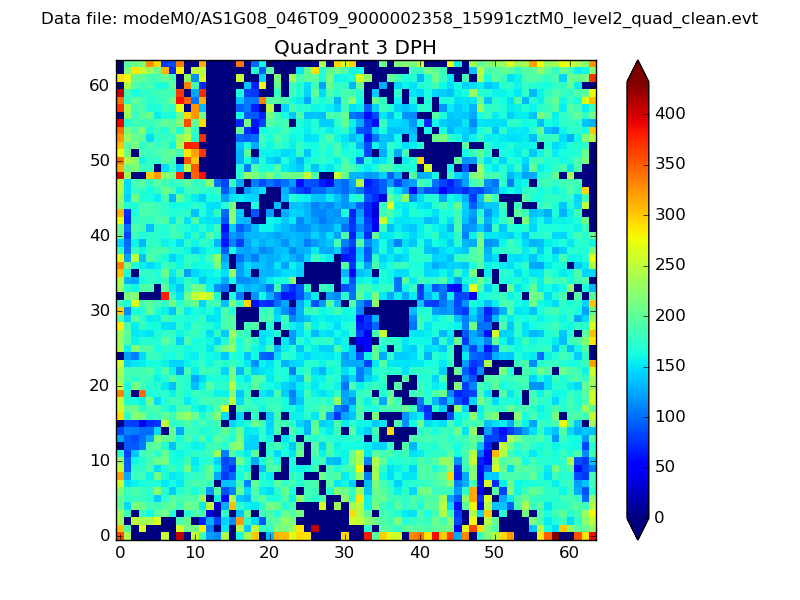 |
 |
Quadrant C |
| Plot type | Count rate plots | Images |
|---|---|---|
| Comparison with Poisson distribution Blue bars denote a histogram of data divided into 1 sec bins. Red curve is a Poisson curve with rate = median count rate of data. |
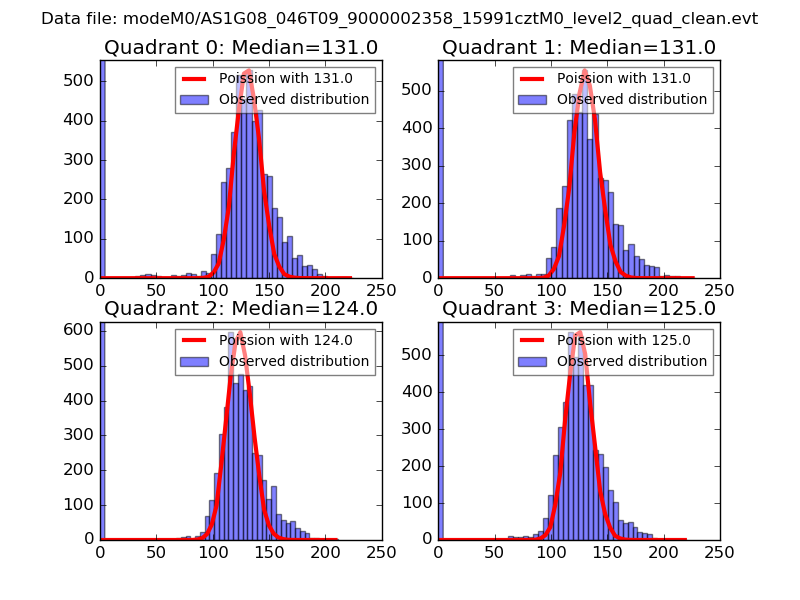 |
 |
| Quadrant-wise count rates Data is divided into 100 sec bins |
 |
|
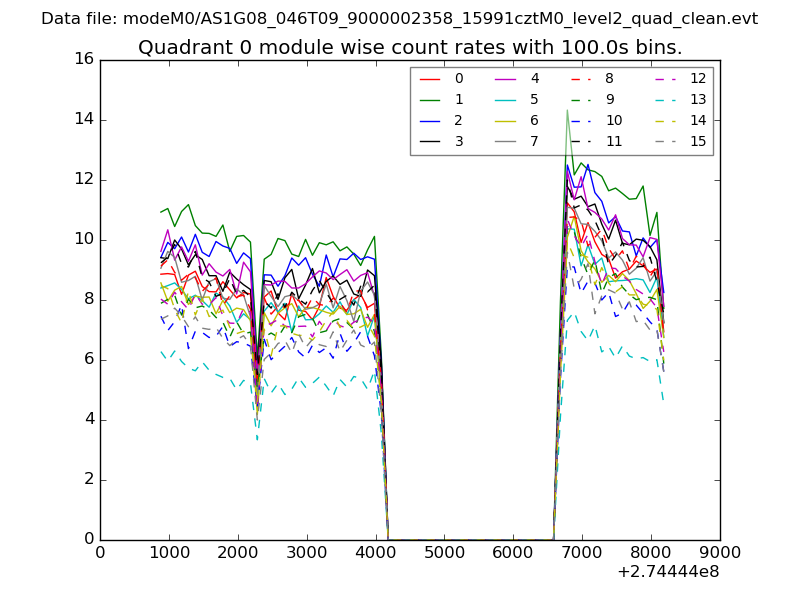
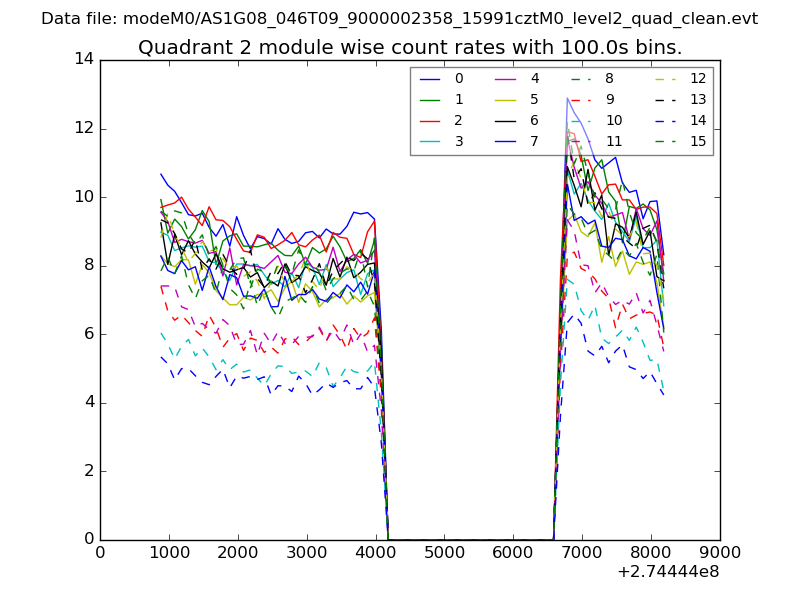
| Module-wise count rates for Quadrant A Data is divided into 100 sec bins |
 |
 |
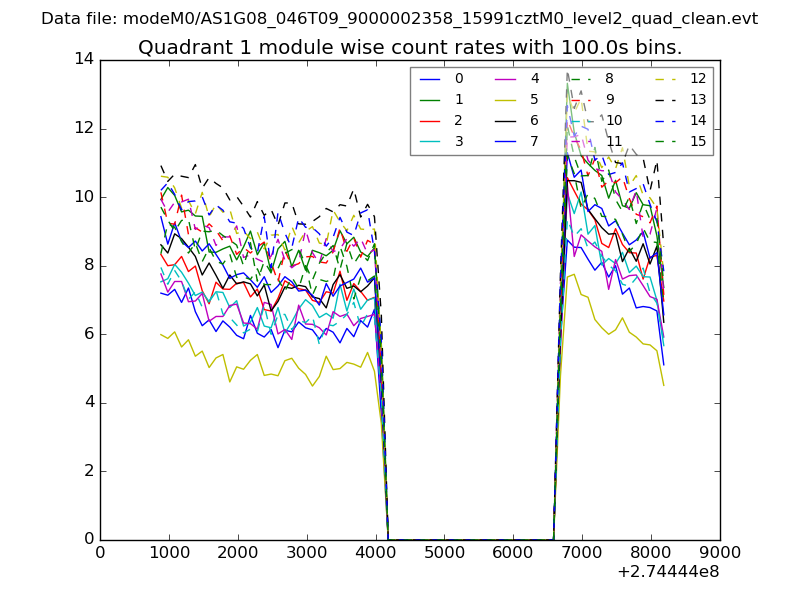
| Module-wise count rates for Quadrant B Data is divided into 100 sec bins |
 |
 |
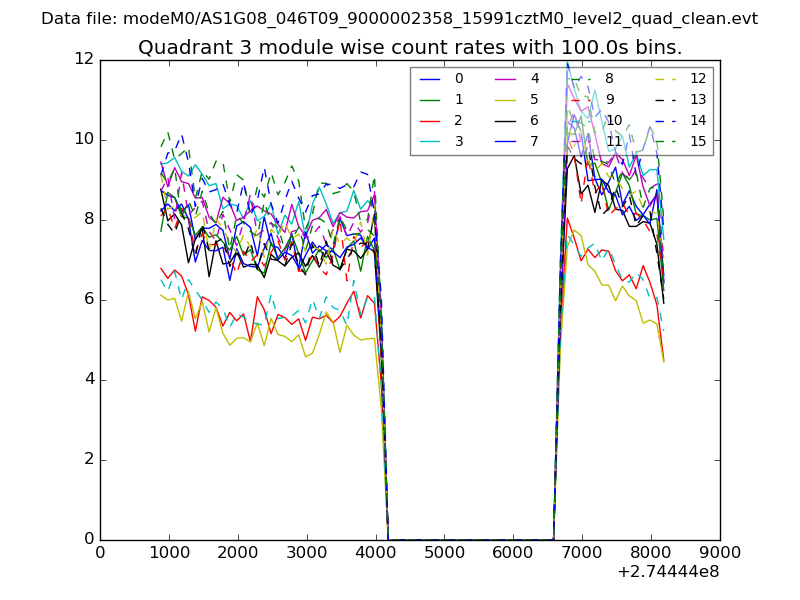
| Module-wise count rates for Quadrant C Data is divided into 100 sec bins |
 |
 |
| Module-wise count rates for Quadrant D Data is divided into 100 sec bins |
 |
 |
| Parameter | Plot |
|---|---|
| CZT HV Monitor | 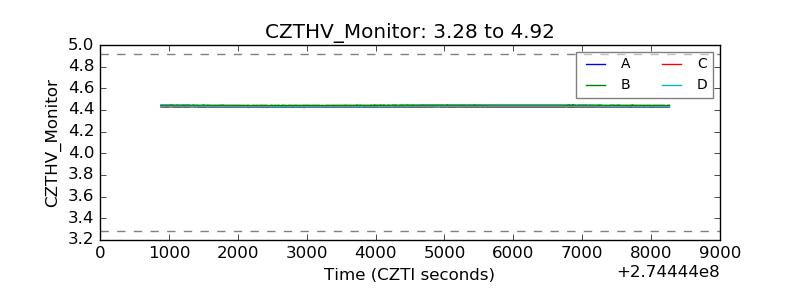 |
| D_VDD | 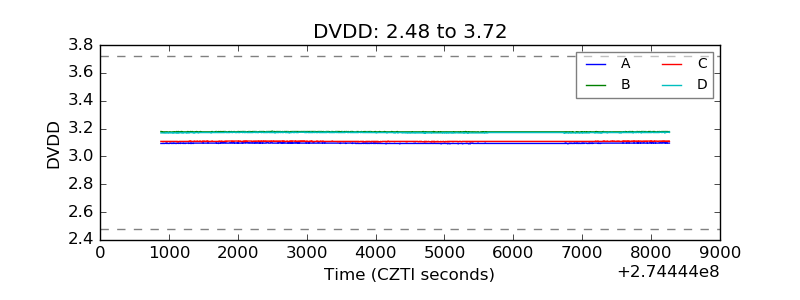 |
| Temperature 1 | 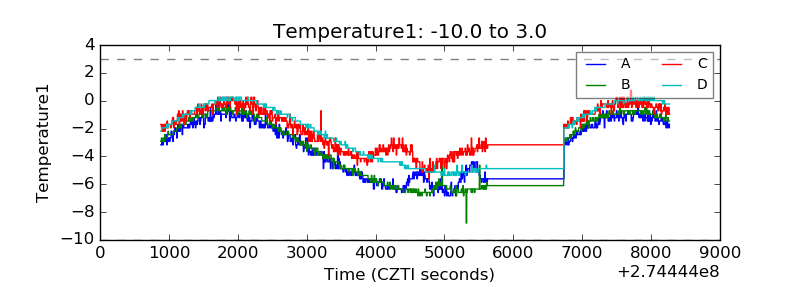 |
| Veto HV Monitor |  |
| Veto LLD | 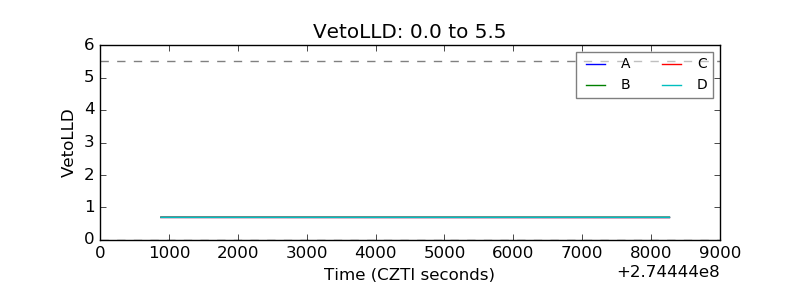 |
| Alpha Counter | 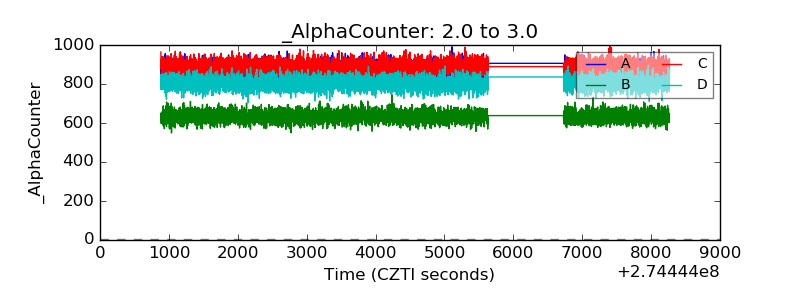 |
| _CPM_Rate | 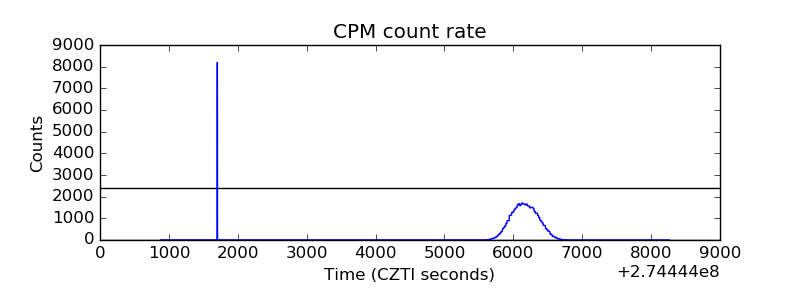 |
| CZT Counter | 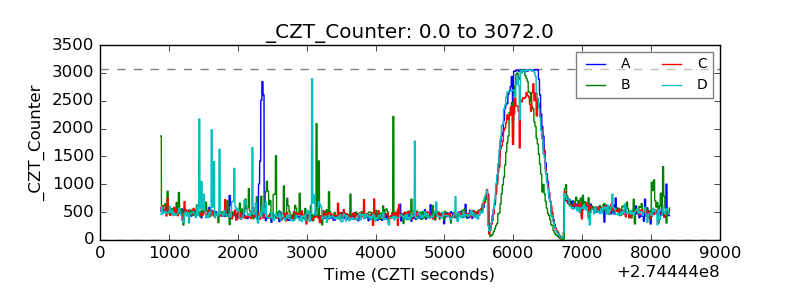 |
| +2.5 Volts monitor |  |
| +5 Volts monitor | 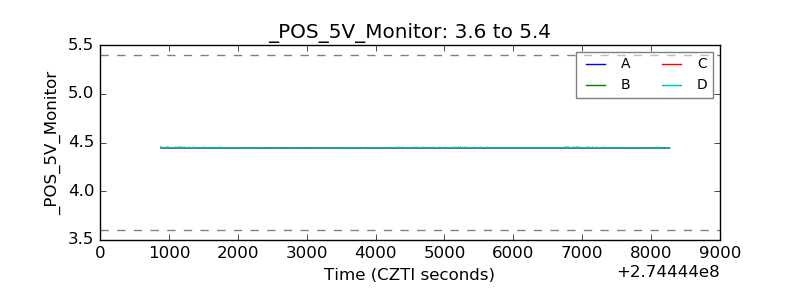 |
| _ROLL_ROT | 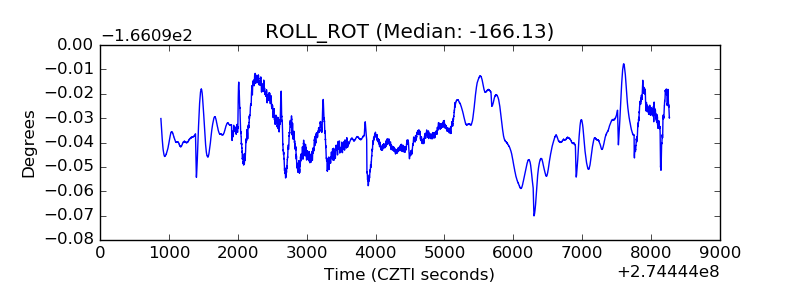 |
| _Roll_DEC | 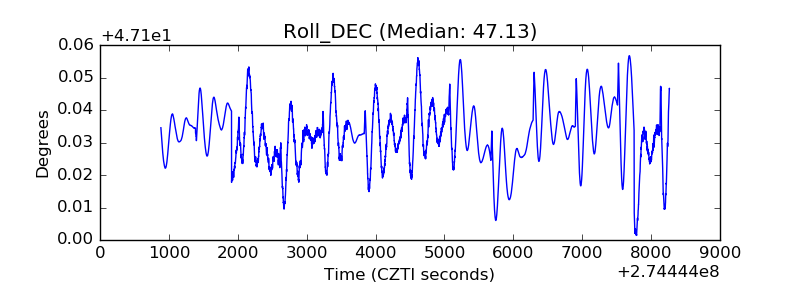 |
| _Roll_RA | 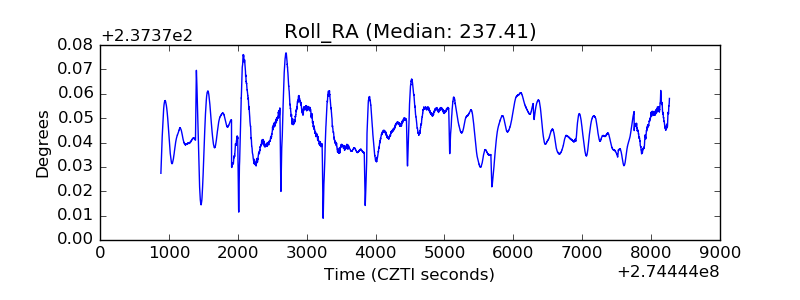 |
| Veto Counter | 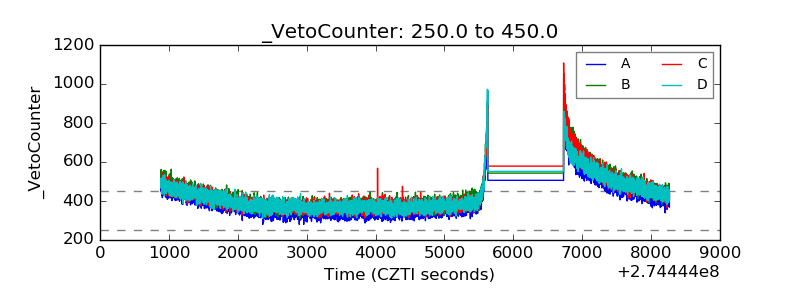 |