| Param | Original file | Final file |
|---|---|---|
| Filename | modeM0/AS1G08_046T09_9000002358_15992cztM0_level2.evt | modeM0/AS1G08_046T09_9000002358_15992cztM0_level2_quad_clean.evt |
| Size (bytes) | 230,469,120 | 53,893,440 |
| Size | 219.8 MB | 51.4 MB |
| Events in quadrant A | 1,569,385 | 357,737 |
| Events in quadrant B | 1,972,635 | 354,164 |
| Events in quadrant C | 1,566,382 | 338,782 |
| Events in quadrant D | 1,638,198 | 339,806 |
| Mode M0 | |||
|---|---|---|---|
| Quadrant | BADHDUFLAG | Total packets | Discarded packets |
| A | 0 | 6930 | 0 |
| B | 0 | 7991 | 0 |
| C | 0 | 6853 | 0 |
| D | 0 | 7206 | 0 |
| Mode SS | |||
|---|---|---|---|
| Quadrant | BADHDUFLAG | Total packets | Discarded packets |
| A | 0 | 68 | 0 |
| B | 0 | 68 | 0 |
| C | 0 | 68 | 0 |
| D | 0 | 68 | 0 |
| Quadrant | Total seconds | Saturated seconds | Saturation percentage |
|---|---|---|---|
| A | 3402 | 2 | 0.058789% |
| B | 3402 | 35 | 1.028807% |
| C | 3402 | 5 | 0.146972% |
| D | 3402 | 17 | 0.499706% |
Noise dominated data is calculated using 1-second bins in cleaned event files. If a bin has >2000 counts, and if more than 50% of those come from <1% of pixels, then it is considered to be noise-dominated and hence unusable.
| Quadrant | # 1 sec bins | Bins with >0 counts | Bins with >2000 counts | High rate bins dominated by noise | Noise dominated (total time) | Noise dominated (detector-on time) | Marked lightcurve |
|---|---|---|---|---|---|---|---|
| A | 3403 | 3403 | 2 | 2 | 0.06% | 0.06% | 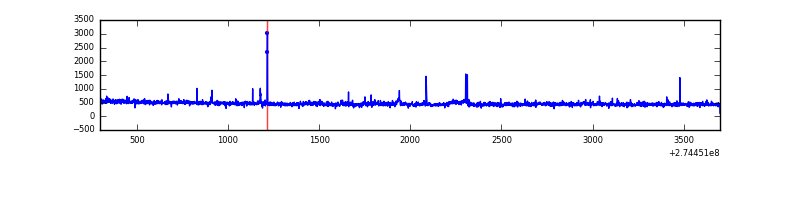 |
| B | 3403 | 3403 | 29 | 29 | 0.85% | 0.85% | 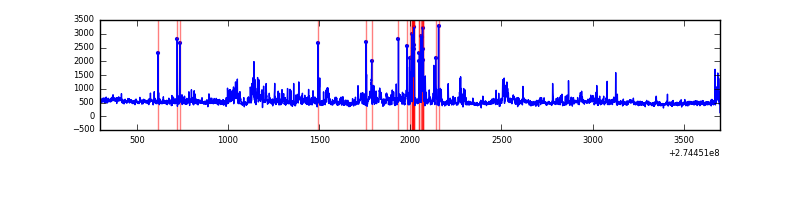 |
| C | 3403 | 3403 | 0 | 0 | 0.00% | 0.00% | 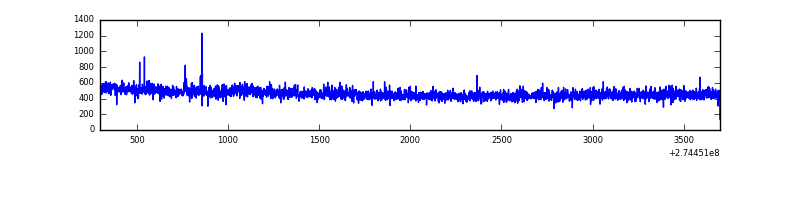 |
| D | 3403 | 3403 | 14 | 14 | 0.41% | 0.41% | 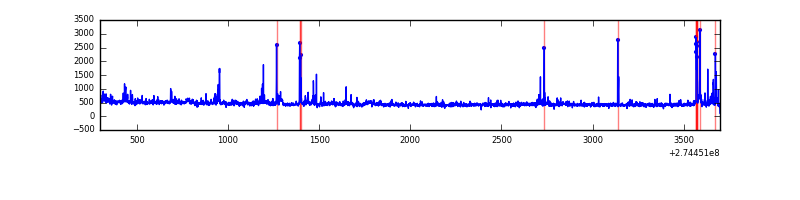 |
Top three noisy pixels from each quadrant. If the there are fewer than three noisy pixels in the level2.evt file, extra rows are filled as -1
| Pixel properties | Quadrant properties | ||||||
|---|---|---|---|---|---|---|---|
| Quadrant | DetID | PixID | Counts | Sigma | Mean | Median | Sigma |
| A | 15 | 239 | 33244 | 412.2 | 391 | 384 | 79.7 |
| A | 13 | 210 | 19119 | 235.01 | 391 | 384 | 79.7 |
| A | 12 | 96 | 7029 | 83.36 | 391 | 384 | 79.7 |
| B | 7 | 220 | 149211 | 2036.68 | 387 | 378 | 73.1 |
| B | 5 | 65 | 118914 | 1622.09 | 387 | 378 | 73.1 |
| B | 10 | 245 | 38724 | 524.74 | 387 | 378 | 73.1 |
| C | 14 | 238 | 57229 | 641.75 | 375 | 377 | 88.6 |
| C | 3 | 233 | 39544 | 442.12 | 375 | 377 | 88.6 |
| C | 0 | 207 | 6259 | 66.4 | 375 | 377 | 88.6 |
| D | 10 | 199 | 45631 | 482.32 | 383 | 372 | 93.8 |
| D | 2 | 152 | 36762 | 387.8 | 383 | 372 | 93.8 |
| D | 7 | 38 | 28459 | 299.32 | 383 | 372 | 93.8 |
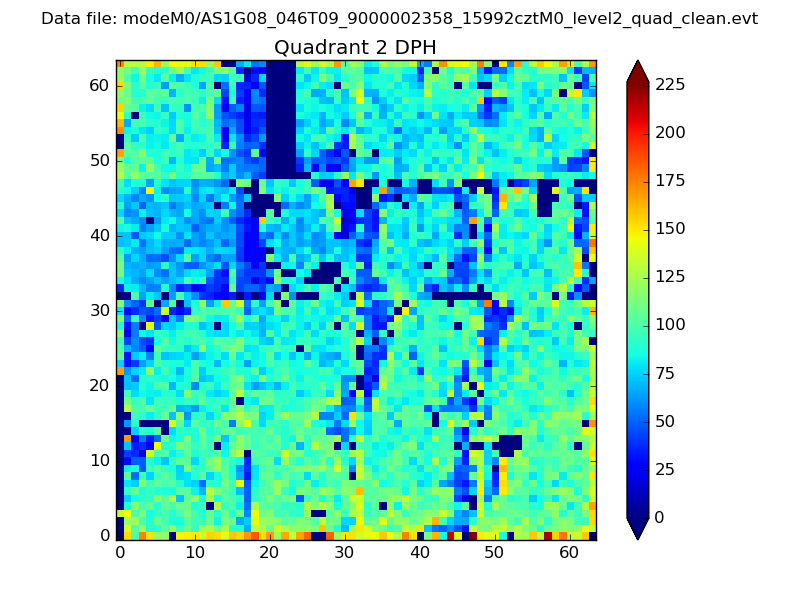
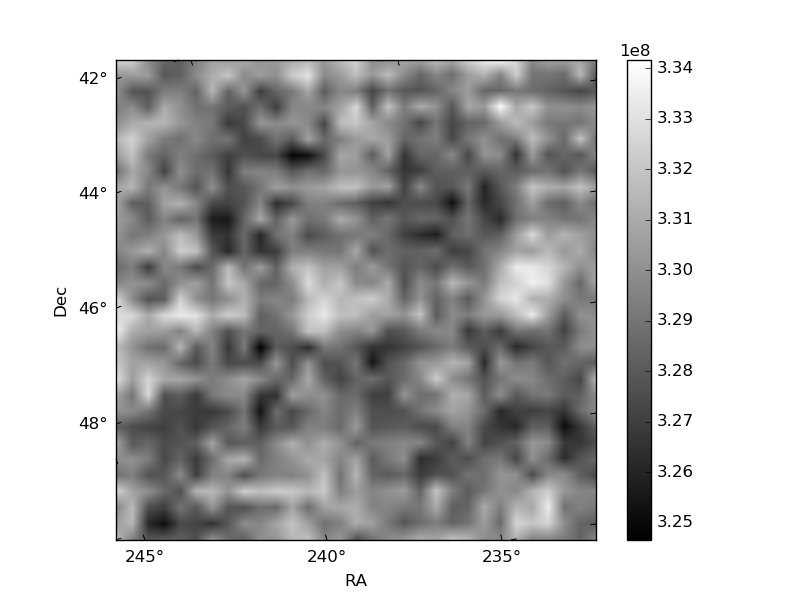
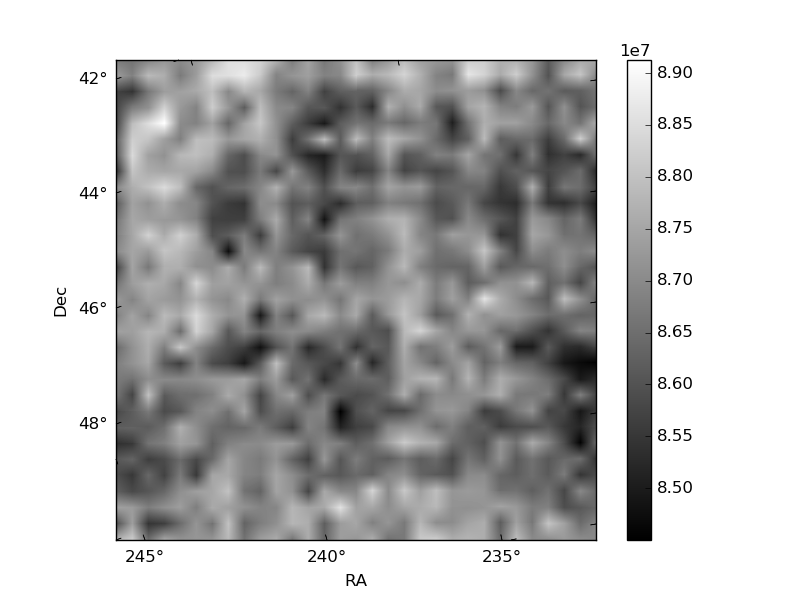
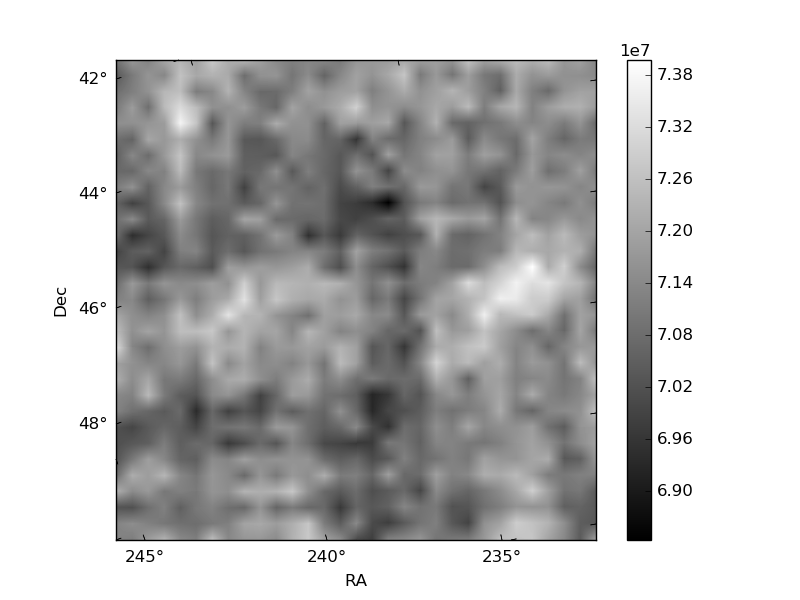
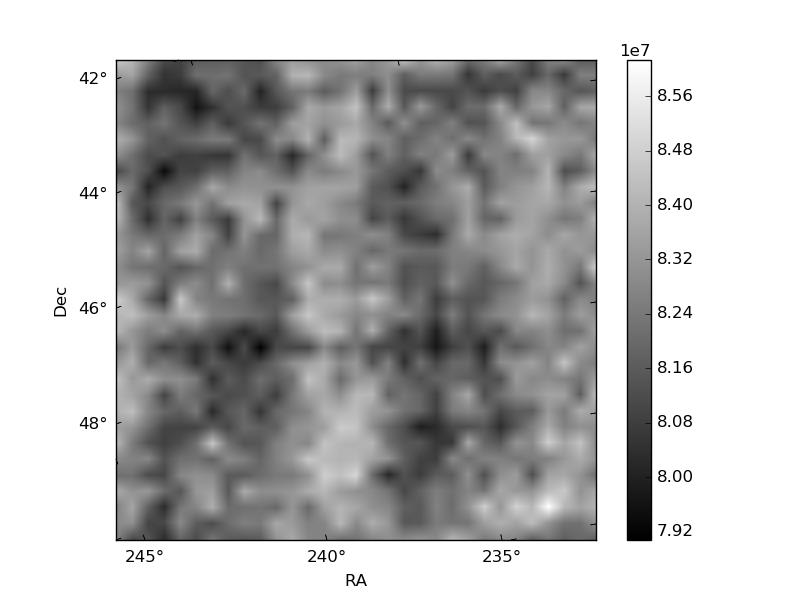
Histogram calculated using DETX and DETY for each event in the final _common_clean file
| Quadrant A | 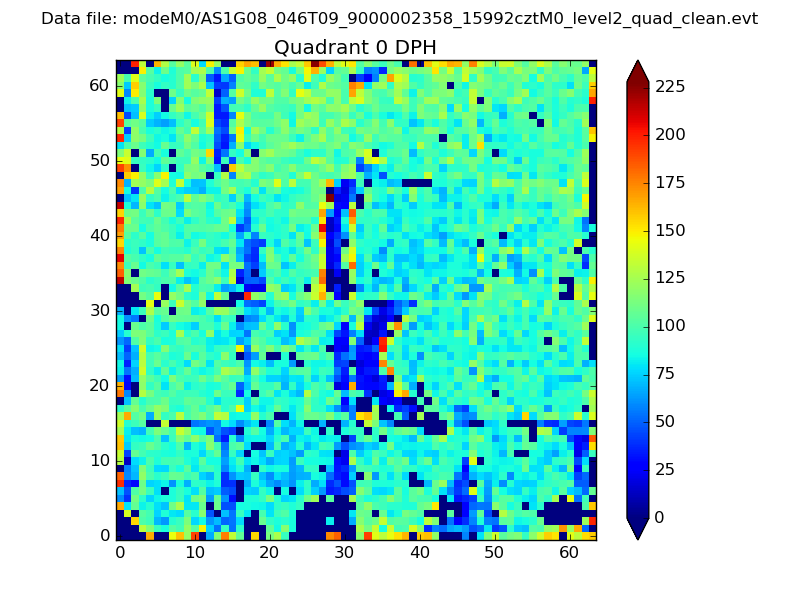 |
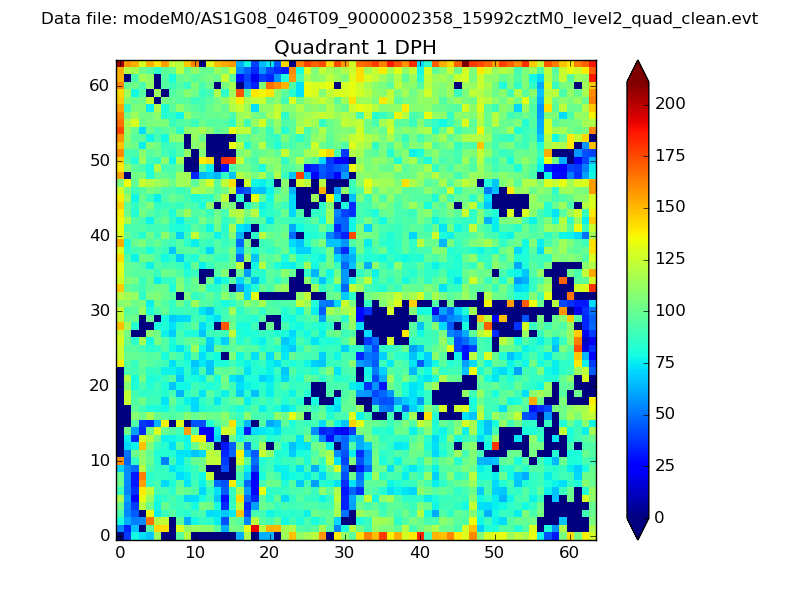 |
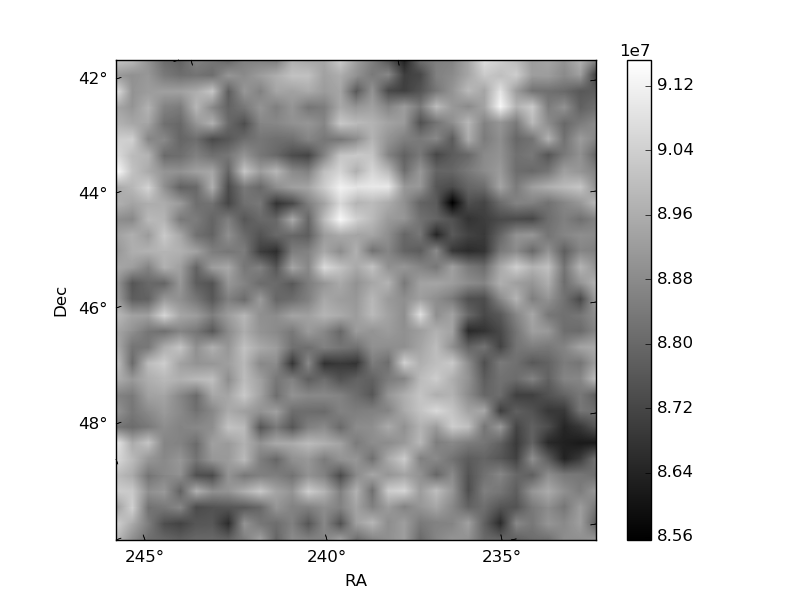
Quadrant B |
|---|---|---|---|
| Quadrant D | 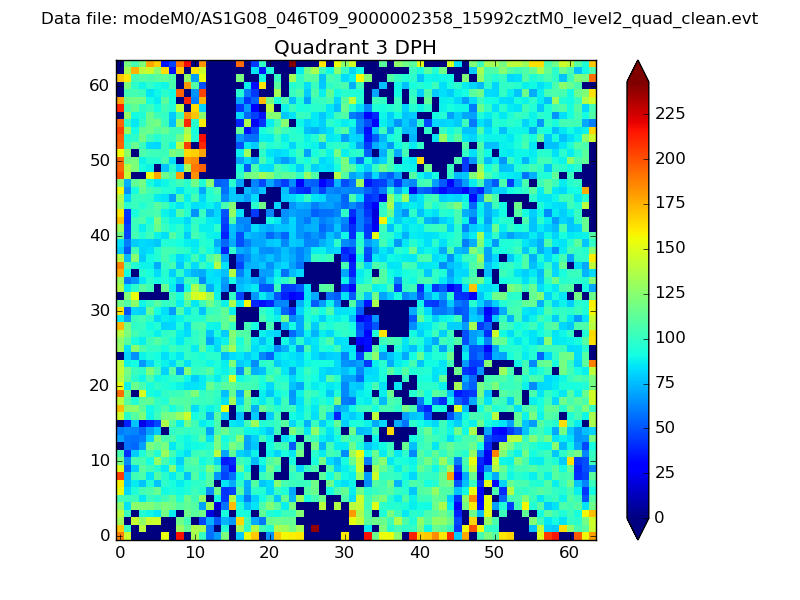 |
 |
Quadrant C |
| Plot type | Count rate plots | Images |
|---|---|---|
| Comparison with Poisson distribution Blue bars denote a histogram of data divided into 1 sec bins. Red curve is a Poisson curve with rate = median count rate of data. |
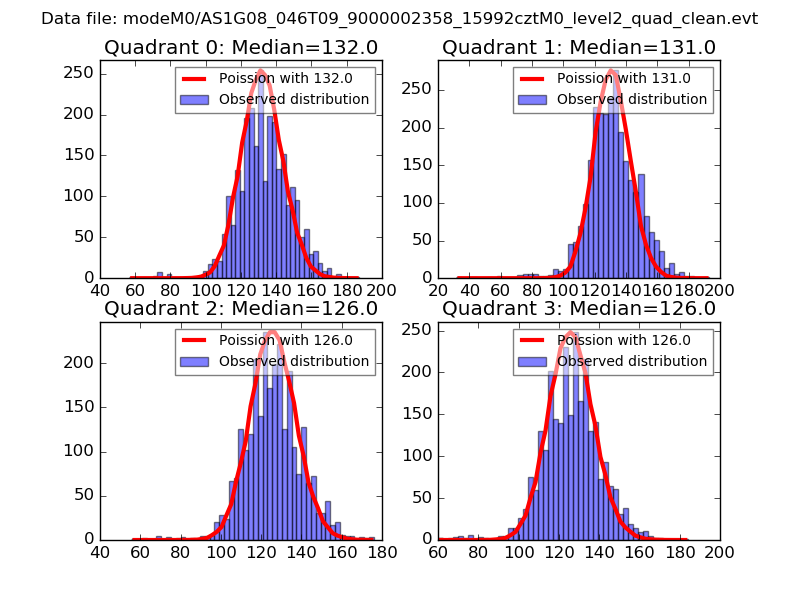 |
 |
| Quadrant-wise count rates Data is divided into 100 sec bins |
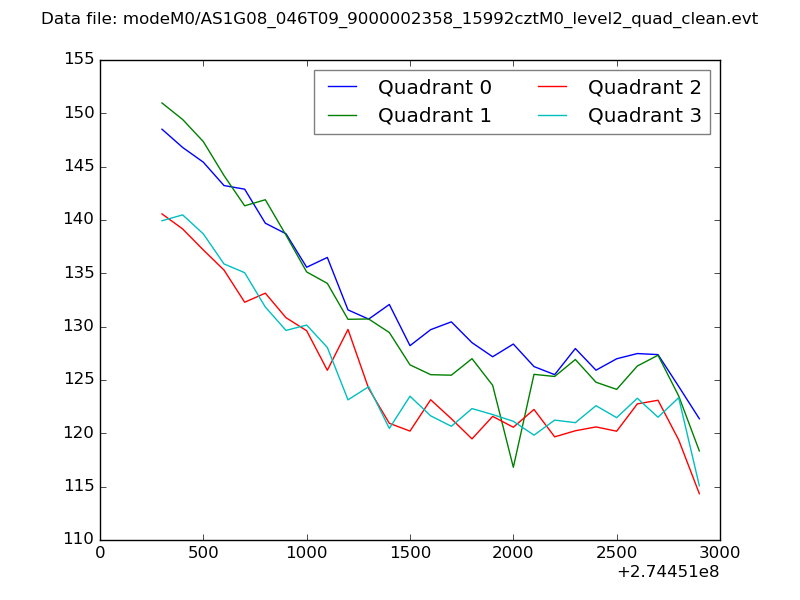 |
|
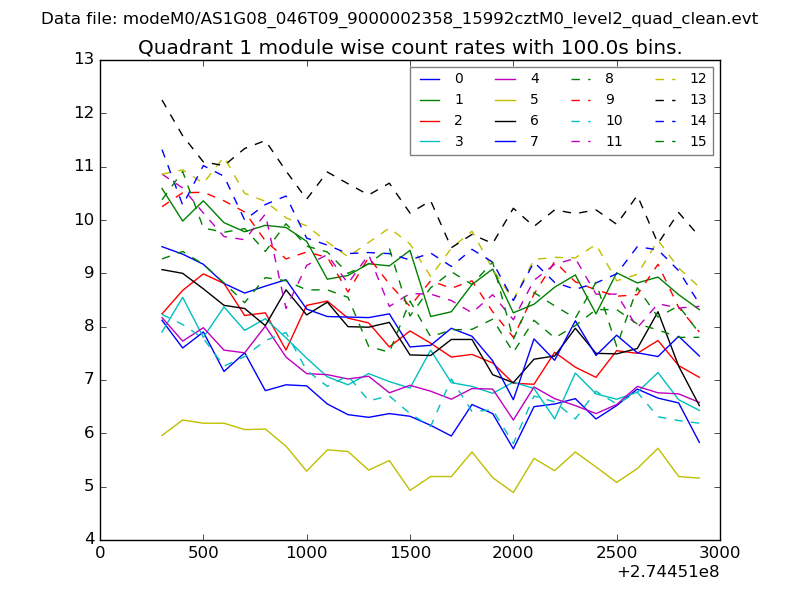
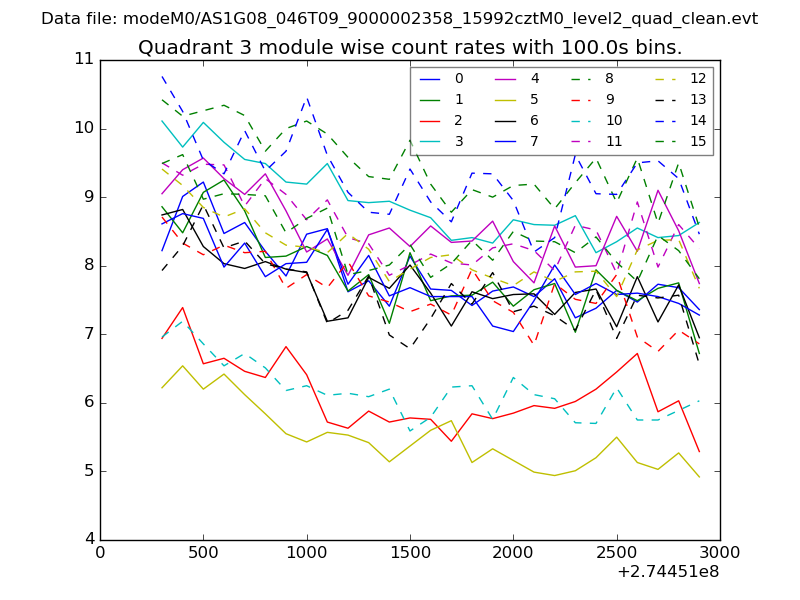
| Module-wise count rates for Quadrant A Data is divided into 100 sec bins |
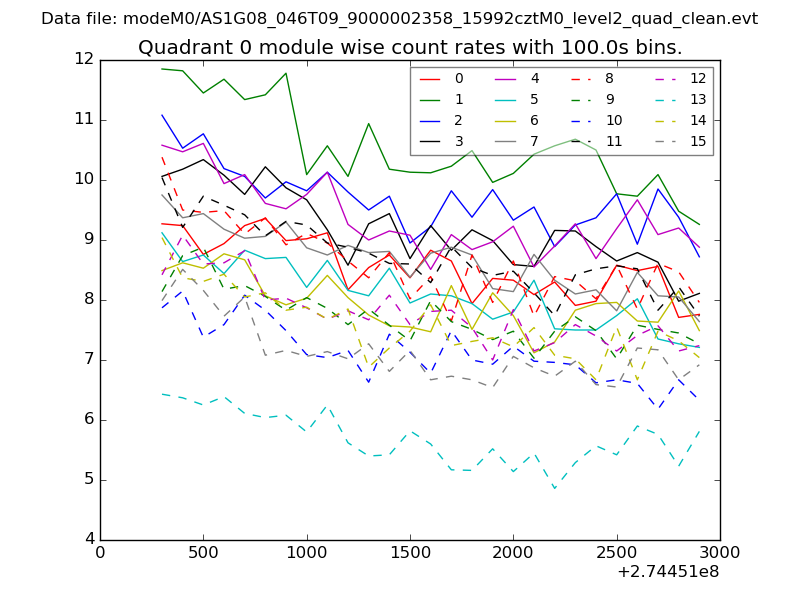 |
 |
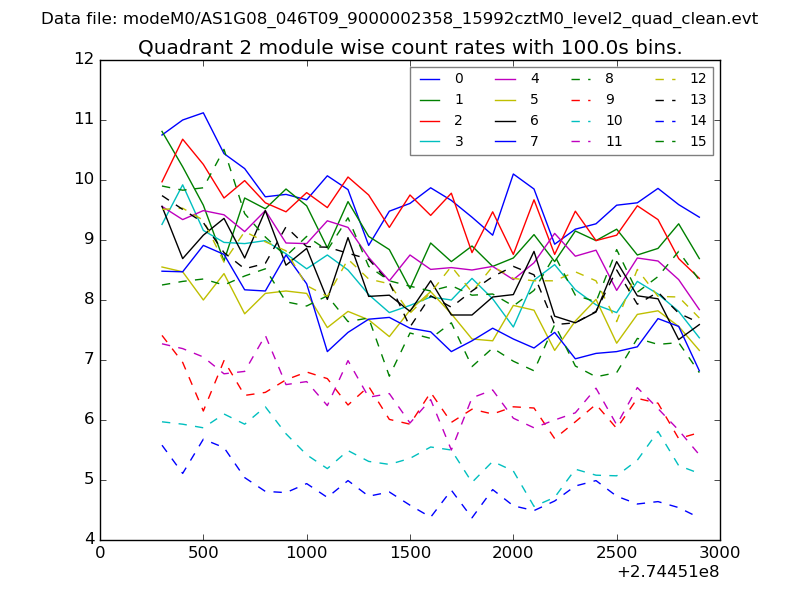
| Module-wise count rates for Quadrant B Data is divided into 100 sec bins |
 |
 |
| Module-wise count rates for Quadrant C Data is divided into 100 sec bins |
 |
 |
| Module-wise count rates for Quadrant D Data is divided into 100 sec bins |
 |
 |
| Parameter | Plot |
|---|---|
| CZT HV Monitor | 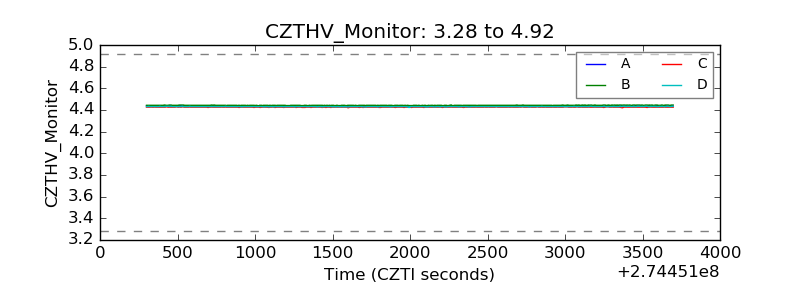 |
| D_VDD | 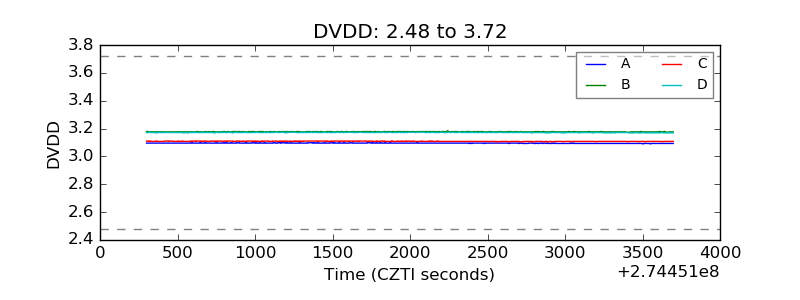 |
| Temperature 1 | 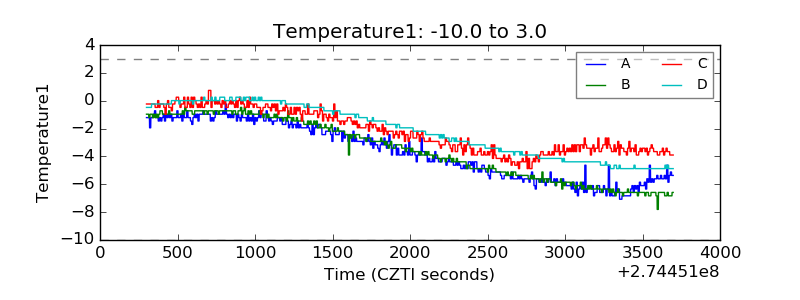 |
| Veto HV Monitor |  |
| Veto LLD | 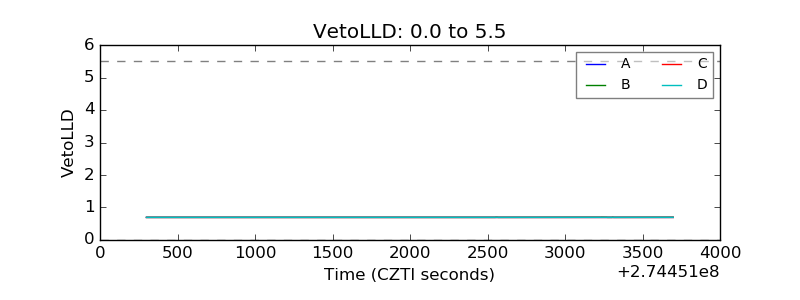 |
| Alpha Counter | 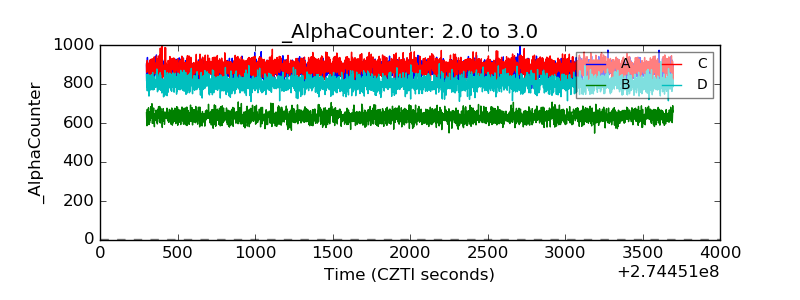 |
| _CPM_Rate | 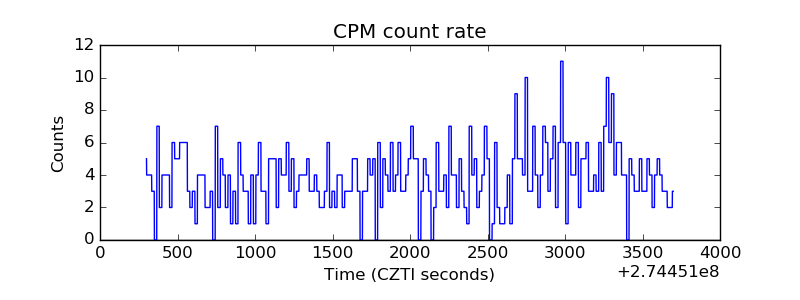 |
| CZT Counter | 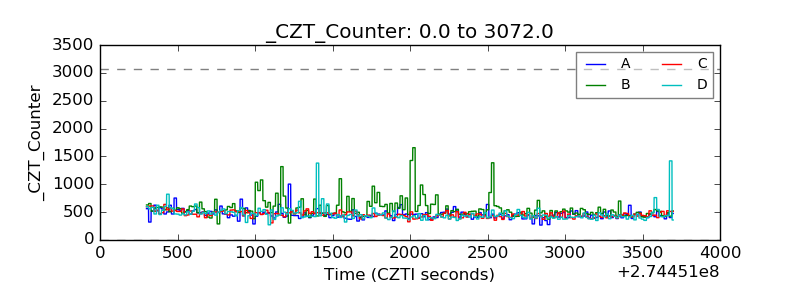 |
| +2.5 Volts monitor |  |
| +5 Volts monitor |  |
| _ROLL_ROT | 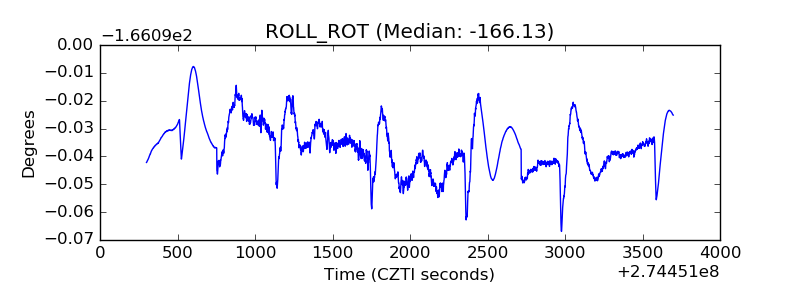 |
| _Roll_DEC |  |
| _Roll_RA | 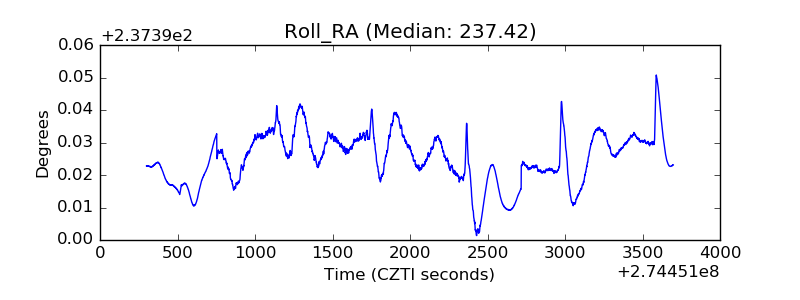 |
| Veto Counter | 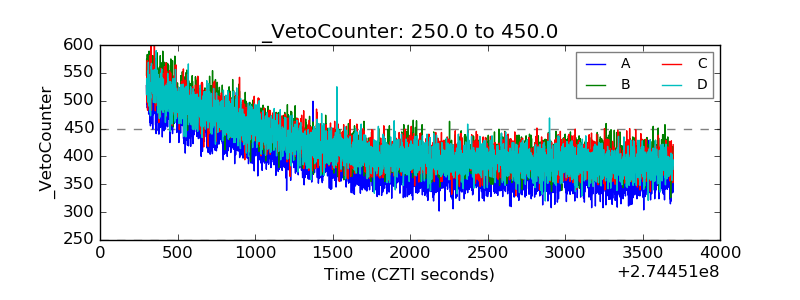 |