| Param | Original file | Final file |
|---|---|---|
| Filename | modeM0/AS1T02_090T01_9000002360cztM0_level2.fits | modeM0/AS1T02_090T01_9000002360cztM0_level2_quad_clean.evt |
| Size (bytes) | 924,387,840 | 917,527,680 |
| Size | 881.6 MB | 875.0 MB |
| Events in quadrant A | 5,685,612 | 5,587,301 |
| Events in quadrant B | 5,429,182 | 5,600,872 |
| Events in quadrant C | 5,633,310 | 5,370,394 |
| Events in quadrant D | 4,933,834 | 4,917,731 |
| Mode M0 | |||
|---|---|---|---|
| Quadrant | BADHDUFLAG | Total packets | Discarded packets |
| A | 0 | 206121 | 0 |
| B | 0 | 211979 | 0 |
| C | 0 | 201663 | 0 |
| D | 0 | 222567 | 0 |
| Mode SS | |||
|---|---|---|---|
| Quadrant | BADHDUFLAG | Total packets | Discarded packets |
| A | 0 | 1876 | 0 |
| B | 0 | 1876 | 0 |
| C | 0 | 1876 | 0 |
| D | 0 | 1876 | 0 |
| Mode M9 | |||
|---|---|---|---|
| Quadrant | BADHDUFLAG | Total packets | Discarded packets |
| A | 0 | 174 | 0 |
| B | 0 | 174 | 0 |
| C | 0 | 174 | 0 |
| D | 0 | 174 | 0 |
| Quadrant | Total seconds | Saturated seconds | Saturation percentage |
|---|---|---|---|
| A | 92086 | 1883 | 2.044828% |
| B | 92086 | 2266 | 2.460743% |
| C | 92086 | 1814 | 1.969898% |
| D | 92086 | 2589 | 2.811502% |
Noise dominated data is calculated using 1-second bins in cleaned event files. If a bin has >2000 counts, and if more than 50% of those come from <1% of pixels, then it is considered to be noise-dominated and hence unusable.
| Quadrant | # 1 sec bins | Bins with >0 counts | Bins with >2000 counts | High rate bins dominated by noise | Noise dominated (total time) | Noise dominated (detector-on time) | Marked lightcurve |
|---|---|---|---|---|---|---|---|
| A | 108355 | 92066 | 0 | 0 | 0.00% | 0.00% | 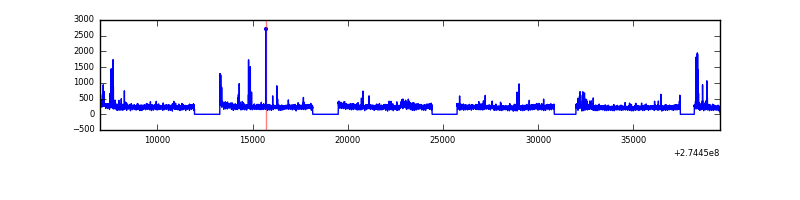 |
| B | 108355 | 92059 | 0 | 0 | 0.00% | 0.00% | 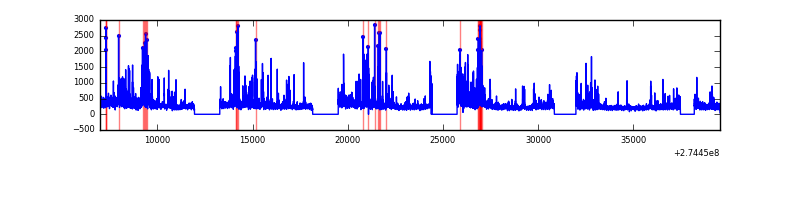 |
| C | 108355 | 92064 | 0 | 0 | 0.00% | 0.00% | 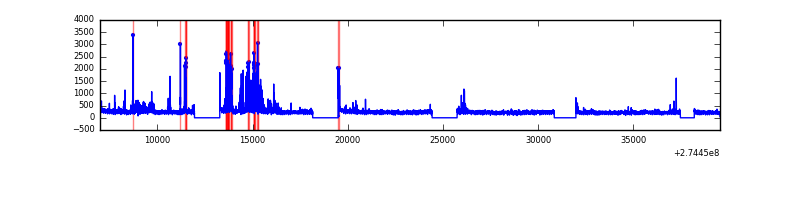 |
| D | 108355 | 92067 | 0 | 0 | 0.00% | 0.00% | 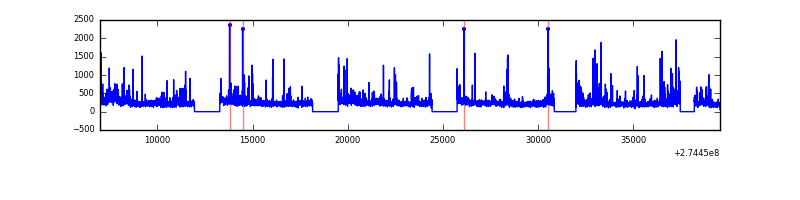 |
Top three noisy pixels from each quadrant. If the there are fewer than three noisy pixels in the level2.evt file, extra rows are filled as -1
| Pixel properties | Quadrant properties | ||||||
|---|---|---|---|---|---|---|---|
| Quadrant | DetID | PixID | Counts | Sigma | Mean | Median | Sigma |
| A | 0 | 29 | 5628 | 11.69 | 1482 | 1394 | 362.2 |
| A | 7 | 110 | 4497 | 8.57 | 1482 | 1394 | 362.2 |
| A | 0 | 30 | 4287 | 7.99 | 1482 | 1394 | 362.2 |
| B | 2 | 9 | 4394 | 10.76 | 1440 | 1379 | 280.1 |
| B | 2 | 8 | 3760 | 8.5 | 1440 | 1379 | 280.1 |
| B | 12 | 226 | 3661 | 8.15 | 1440 | 1379 | 280.1 |
| C | 12 | 250 | 4014 | 6.91 | 1488 | 1395 | 378.9 |
| C | 12 | 241 | 3965 | 6.78 | 1488 | 1395 | 378.9 |
| C | 2 | 191 | 3851 | 6.48 | 1488 | 1395 | 378.9 |
| D | 6 | 231 | 3549 | 6.06 | 1408 | 1284 | 373.7 |
| D | 3 | 14 | 3496 | 5.92 | 1408 | 1284 | 373.7 |
| D | 10 | 189 | 3479 | 5.87 | 1408 | 1284 | 373.7 |
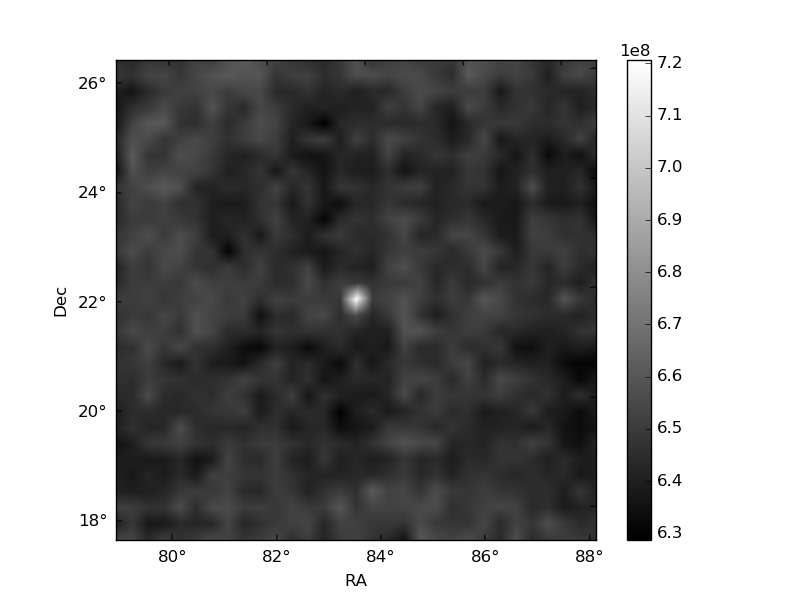
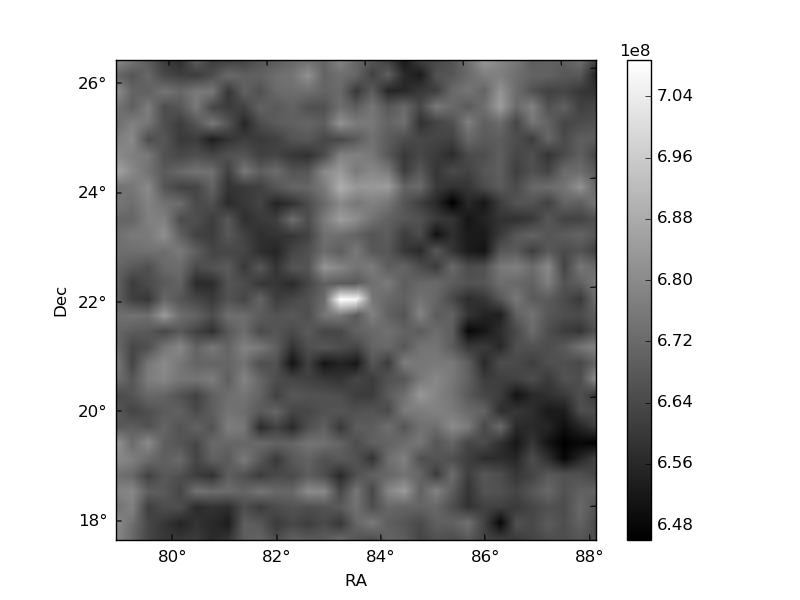
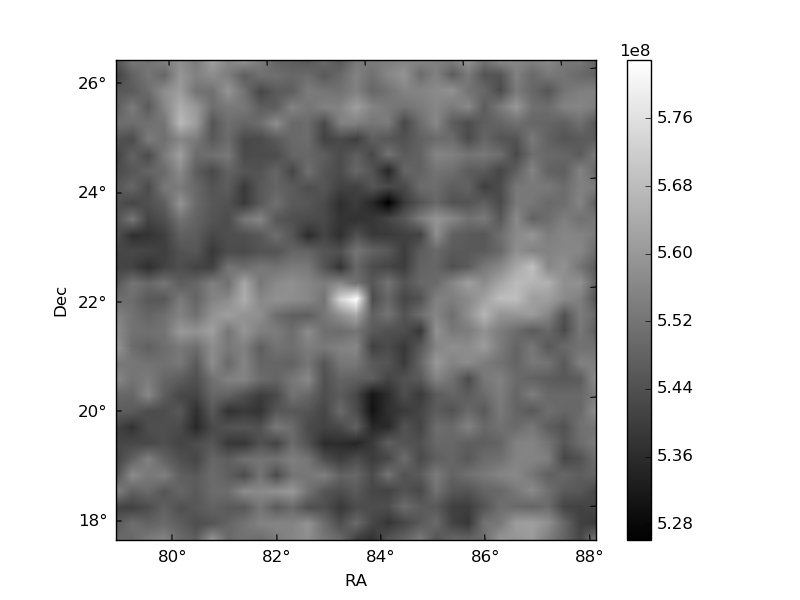
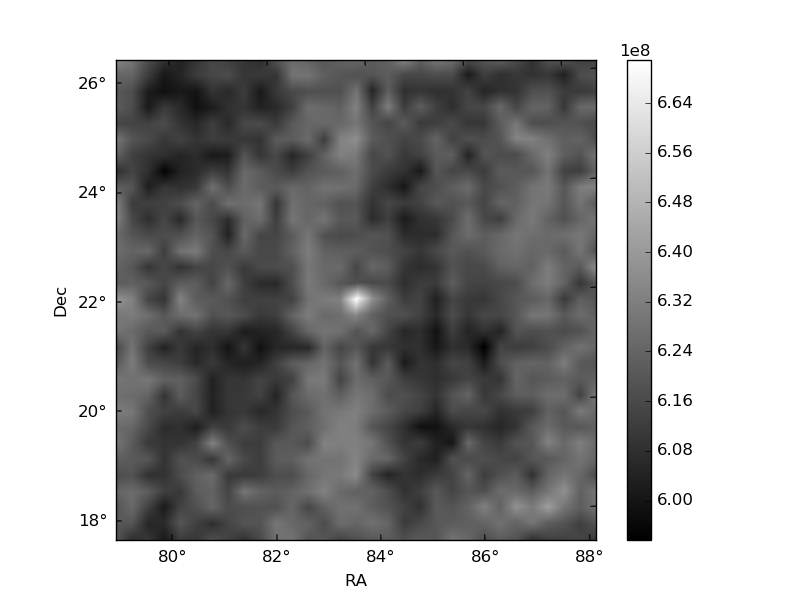
Histogram calculated using DETX and DETY for each event in the final _common_clean file
| Quadrant A | 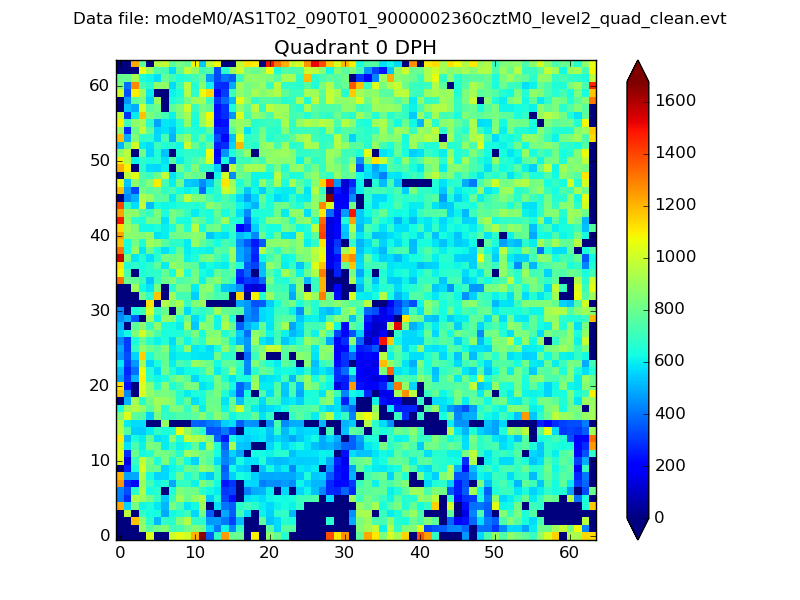 |
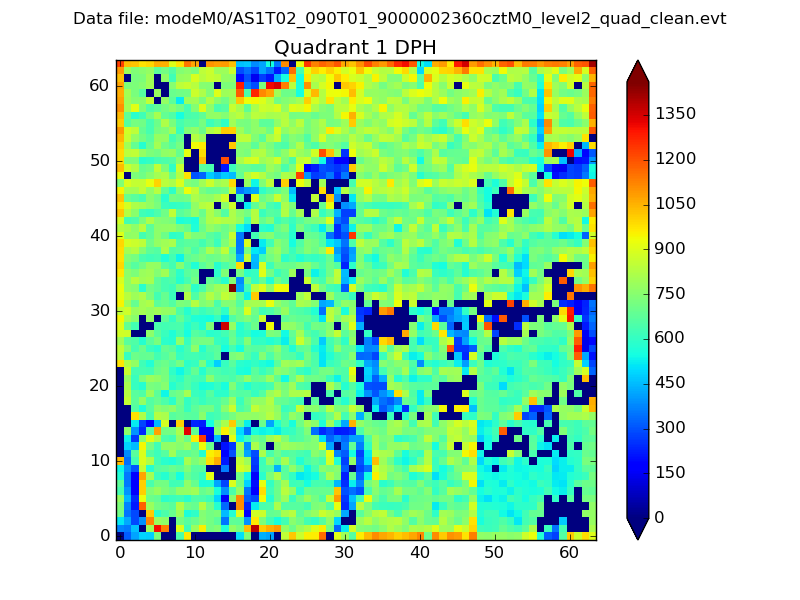 |
Quadrant B |
|---|---|---|---|
| Quadrant D | 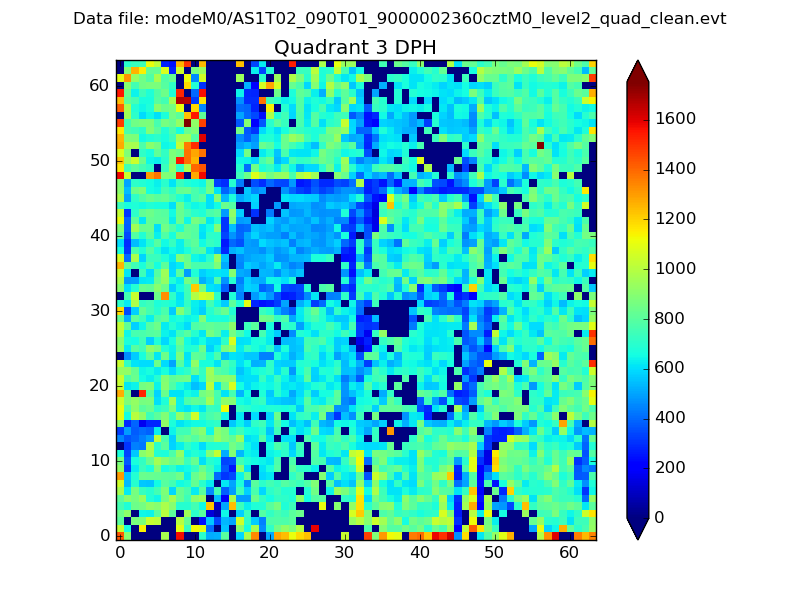 |
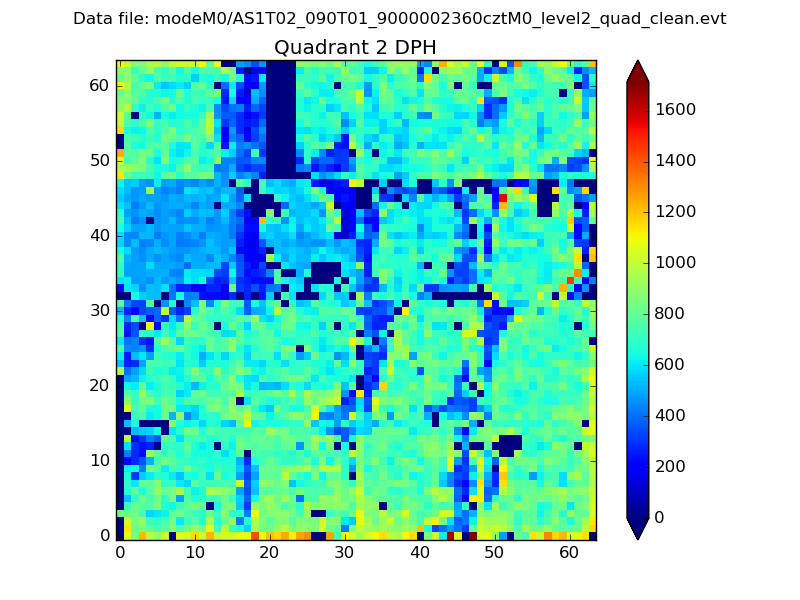 |
Quadrant C |
| Plot type | Count rate plots | Images |
|---|---|---|
| Comparison with Poisson distribution Blue bars denote a histogram of data divided into 1 sec bins. Red curve is a Poisson curve with rate = median count rate of data. |
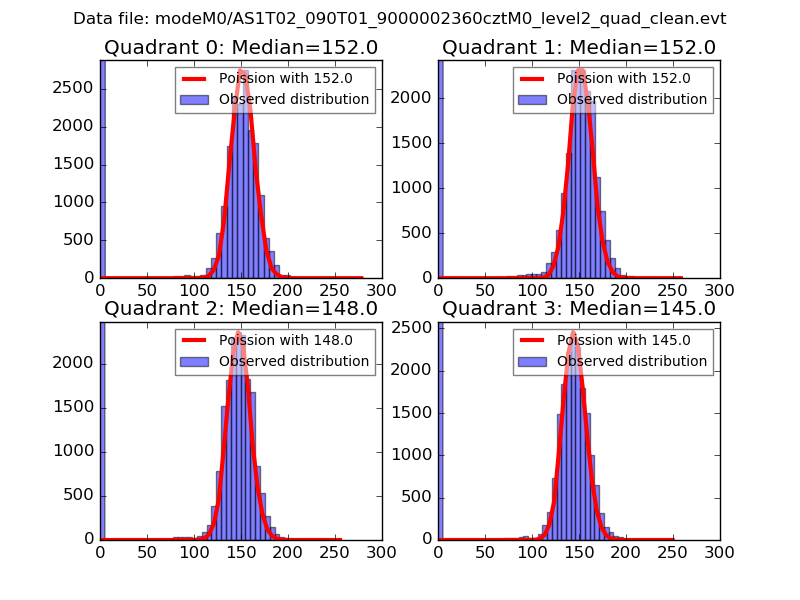 |
 |
| Quadrant-wise count rates Data is divided into 100 sec bins |
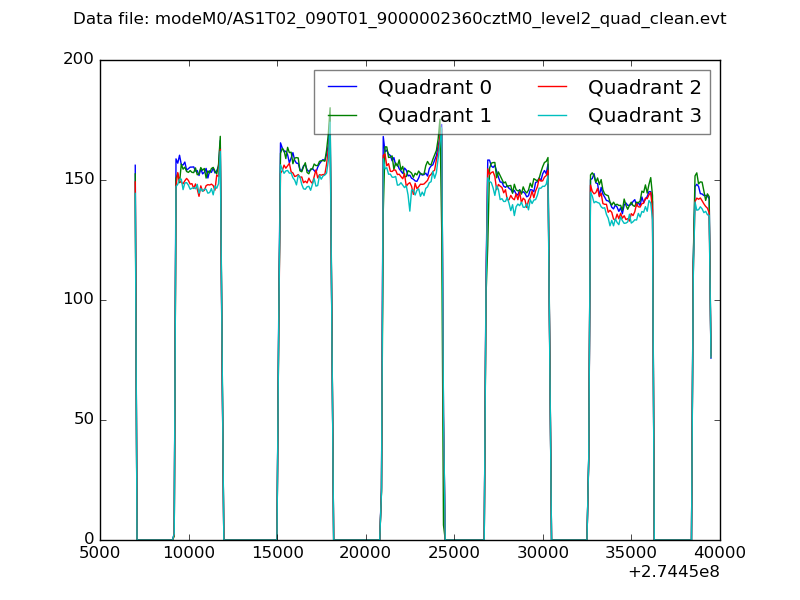 |
|
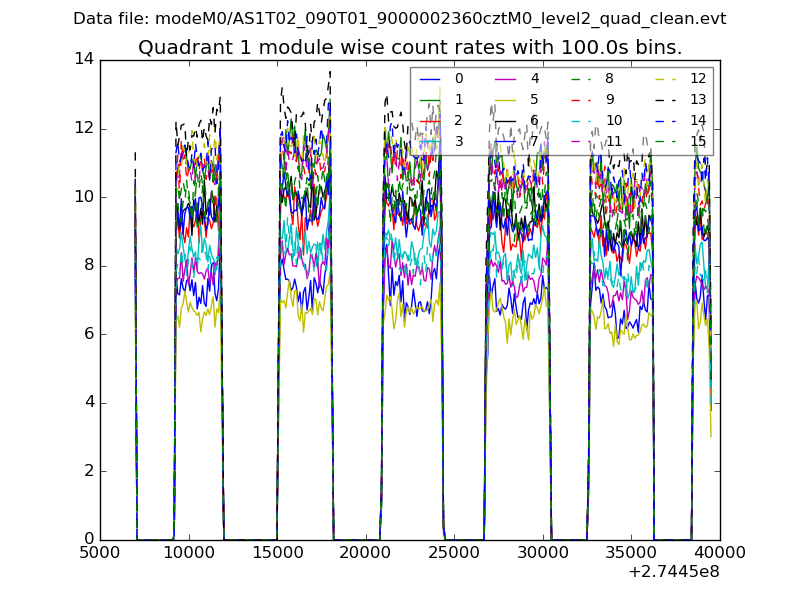
| Module-wise count rates for Quadrant A Data is divided into 100 sec bins |
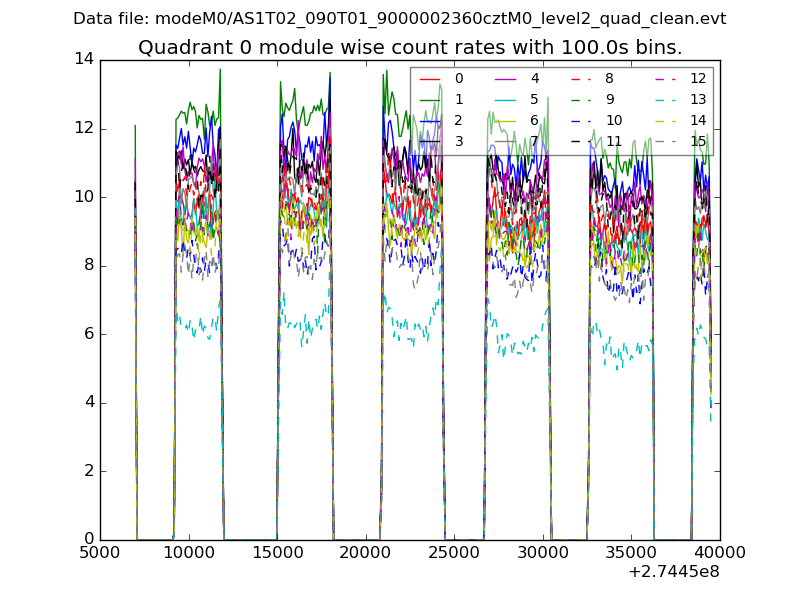 |
 |
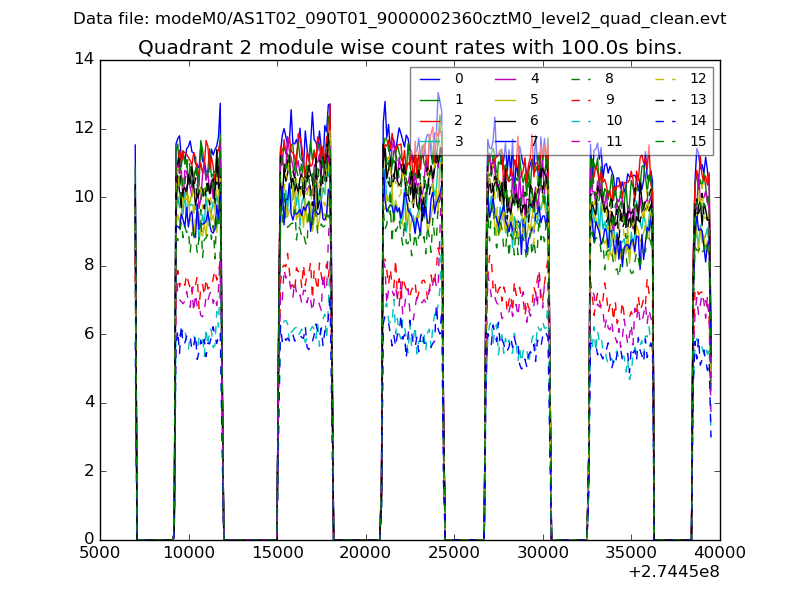
| Module-wise count rates for Quadrant B Data is divided into 100 sec bins |
 |
 |
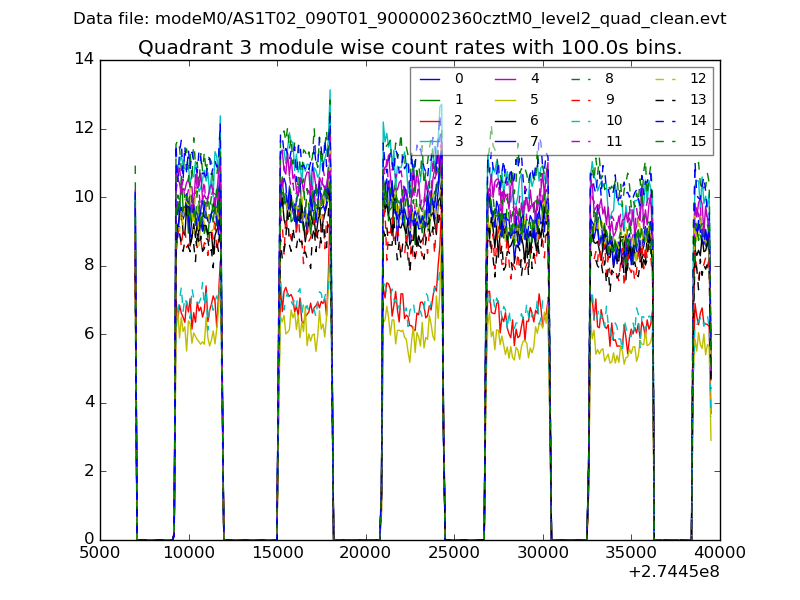
| Module-wise count rates for Quadrant C Data is divided into 100 sec bins |
 |
 |
| Module-wise count rates for Quadrant D Data is divided into 100 sec bins |
 |
 |
| Parameter | Plot |
|---|---|
| CZT HV Monitor | 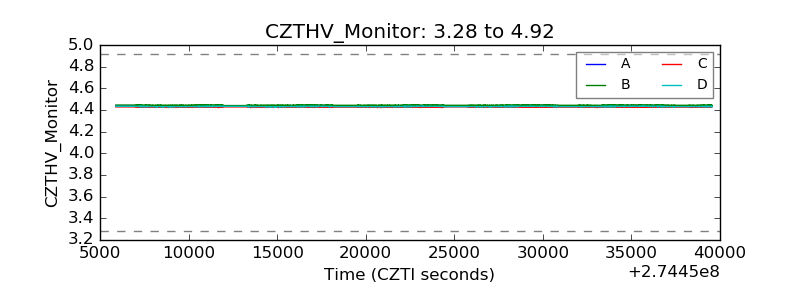 |
| D_VDD | 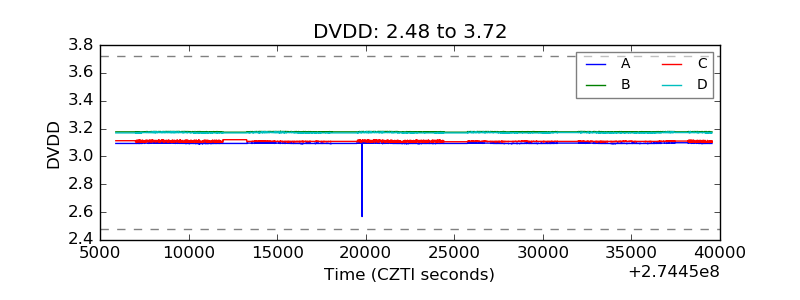 |
| Temperature 1 | 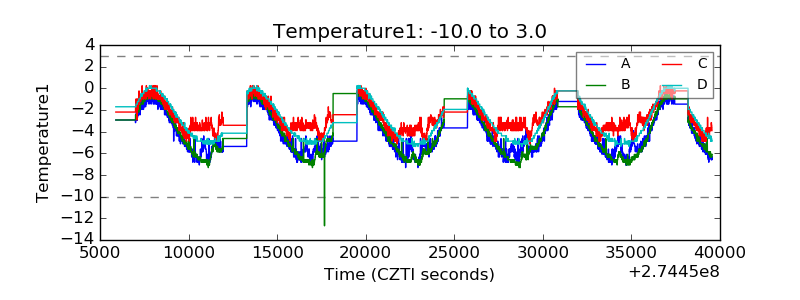 |
| Veto HV Monitor | 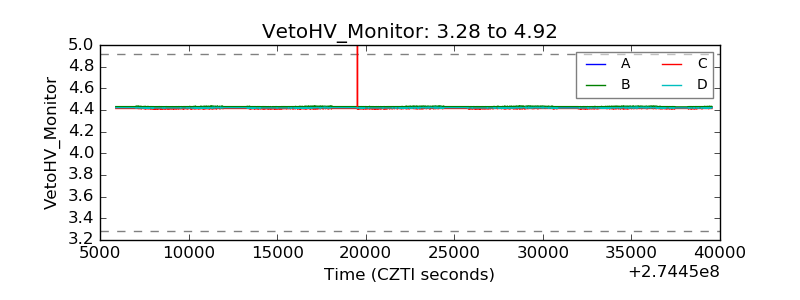 |
| Veto LLD | 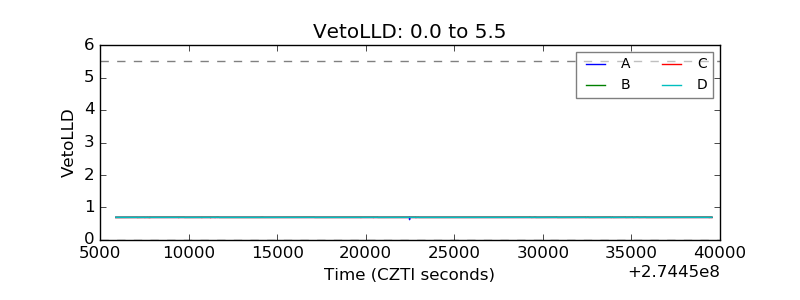 |
| Alpha Counter | 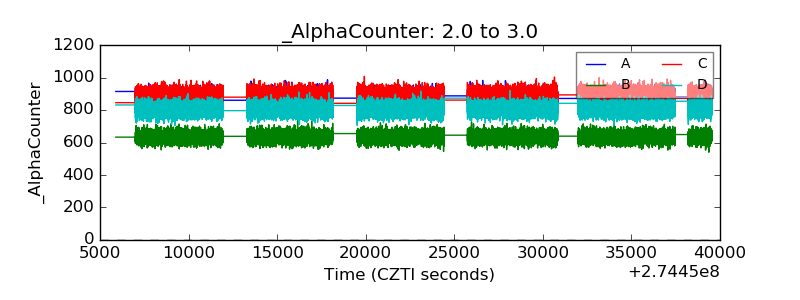 |
| _CPM_Rate | 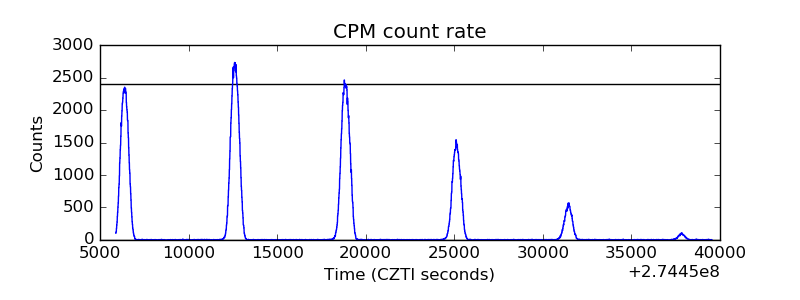 |
| CZT Counter | 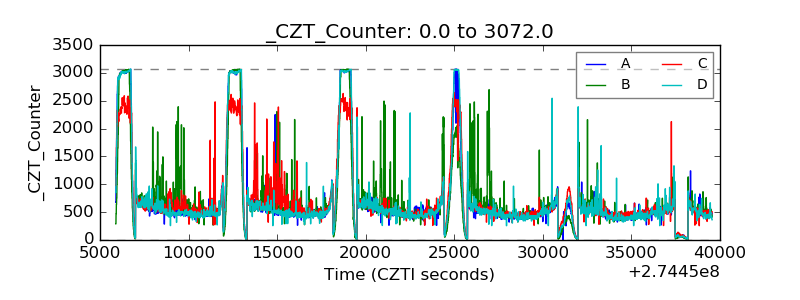 |
| +2.5 Volts monitor | 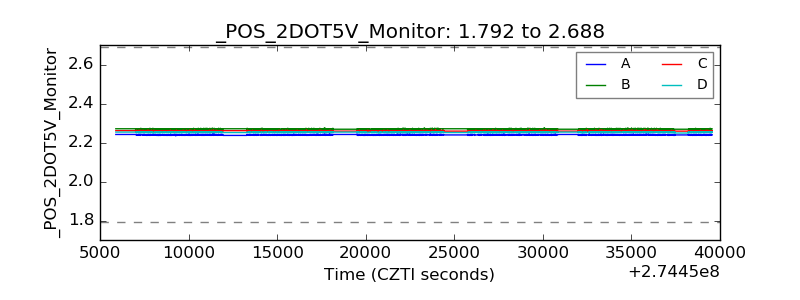 |
| +5 Volts monitor | 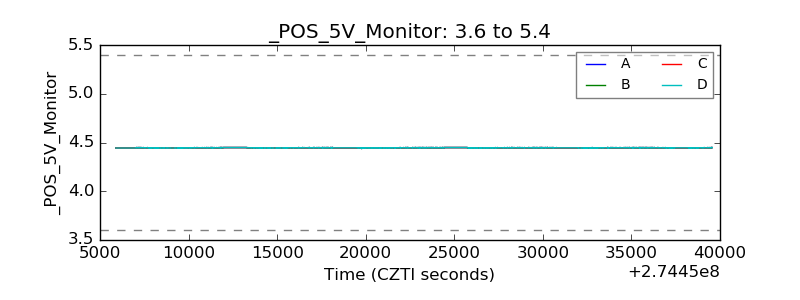 |
| _ROLL_ROT | 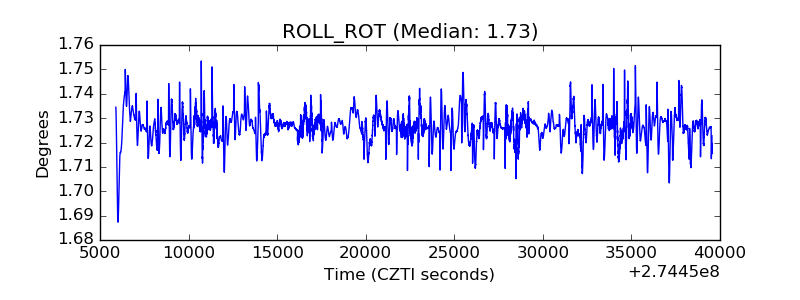 |
| _Roll_DEC | 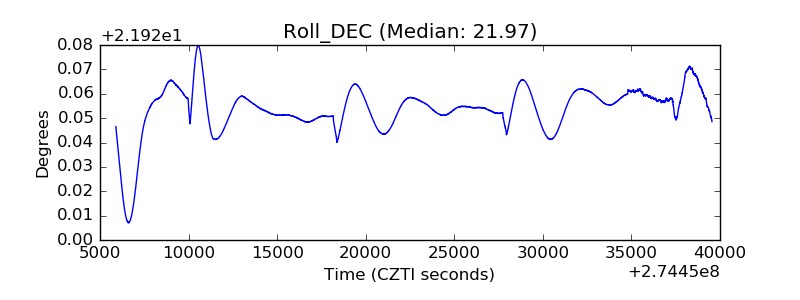 |
| _Roll_RA | 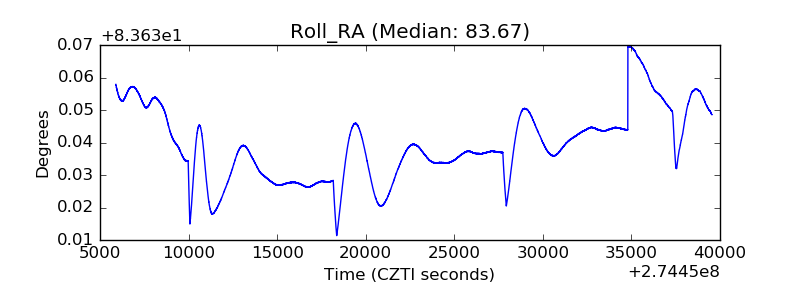 |
| Veto Counter | 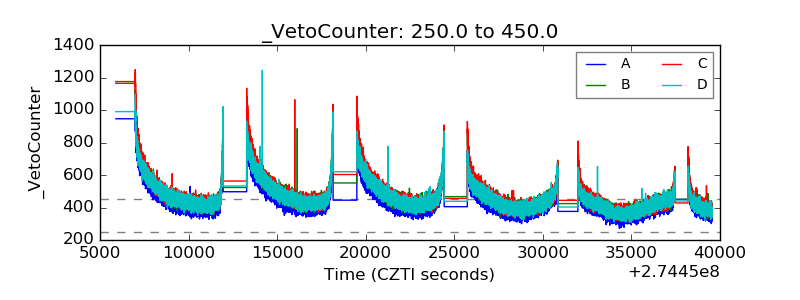 |