| Param | Original file | Final file |
|---|---|---|
| Filename | modeM0/AS1T02_090T01_9000002360_15993cztM0_level2.evt | modeM0/AS1T02_090T01_9000002360_15993cztM0_level2_quad_clean.evt |
| Size (bytes) | 521,288,640 | 69,635,520 |
| Size | 497.1 MB | 66.4 MB |
| Events in quadrant A | 3,482,952 | 427,124 |
| Events in quadrant B | 4,315,275 | 424,345 |
| Events in quadrant C | 3,987,070 | 409,800 |
| Events in quadrant D | 3,574,085 | 406,584 |
| Mode M0 | |||
|---|---|---|---|
| Quadrant | BADHDUFLAG | Total packets | Discarded packets |
| A | 0 | 14313 | 3 |
| B | 0 | 17179 | 2 |
| C | 0 | 15985 | 2 |
| D | 0 | 14873 | 2 |
| Mode SS | |||
|---|---|---|---|
| Quadrant | BADHDUFLAG | Total packets | Discarded packets |
| A | 0 | 130 | 0 |
| B | 0 | 130 | 0 |
| C | 0 | 130 | 0 |
| D | 0 | 130 | 0 |
| Mode M9 | |||
|---|---|---|---|
| Quadrant | BADHDUFLAG | Total packets | Discarded packets |
| A | 0 | 16 | 0 |
| B | 0 | 16 | 0 |
| C | 0 | 16 | 0 |
| D | 0 | 17 | 0 |
| Quadrant | Total seconds | Saturated seconds | Saturation percentage |
|---|---|---|---|
| A | 6306 | 99 | 1.569933% |
| B | 6306 | 206 | 3.266730% |
| C | 6306 | 201 | 3.187441% |
| D | 6306 | 94 | 1.490644% |
Noise dominated data is calculated using 1-second bins in cleaned event files. If a bin has >2000 counts, and if more than 50% of those come from <1% of pixels, then it is considered to be noise-dominated and hence unusable.
| Quadrant | # 1 sec bins | Bins with >0 counts | Bins with >2000 counts | High rate bins dominated by noise | Noise dominated (total time) | Noise dominated (detector-on time) | Marked lightcurve |
|---|---|---|---|---|---|---|---|
| A | 7637 | 6307 | 2 | 2 | 0.03% | 0.03% | 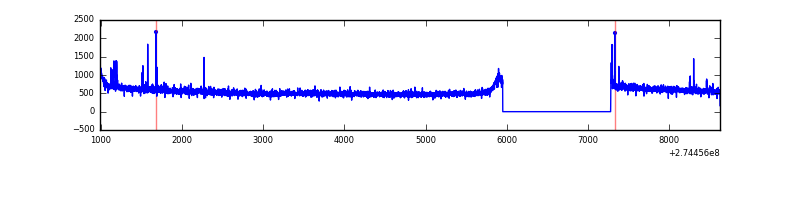 |
| B | 7637 | 6307 | 75 | 75 | 0.98% | 1.19% | 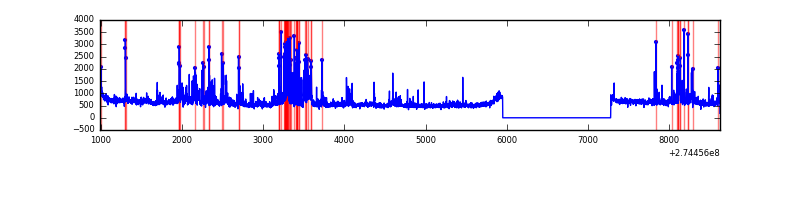 |
| C | 7637 | 6307 | 47 | 47 | 0.62% | 0.75% | 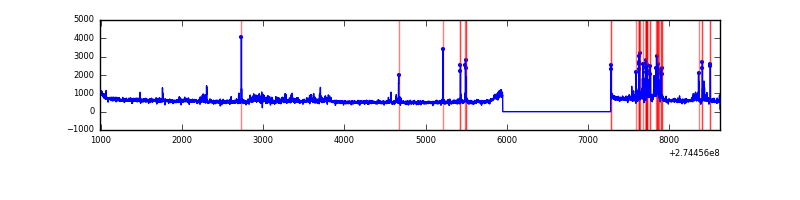 |
| D | 7637 | 6307 | 6 | 6 | 0.08% | 0.10% | 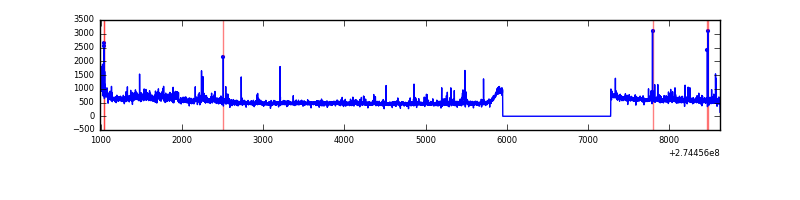 |
Top three noisy pixels from each quadrant. If the there are fewer than three noisy pixels in the level2.evt file, extra rows are filled as -1
| Pixel properties | Quadrant properties | ||||||
|---|---|---|---|---|---|---|---|
| Quadrant | DetID | PixID | Counts | Sigma | Mean | Median | Sigma |
| A | 15 | 157 | 13038 | 67.68 | 893 | 879 | 179.7 |
| A | 15 | 239 | 12497 | 64.67 | 893 | 879 | 179.7 |
| A | 9 | 143 | 9480 | 47.88 | 893 | 879 | 179.7 |
| B | 10 | 245 | 266077 | 1624.41 | 882 | 865 | 163.3 |
| B | 7 | 220 | 245312 | 1497.23 | 882 | 865 | 163.3 |
| B | 4 | 142 | 145099 | 883.43 | 882 | 865 | 163.3 |
| C | 9 | 236 | 270254 | 1384.38 | 851 | 862 | 194.6 |
| C | 0 | 207 | 181688 | 929.25 | 851 | 862 | 194.6 |
| C | 14 | 238 | 133120 | 679.66 | 851 | 862 | 194.6 |
| D | 2 | 152 | 79360 | 366.88 | 875 | 852 | 214.0 |
| D | 12 | 110 | 74246 | 342.99 | 875 | 852 | 214.0 |
| D | 2 | 234 | 29236 | 132.64 | 875 | 852 | 214.0 |
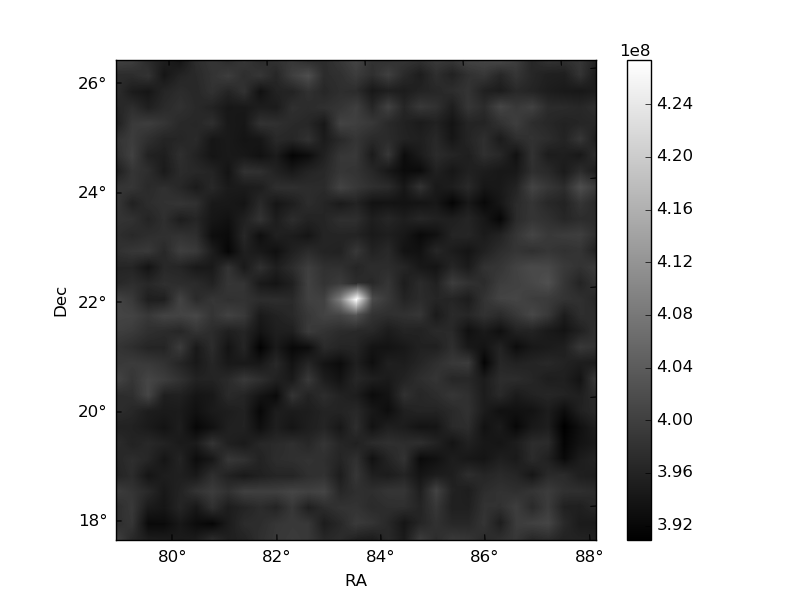
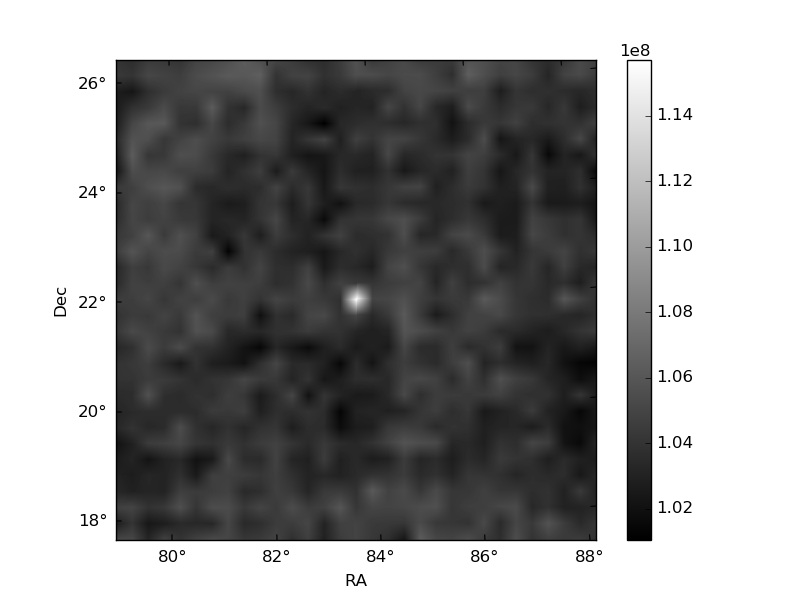
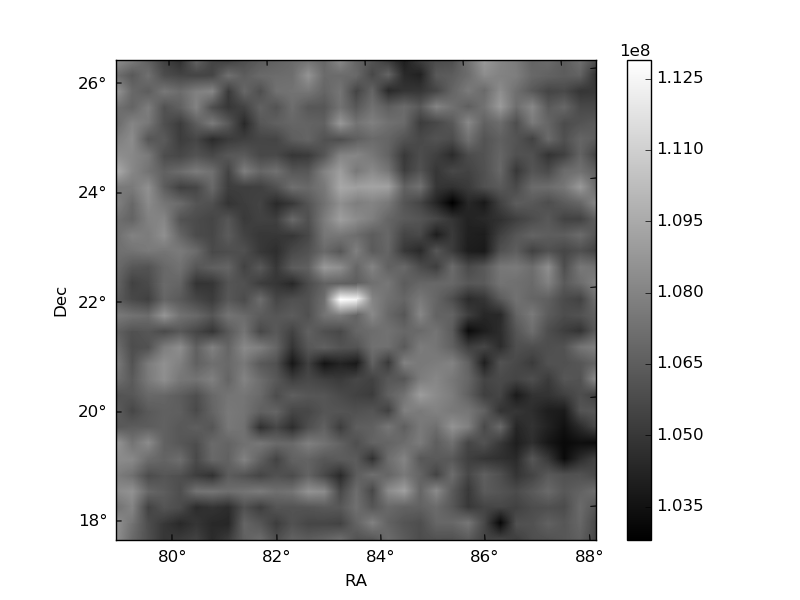
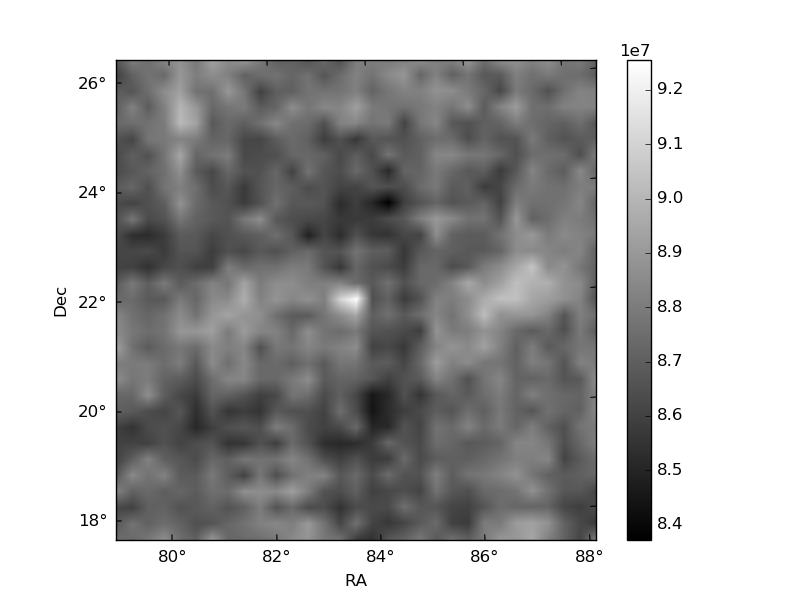
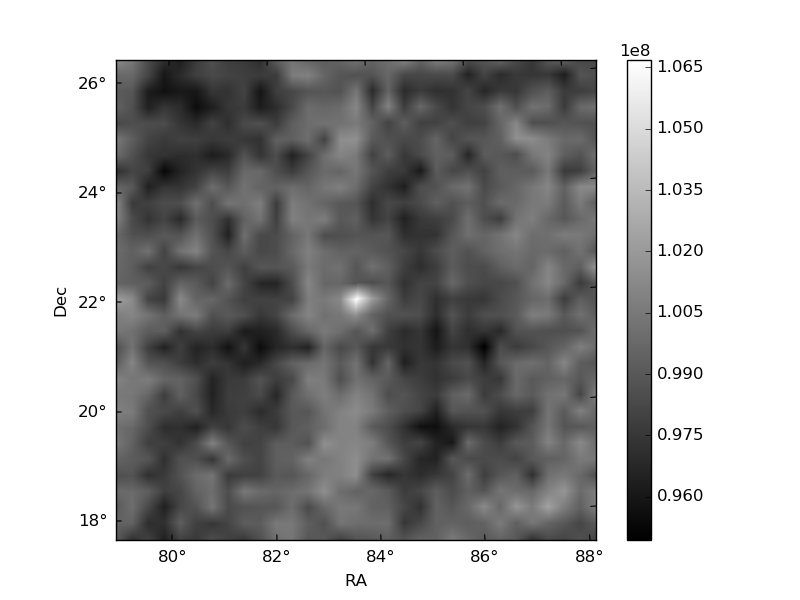
Histogram calculated using DETX and DETY for each event in the final _common_clean file
| Quadrant A | 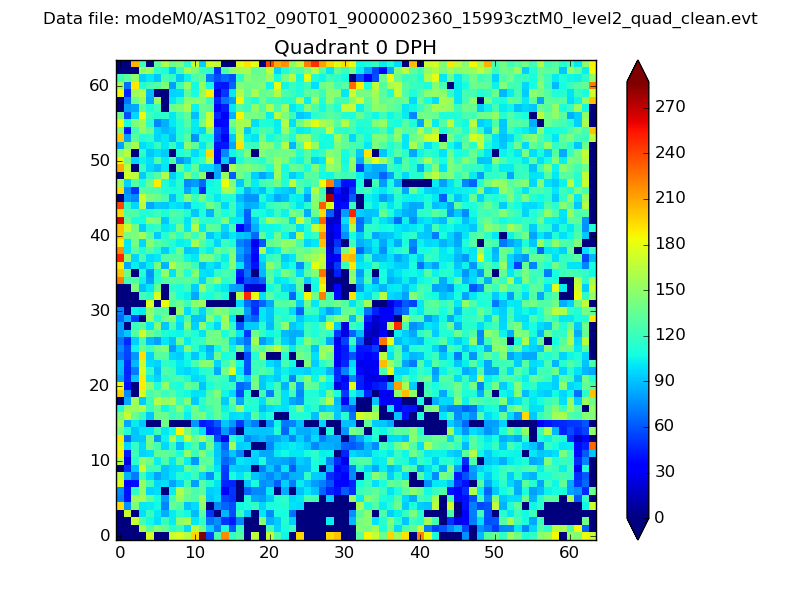 |
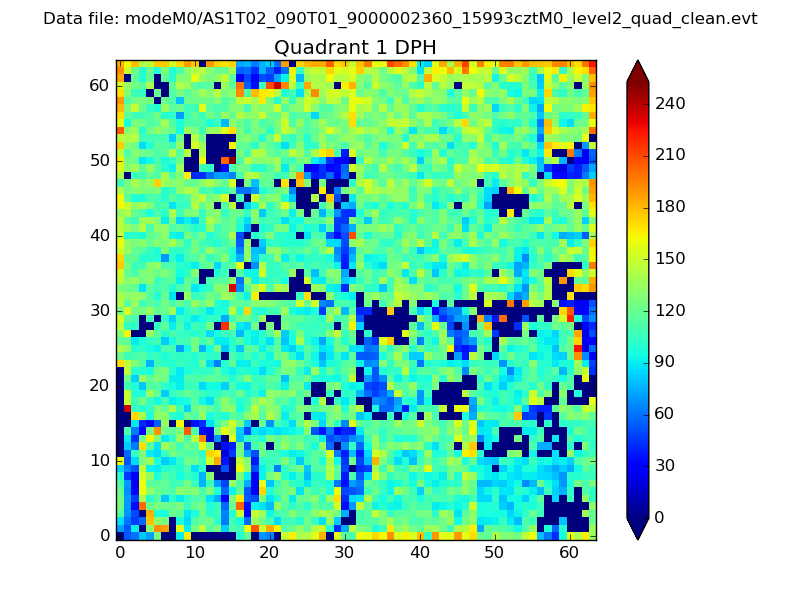 |
Quadrant B |
|---|---|---|---|
| Quadrant D | 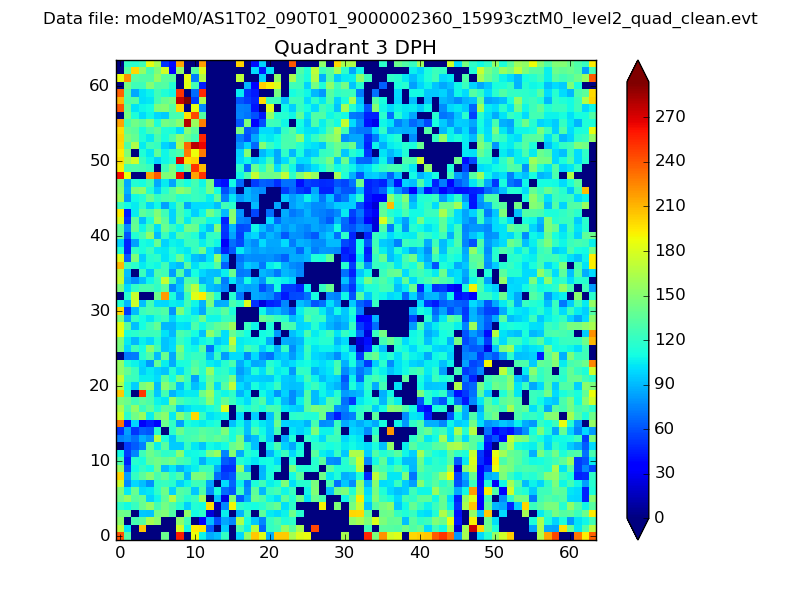 |
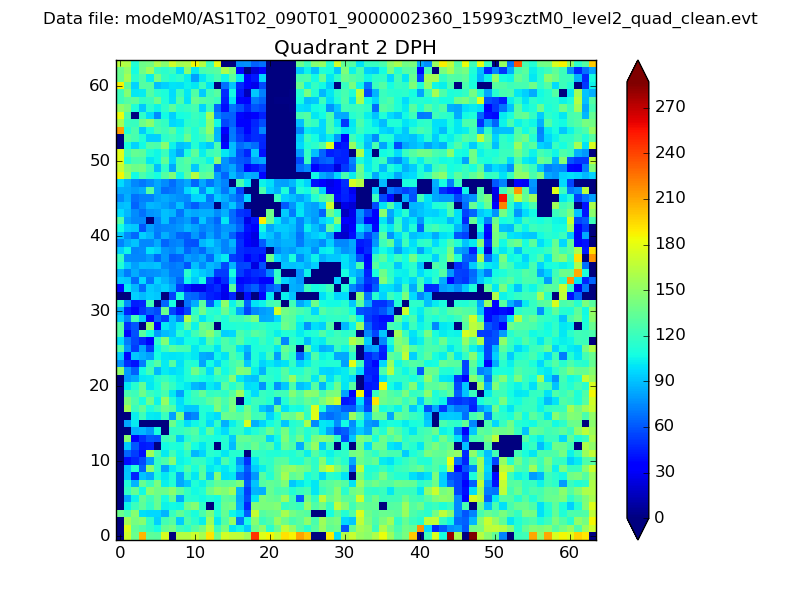 |
Quadrant C |
| Plot type | Count rate plots | Images |
|---|---|---|
| Comparison with Poisson distribution Blue bars denote a histogram of data divided into 1 sec bins. Red curve is a Poisson curve with rate = median count rate of data. |
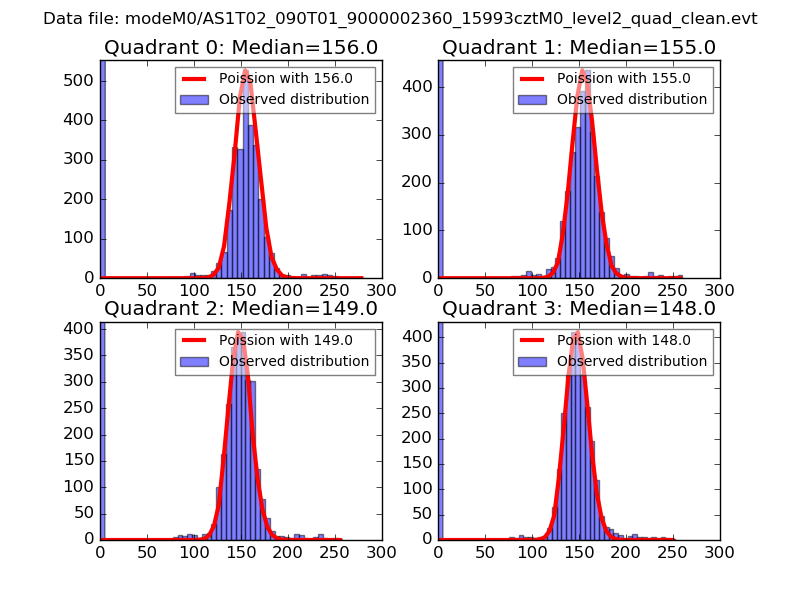 |
 |
| Quadrant-wise count rates Data is divided into 100 sec bins |
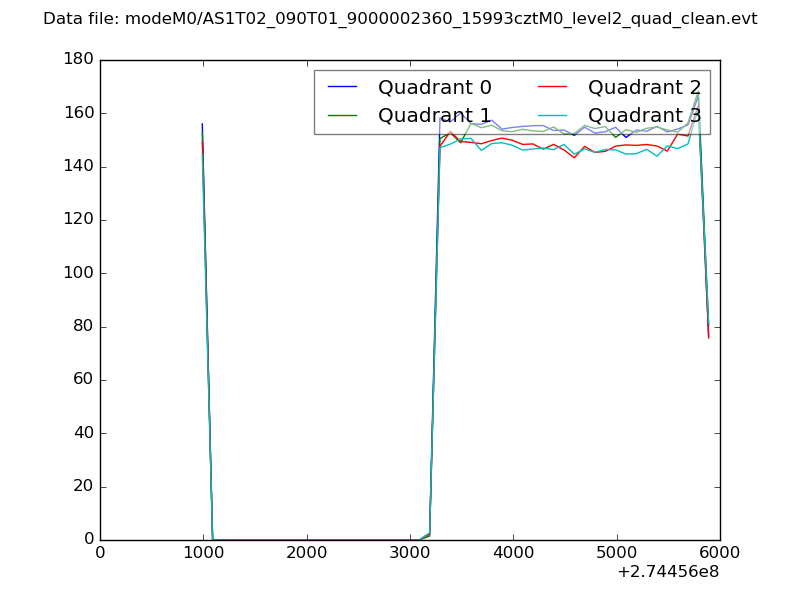 |
|
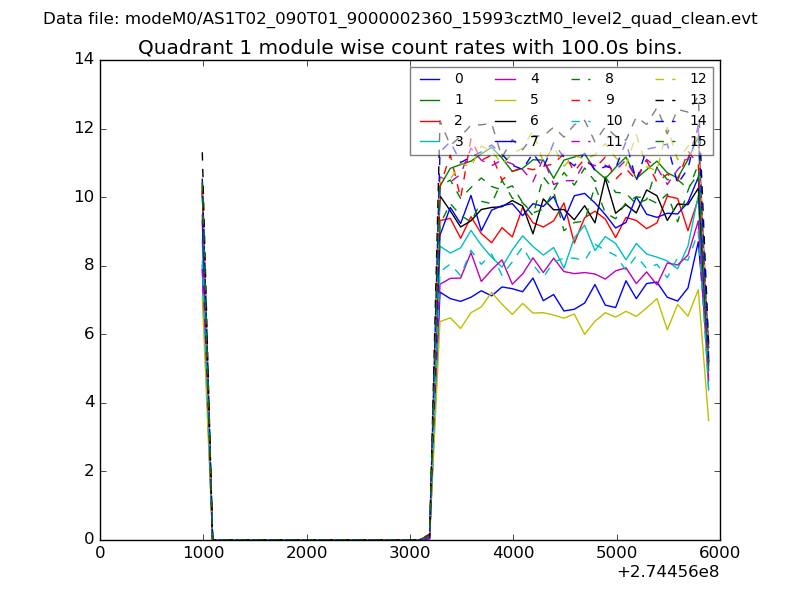
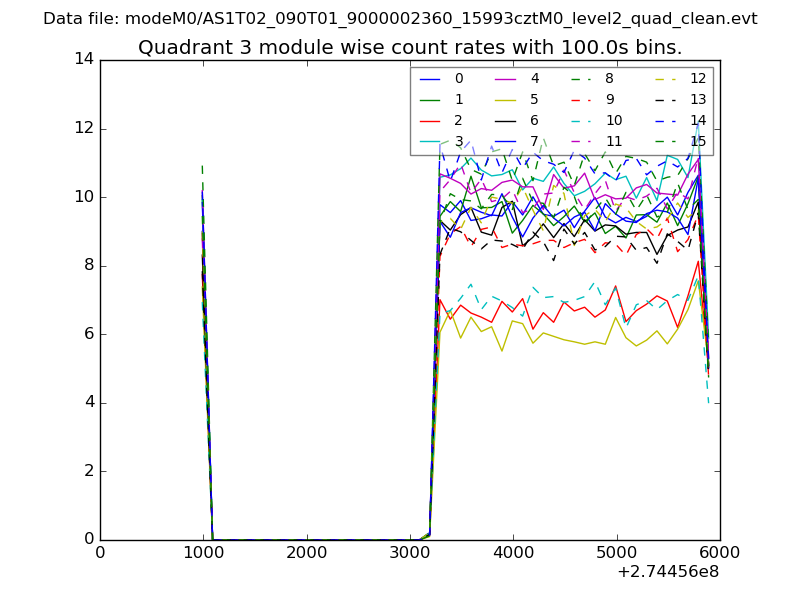
| Module-wise count rates for Quadrant A Data is divided into 100 sec bins |
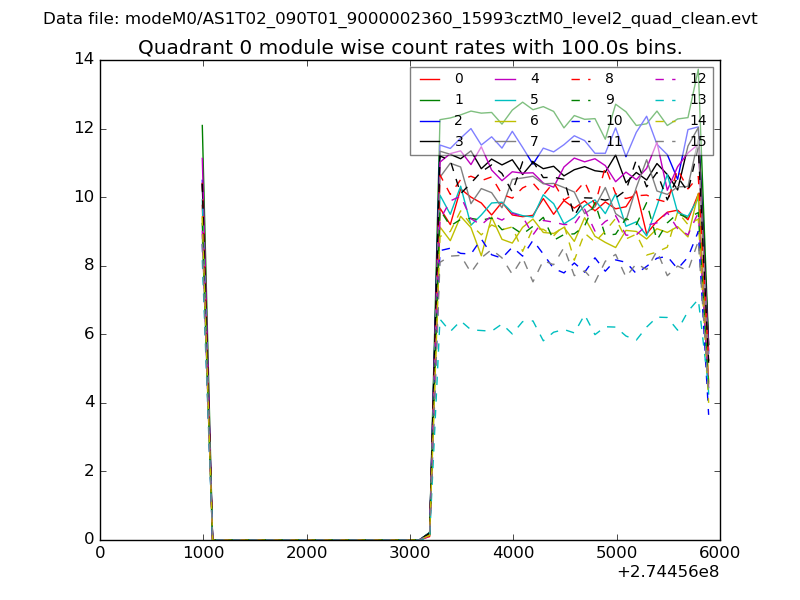 |
 |
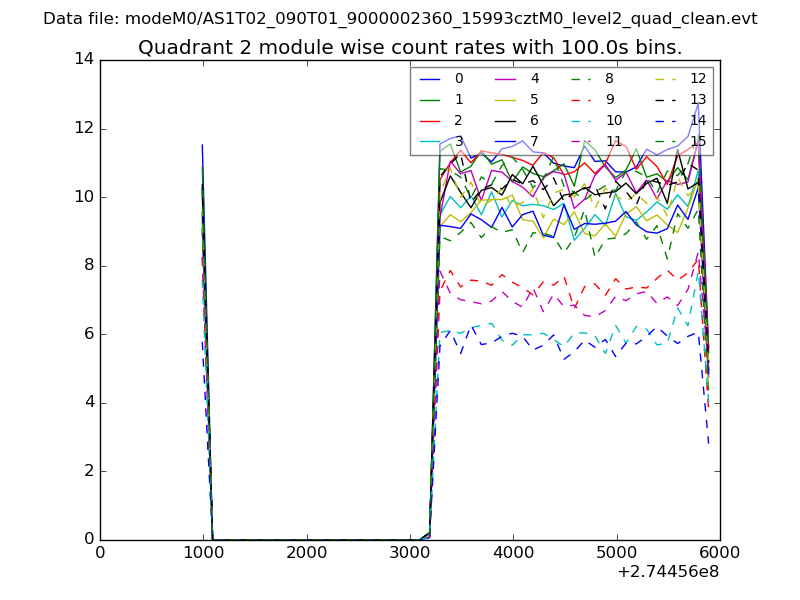
| Module-wise count rates for Quadrant B Data is divided into 100 sec bins |
 |
 |
| Module-wise count rates for Quadrant C Data is divided into 100 sec bins |
 |
 |
| Module-wise count rates for Quadrant D Data is divided into 100 sec bins |
 |
 |
| Parameter | Plot |
|---|---|
| CZT HV Monitor | 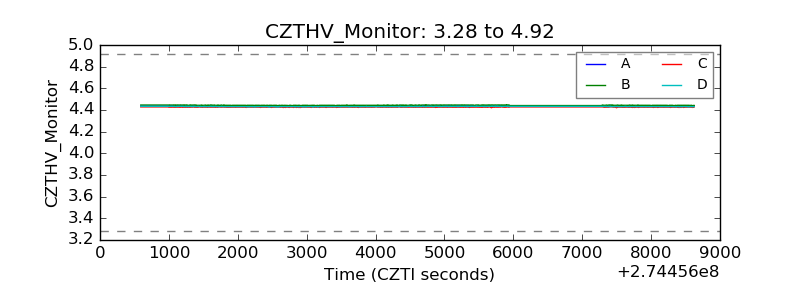 |
| D_VDD | 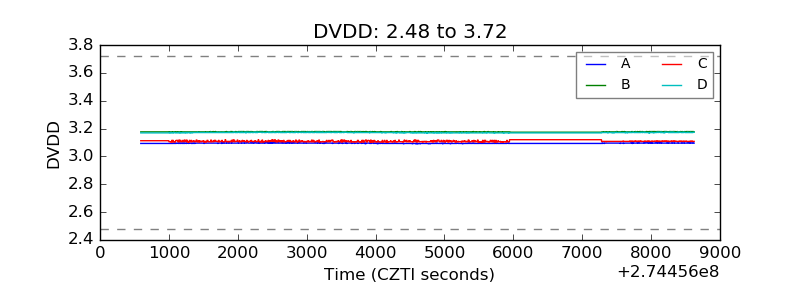 |
| Temperature 1 | 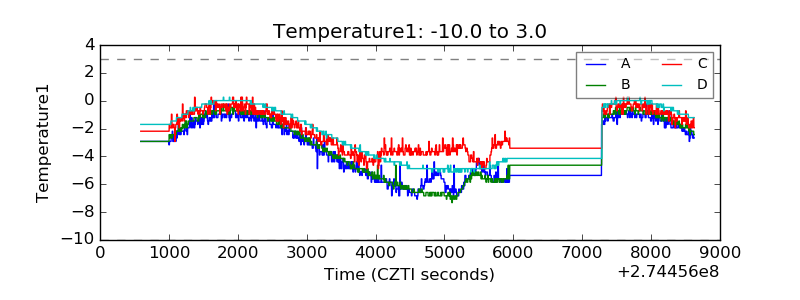 |
| Veto HV Monitor | 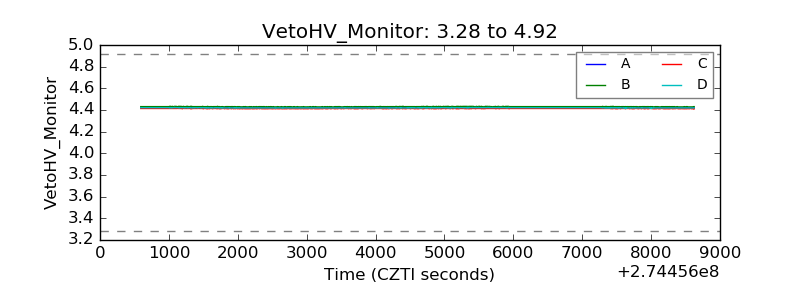 |
| Veto LLD | 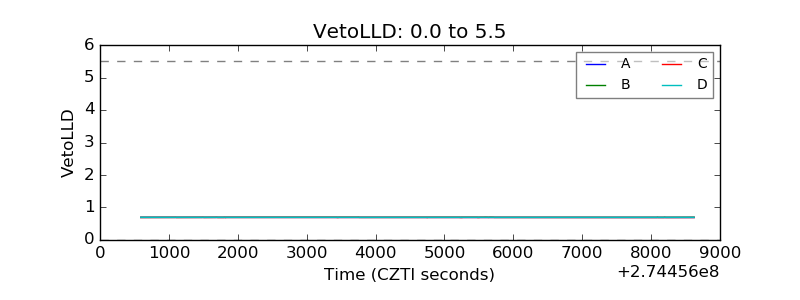 |
| Alpha Counter | 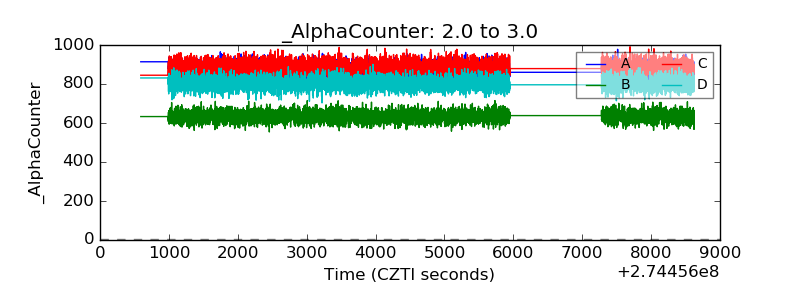 |
| _CPM_Rate | 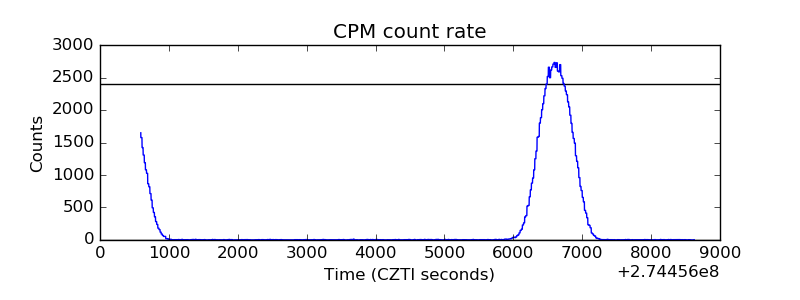 |
| CZT Counter | 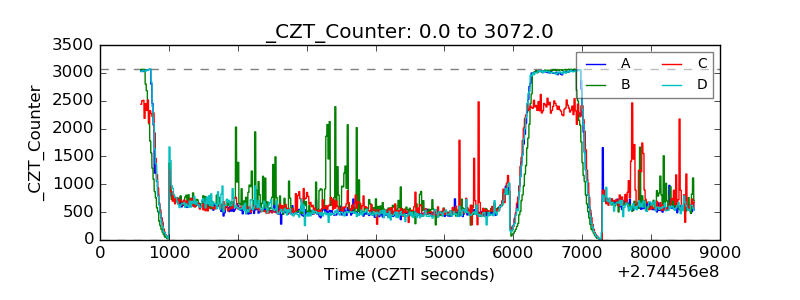 |
| +2.5 Volts monitor |  |
| +5 Volts monitor | 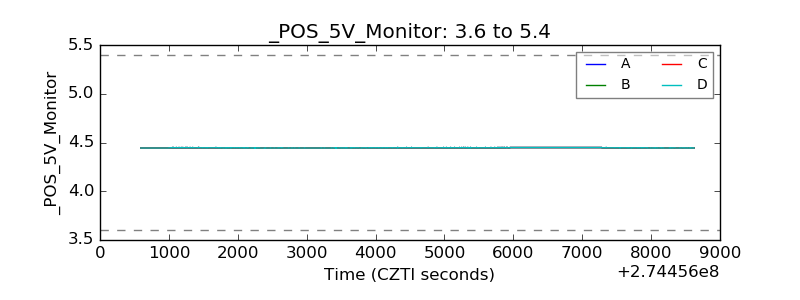 |
| _ROLL_ROT | 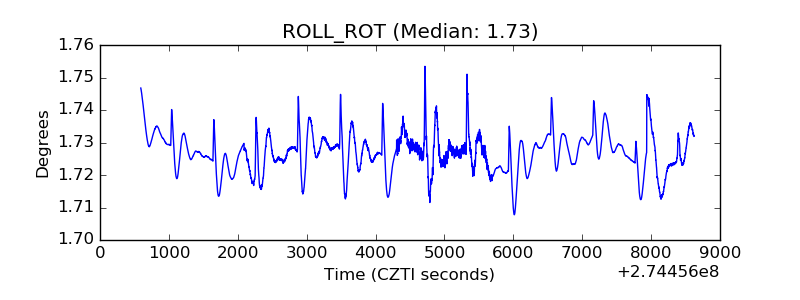 |
| _Roll_DEC | 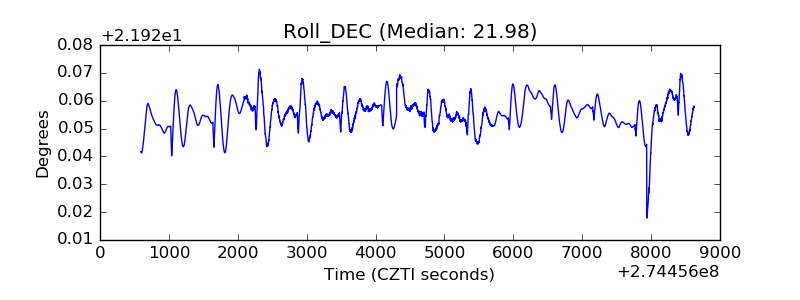 |
| _Roll_RA | 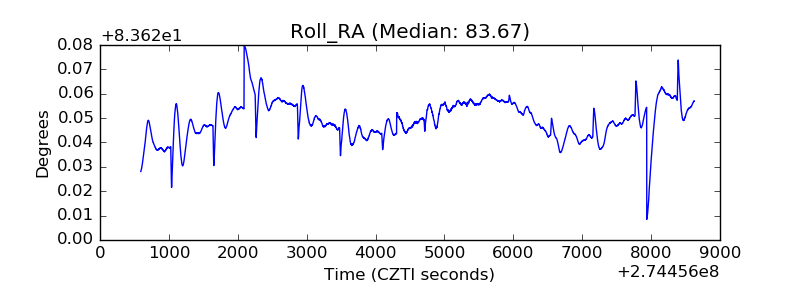 |
| Veto Counter | 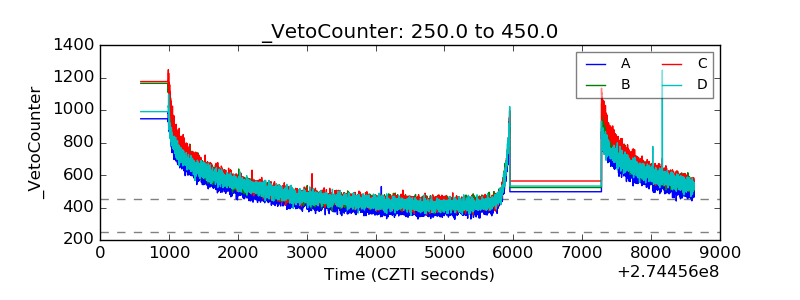 |