| Param | Original file | Final file |
|---|---|---|
| Filename | modeM0/AS1T02_090T01_9000002360_15994cztM0_level2.evt | modeM0/AS1T02_090T01_9000002360_15994cztM0_level2_quad_clean.evt |
| Size (bytes) | 514,650,240 | 76,351,680 |
| Size | 490.8 MB | 72.8 MB |
| Events in quadrant A | 3,431,723 | 478,257 |
| Events in quadrant B | 4,061,103 | 480,349 |
| Events in quadrant C | 4,186,424 | 463,120 |
| Events in quadrant D | 3,487,867 | 458,607 |
| Mode M0 | |||
|---|---|---|---|
| Quadrant | BADHDUFLAG | Total packets | Discarded packets |
| A | 0 | 14086 | 3 |
| B | 0 | 16263 | 2 |
| C | 0 | 16666 | 2 |
| D | 0 | 14535 | 2 |
| Mode SS | |||
|---|---|---|---|
| Quadrant | BADHDUFLAG | Total packets | Discarded packets |
| A | 0 | 126 | 0 |
| B | 0 | 126 | 0 |
| C | 0 | 126 | 0 |
| D | 0 | 126 | 0 |
| Mode M9 | |||
|---|---|---|---|
| Quadrant | BADHDUFLAG | Total packets | Discarded packets |
| A | 0 | 26 | 0 |
| B | 0 | 26 | 0 |
| C | 0 | 26 | 0 |
| D | 0 | 26 | 0 |
| Quadrant | Total seconds | Saturated seconds | Saturation percentage |
|---|---|---|---|
| A | 6183 | 106 | 1.714378% |
| B | 6183 | 204 | 3.299369% |
| C | 6183 | 266 | 4.302119% |
| D | 6183 | 101 | 1.633511% |
Noise dominated data is calculated using 1-second bins in cleaned event files. If a bin has >2000 counts, and if more than 50% of those come from <1% of pixels, then it is considered to be noise-dominated and hence unusable.
| Quadrant | # 1 sec bins | Bins with >0 counts | Bins with >2000 counts | High rate bins dominated by noise | Noise dominated (total time) | Noise dominated (detector-on time) | Marked lightcurve |
|---|---|---|---|---|---|---|---|
| A | 7529 | 6184 | 4 | 4 | 0.05% | 0.06% |  |
| B | 7529 | 6184 | 72 | 72 | 0.96% | 1.16% | 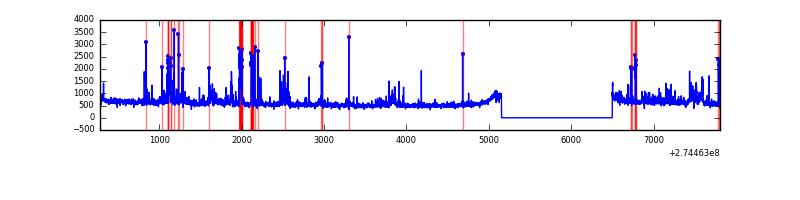 |
| C | 7529 | 6184 | 81 | 81 | 1.08% | 1.31% | 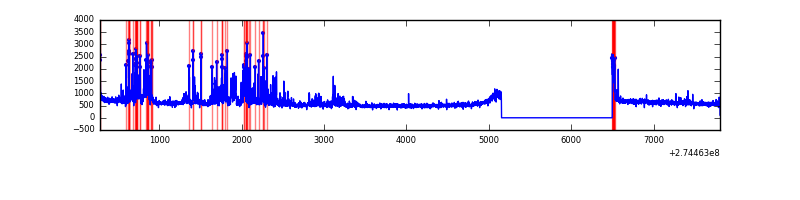 |
| D | 7529 | 6184 | 11 | 11 | 0.15% | 0.18% | 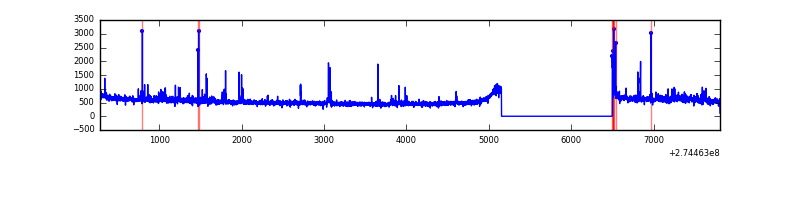 |
Top three noisy pixels from each quadrant. If the there are fewer than three noisy pixels in the level2.evt file, extra rows are filled as -1
| Pixel properties | Quadrant properties | ||||||
|---|---|---|---|---|---|---|---|
| Quadrant | DetID | PixID | Counts | Sigma | Mean | Median | Sigma |
| A | 9 | 143 | 17251 | 92.48 | 881 | 866 | 177.2 |
| A | 15 | 239 | 14439 | 76.61 | 881 | 866 | 177.2 |
| A | 12 | 96 | 9505 | 48.76 | 881 | 866 | 177.2 |
| B | 7 | 220 | 218686 | 1335.76 | 873 | 857 | 163.1 |
| B | 10 | 245 | 157774 | 962.24 | 873 | 857 | 163.1 |
| B | 4 | 216 | 98065 | 596.1 | 873 | 857 | 163.1 |
| C | 9 | 236 | 568130 | 2930.65 | 844 | 856 | 193.6 |
| C | 0 | 207 | 137238 | 704.58 | 844 | 856 | 193.6 |
| C | 14 | 238 | 131241 | 673.6 | 844 | 856 | 193.6 |
| D | 2 | 152 | 93352 | 438.49 | 866 | 844 | 211.0 |
| D | 12 | 218 | 59579 | 278.4 | 866 | 844 | 211.0 |
| D | 2 | 234 | 27652 | 127.07 | 866 | 844 | 211.0 |
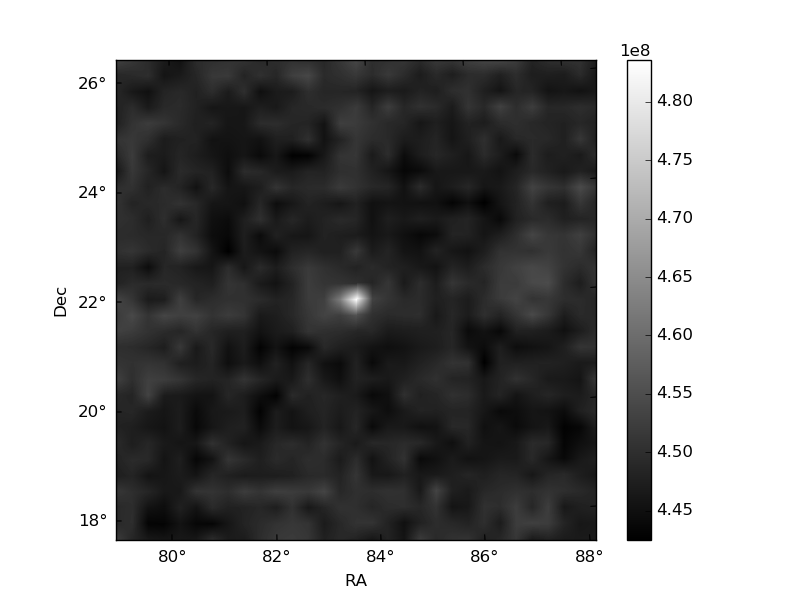
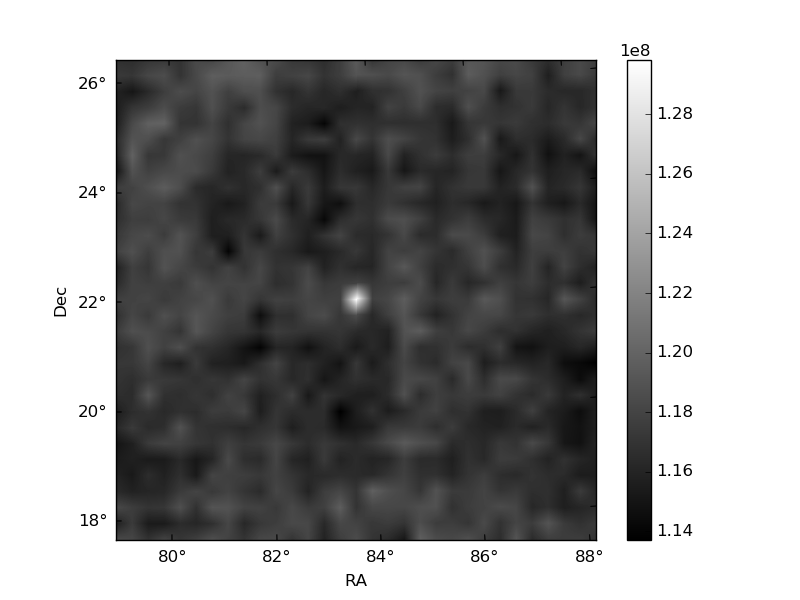
Histogram calculated using DETX and DETY for each event in the final _common_clean file
| Quadrant A | 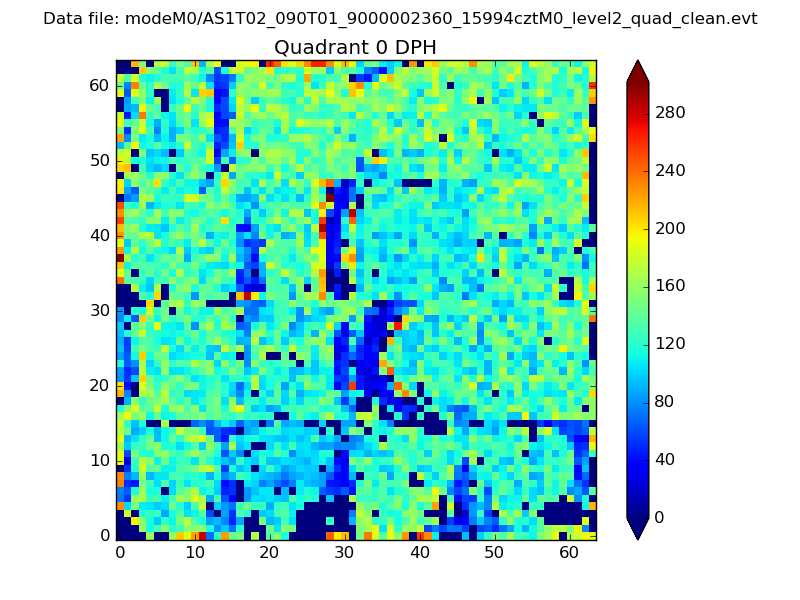 |
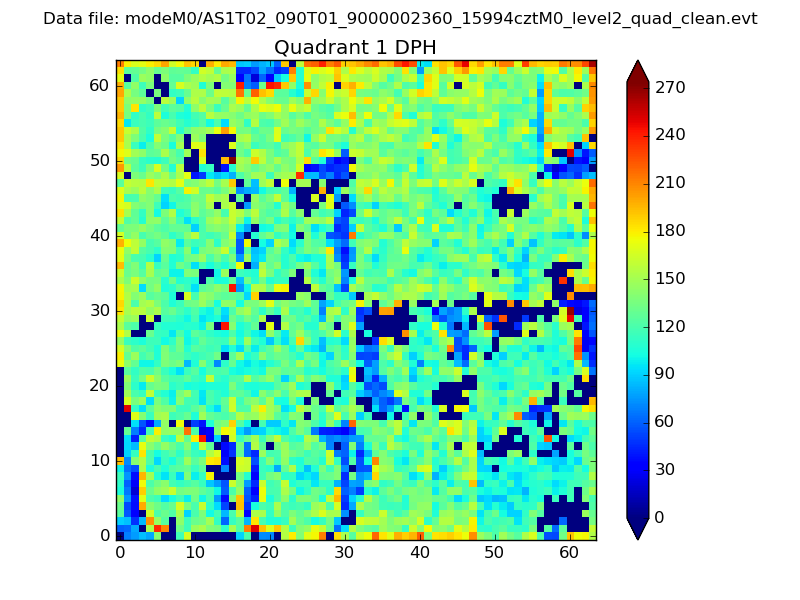 |
Quadrant B |
|---|---|---|---|
| Quadrant D | 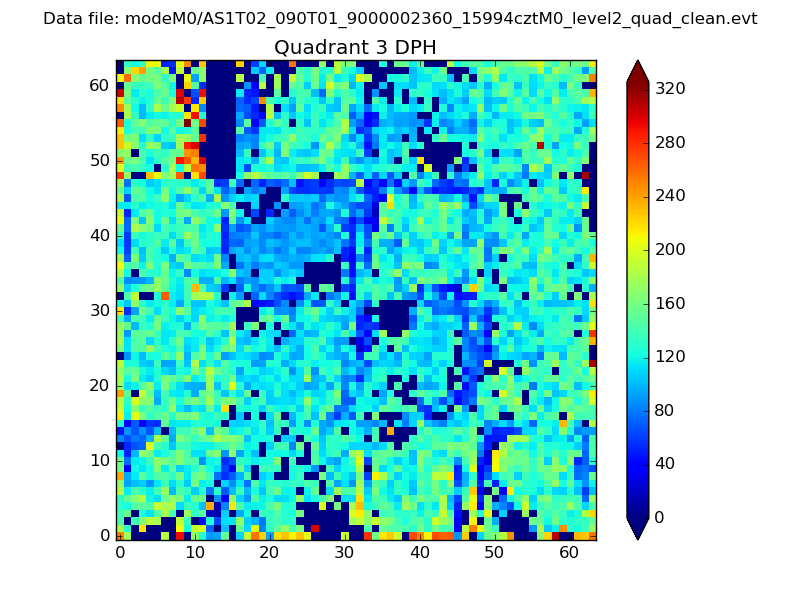 |
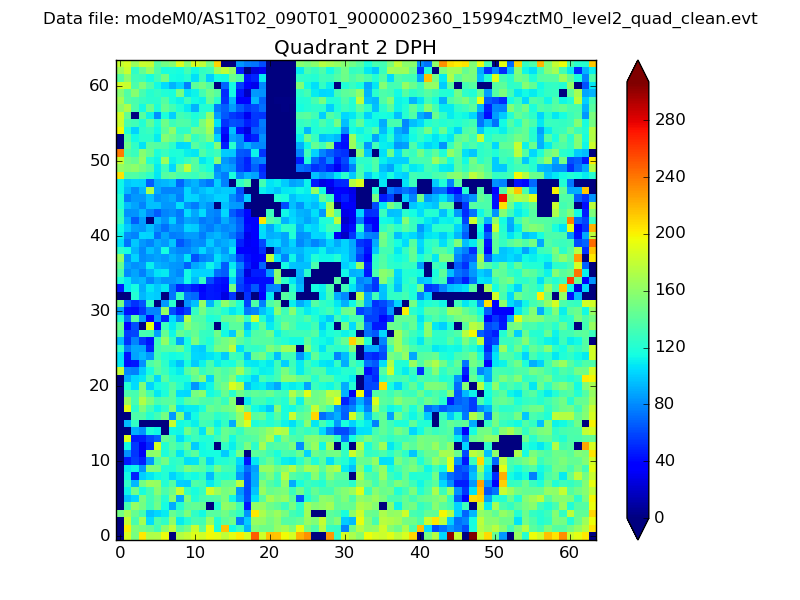 |
Quadrant C |
| Plot type | Count rate plots | Images |
|---|---|---|
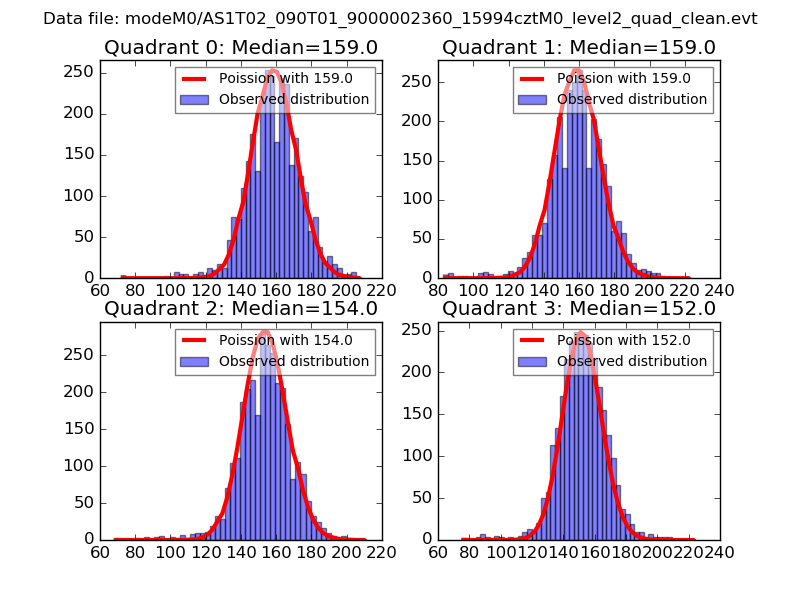
| Comparison with Poisson distribution Blue bars denote a histogram of data divided into 1 sec bins. Red curve is a Poisson curve with rate = median count rate of data. |
 |
 |
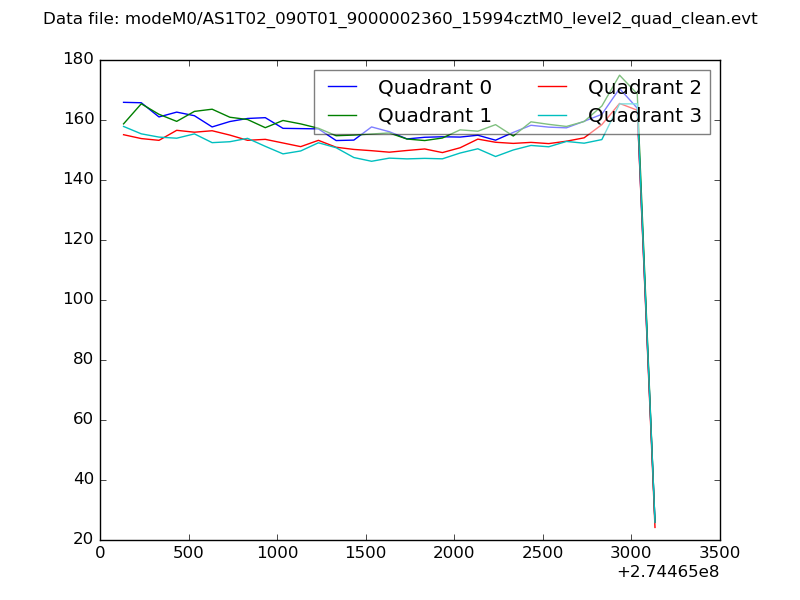
| Quadrant-wise count rates Data is divided into 100 sec bins |
 |
|
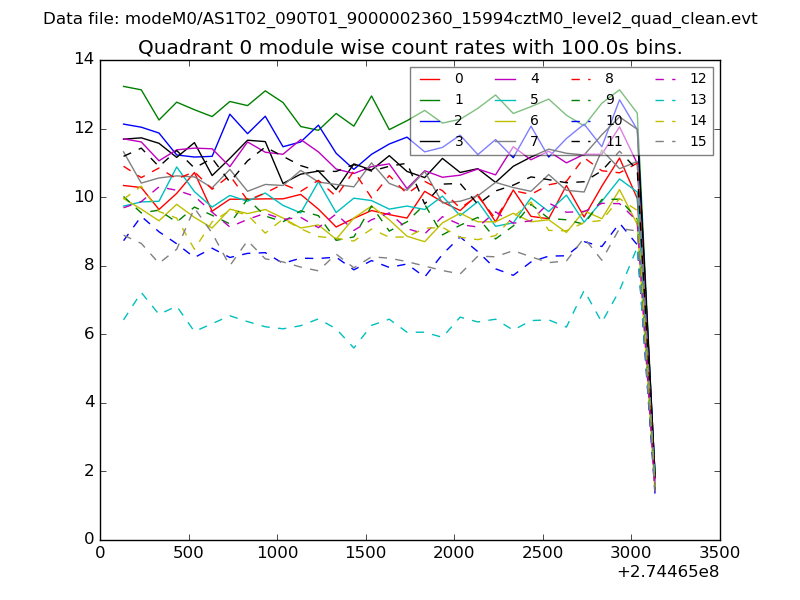
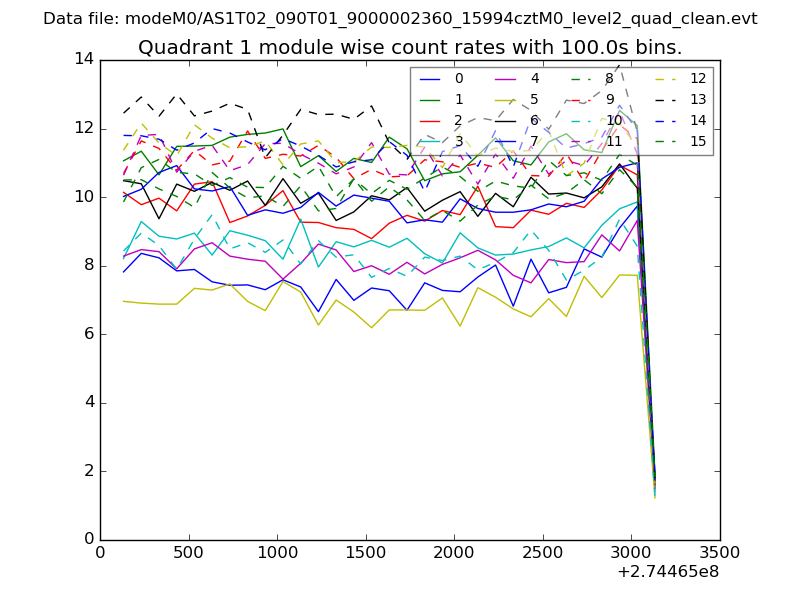
| Module-wise count rates for Quadrant A Data is divided into 100 sec bins |
 |
 |
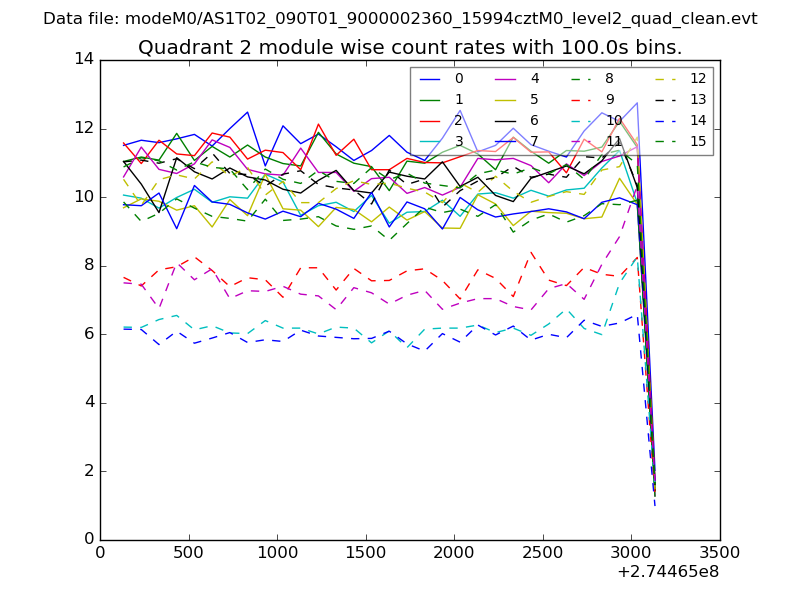
| Module-wise count rates for Quadrant B Data is divided into 100 sec bins |
 |
 |
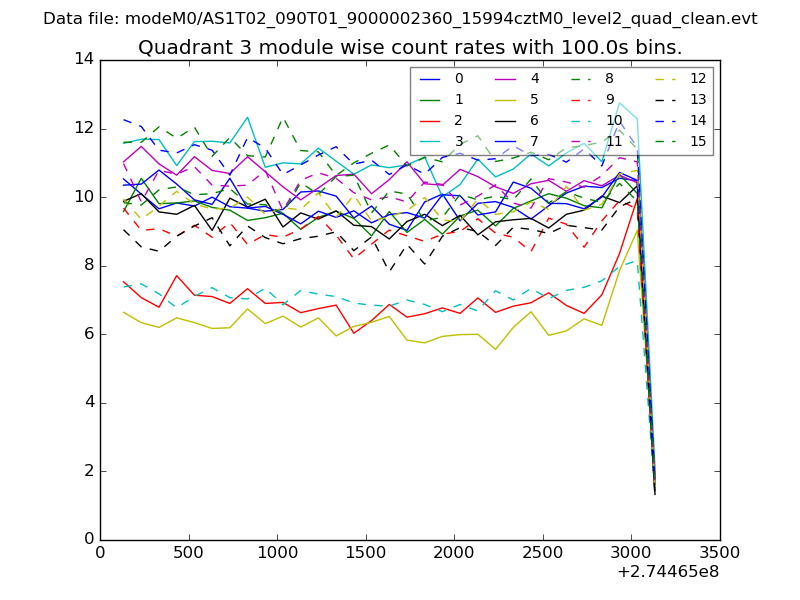
| Module-wise count rates for Quadrant C Data is divided into 100 sec bins |
 |
 |
| Module-wise count rates for Quadrant D Data is divided into 100 sec bins |
 |
 |
| Parameter | Plot |
|---|---|
| CZT HV Monitor |  |
| D_VDD | 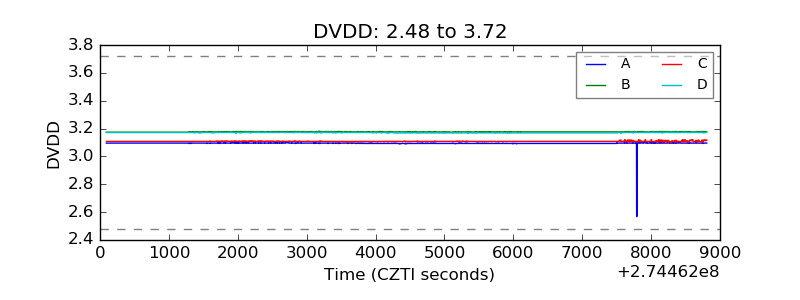 |
| Temperature 1 | 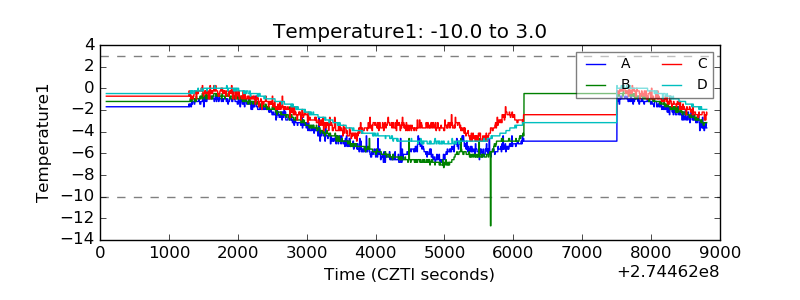 |
| Veto HV Monitor | 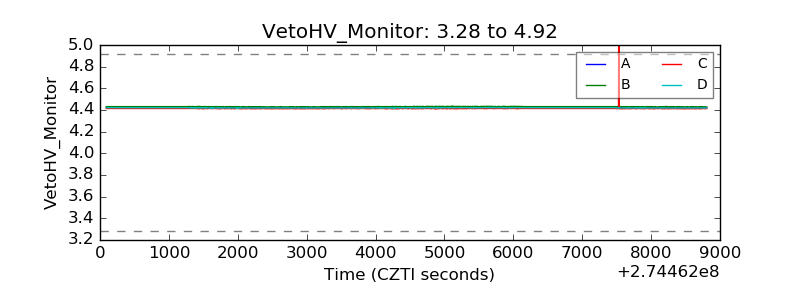 |
| Veto LLD | 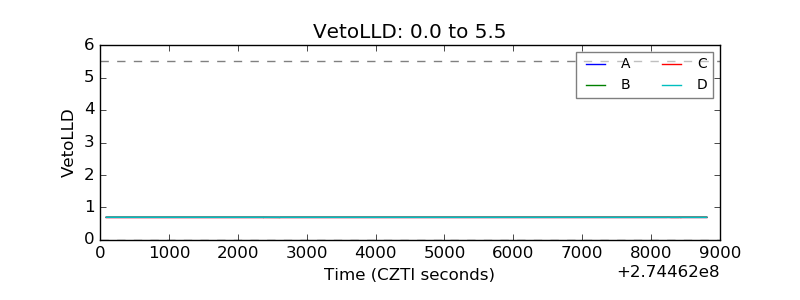 |
| Alpha Counter | 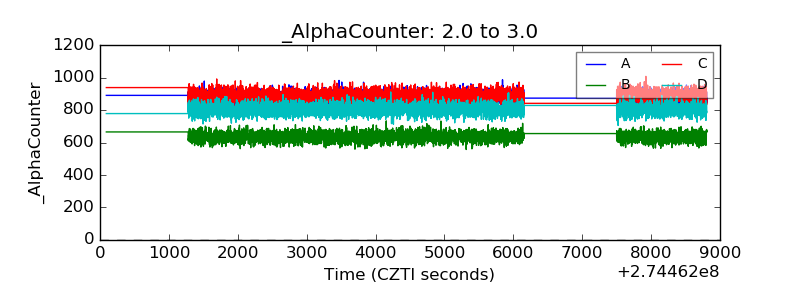 |
| _CPM_Rate | 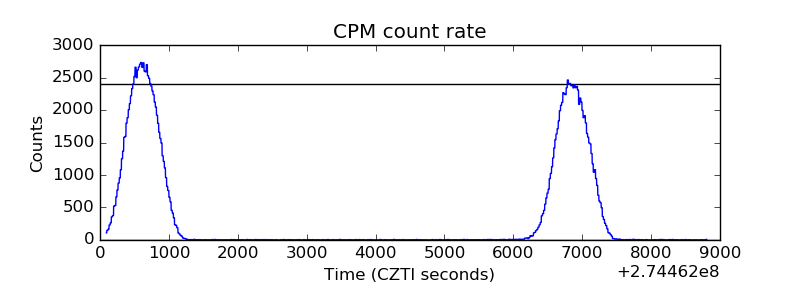 |
| CZT Counter | 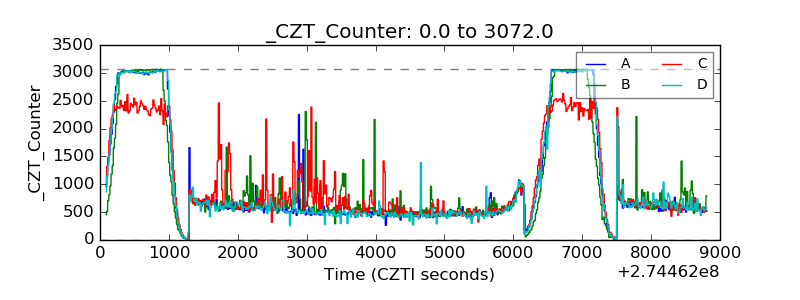 |
| +2.5 Volts monitor |  |
| +5 Volts monitor |  |
| _ROLL_ROT | 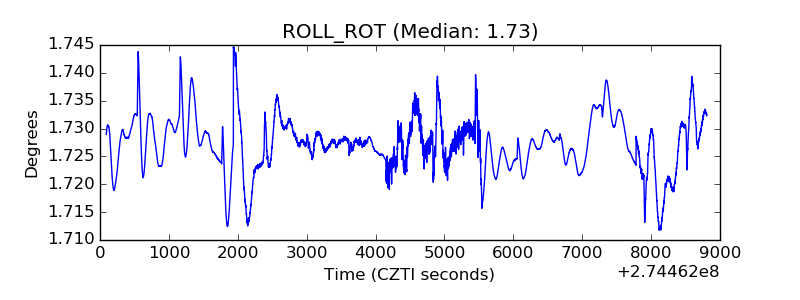 |
| _Roll_DEC | 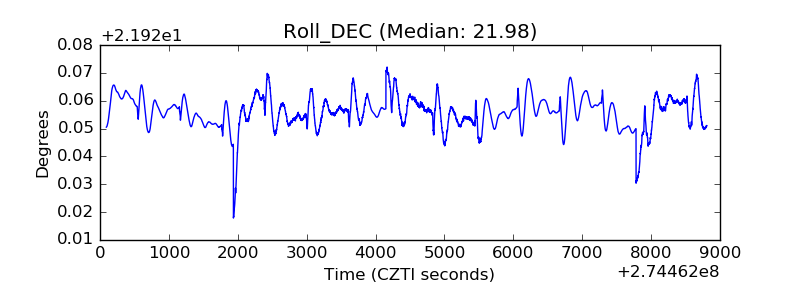 |
| _Roll_RA | 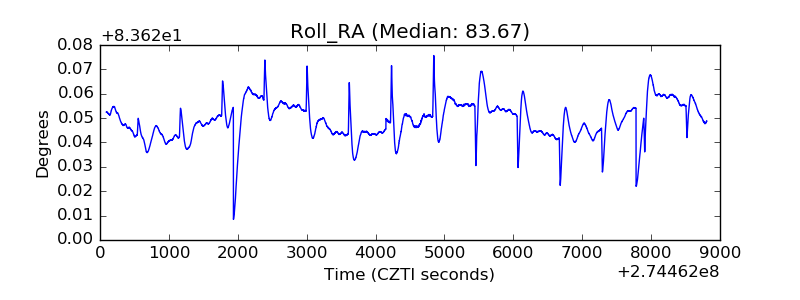 |
| Veto Counter | 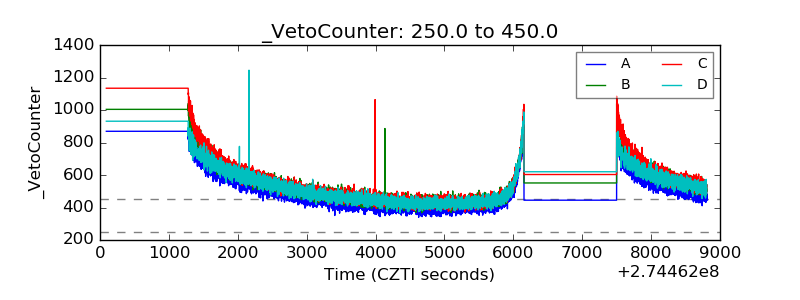 |