| Param | Original file | Final file |
|---|---|---|
| Filename | modeM0/AS1T02_090T01_9000002360_15997cztM0_level2.evt | modeM0/AS1T02_090T01_9000002360_15997cztM0_level2_quad_clean.evt |
| Size (bytes) | 480,358,080 | 102,418,560 |
| Size | 458.1 MB | 97.7 MB |
| Events in quadrant A | 3,439,016 | 665,148 |
| Events in quadrant B | 3,654,032 | 674,751 |
| Events in quadrant C | 3,479,370 | 650,003 |
| Events in quadrant D | 3,511,381 | 636,094 |
| Mode M0 | |||
|---|---|---|---|
| Quadrant | BADHDUFLAG | Total packets | Discarded packets |
| A | 0 | 14479 | 3 |
| B | 0 | 15143 | 2 |
| C | 0 | 14327 | 2 |
| D | 0 | 15023 | 2 |
| Mode SS | |||
|---|---|---|---|
| Quadrant | BADHDUFLAG | Total packets | Discarded packets |
| A | 0 | 138 | 0 |
| B | 0 | 138 | 0 |
| C | 0 | 138 | 0 |
| D | 0 | 138 | 0 |
| Mode M9 | |||
|---|---|---|---|
| Quadrant | BADHDUFLAG | Total packets | Discarded packets |
| A | 0 | 10 | 0 |
| B | 0 | 10 | 0 |
| C | 0 | 10 | 0 |
| D | 0 | 11 | 0 |
| Quadrant | Total seconds | Saturated seconds | Saturation percentage |
|---|---|---|---|
| A | 6831 | 46 | 0.673401% |
| B | 6831 | 115 | 1.683502% |
| C | 6831 | 115 | 1.683502% |
| D | 6831 | 75 | 1.097936% |
Noise dominated data is calculated using 1-second bins in cleaned event files. If a bin has >2000 counts, and if more than 50% of those come from <1% of pixels, then it is considered to be noise-dominated and hence unusable.
| Quadrant | # 1 sec bins | Bins with >0 counts | Bins with >2000 counts | High rate bins dominated by noise | Noise dominated (total time) | Noise dominated (detector-on time) | Marked lightcurve |
|---|---|---|---|---|---|---|---|
| A | 7567 | 6833 | 4 | 4 | 0.05% | 0.06% | 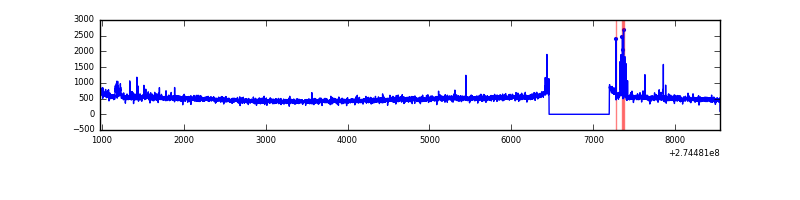 |
| B | 7567 | 6833 | 12 | 12 | 0.16% | 0.18% | 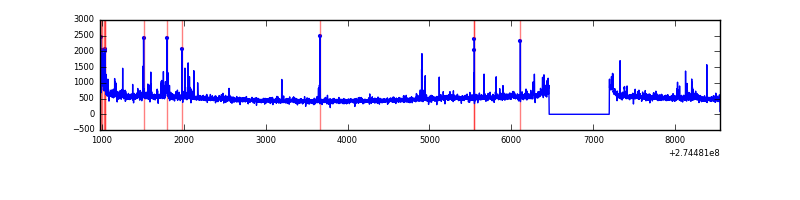 |
| C | 7567 | 6833 | 3 | 3 | 0.04% | 0.04% | 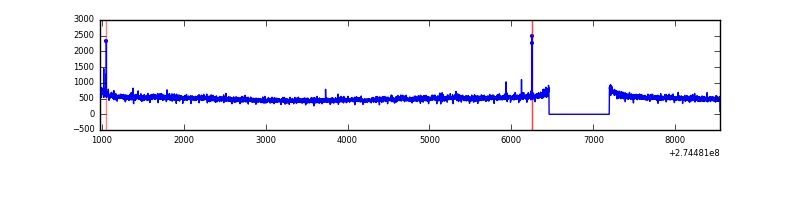 |
| D | 7567 | 6833 | 19 | 19 | 0.25% | 0.28% | 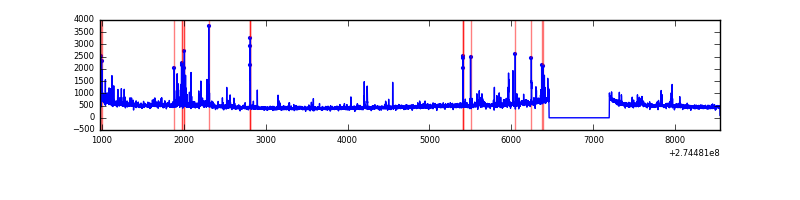 |
Top three noisy pixels from each quadrant. If the there are fewer than three noisy pixels in the level2.evt file, extra rows are filled as -1
| Pixel properties | Quadrant properties | ||||||
|---|---|---|---|---|---|---|---|
| Quadrant | DetID | PixID | Counts | Sigma | Mean | Median | Sigma |
| A | 15 | 239 | 51228 | 284.93 | 863 | 847 | 176.8 |
| A | 9 | 143 | 41795 | 231.58 | 863 | 847 | 176.8 |
| A | 13 | 210 | 19771 | 107.02 | 863 | 847 | 176.8 |
| B | 0 | 229 | 55011 | 329.62 | 866 | 845 | 164.3 |
| B | 0 | 189 | 45180 | 269.79 | 866 | 845 | 164.3 |
| B | 10 | 245 | 44878 | 267.95 | 866 | 845 | 164.3 |
| C | 14 | 238 | 126967 | 640.73 | 834 | 843 | 196.8 |
| C | 3 | 233 | 80450 | 404.42 | 834 | 843 | 196.8 |
| C | 0 | 207 | 16356 | 78.81 | 834 | 843 | 196.8 |
| D | 12 | 218 | 166285 | 797.98 | 841 | 820 | 207.4 |
| D | 2 | 152 | 63646 | 302.99 | 841 | 820 | 207.4 |
| D | 4 | 239 | 30536 | 143.31 | 841 | 820 | 207.4 |
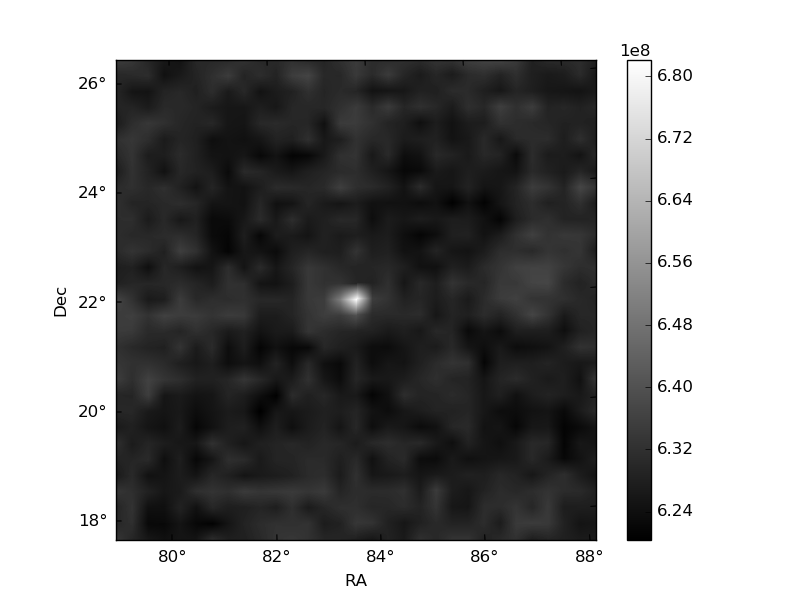
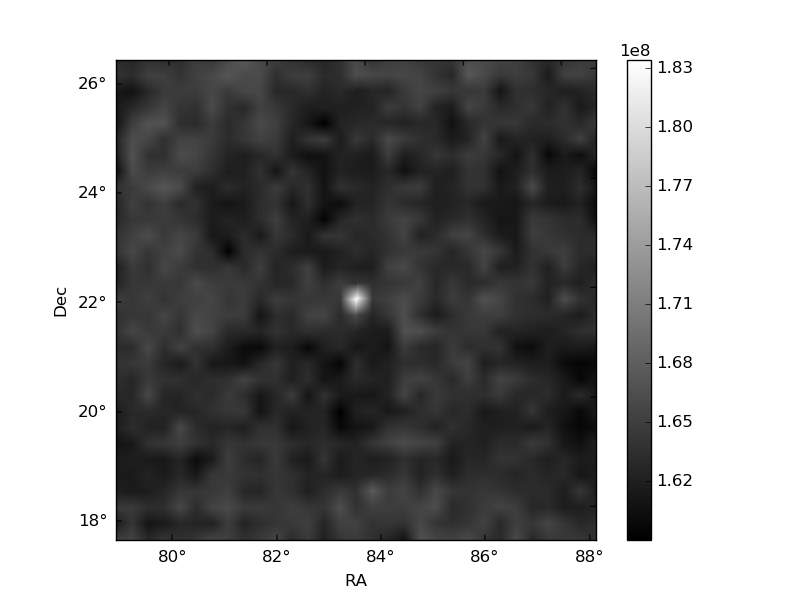
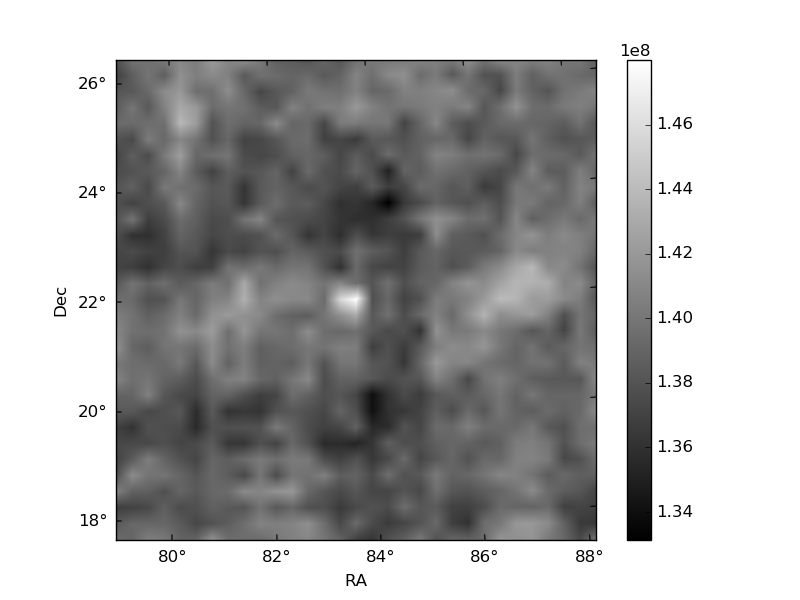
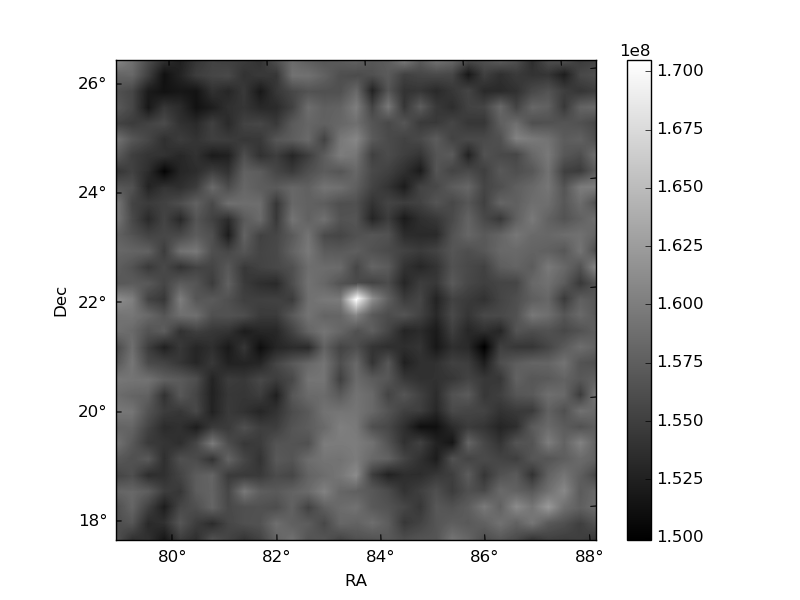
Histogram calculated using DETX and DETY for each event in the final _common_clean file
| Quadrant A | 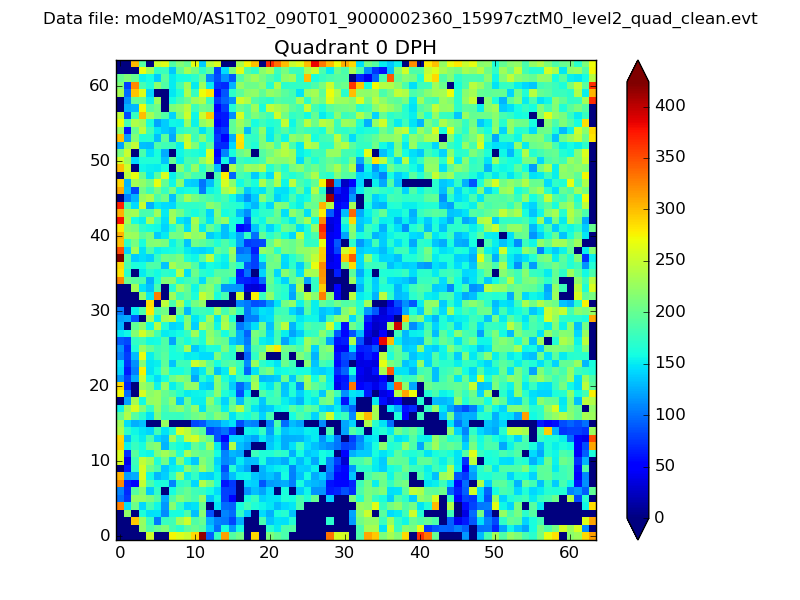 |
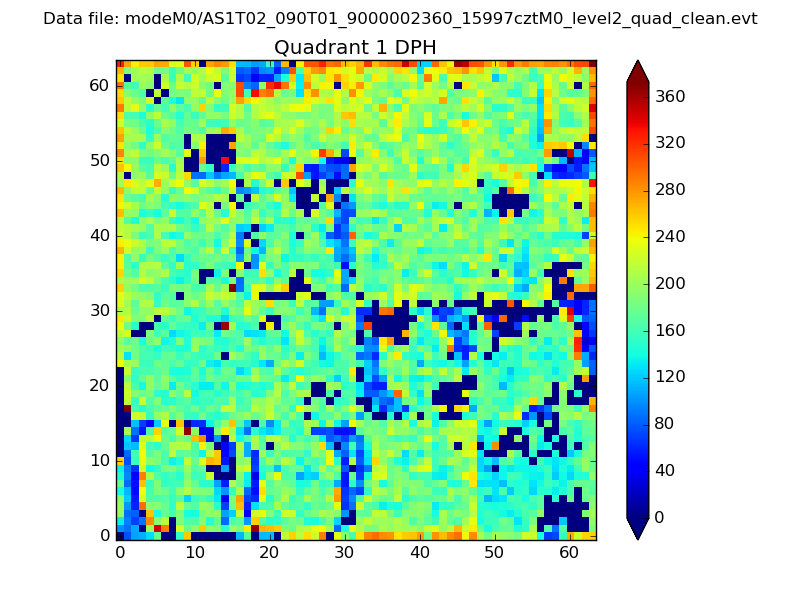 |
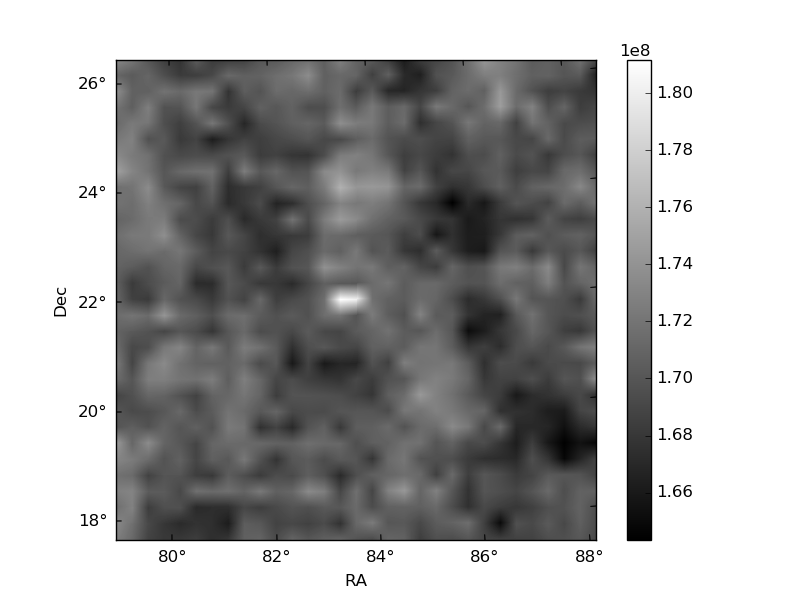
Quadrant B |
|---|---|---|---|
| Quadrant D | 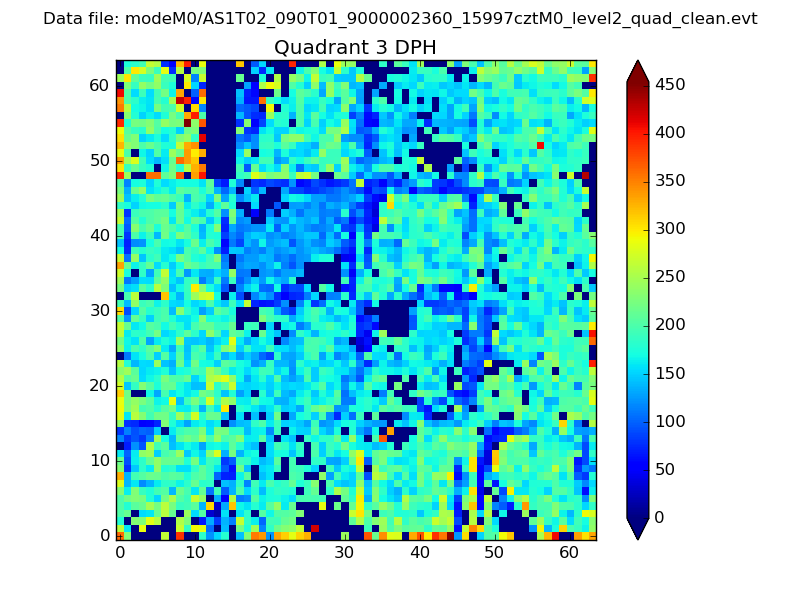 |
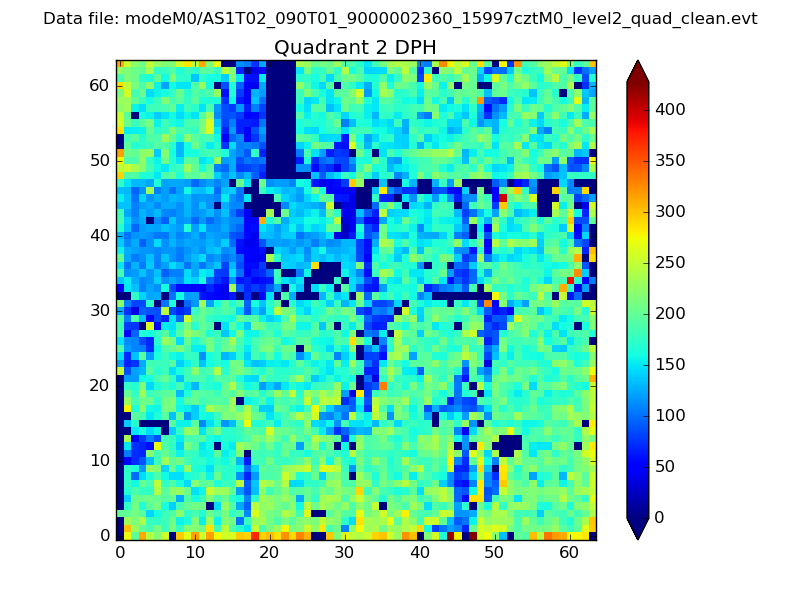 |
Quadrant C |
| Plot type | Count rate plots | Images |
|---|---|---|
| Comparison with Poisson distribution Blue bars denote a histogram of data divided into 1 sec bins. Red curve is a Poisson curve with rate = median count rate of data. |
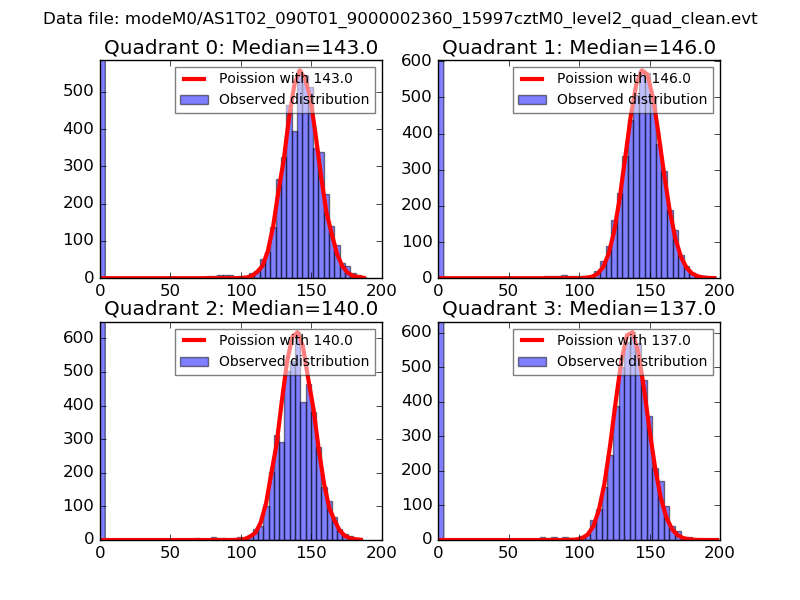 |
 |
| Quadrant-wise count rates Data is divided into 100 sec bins |
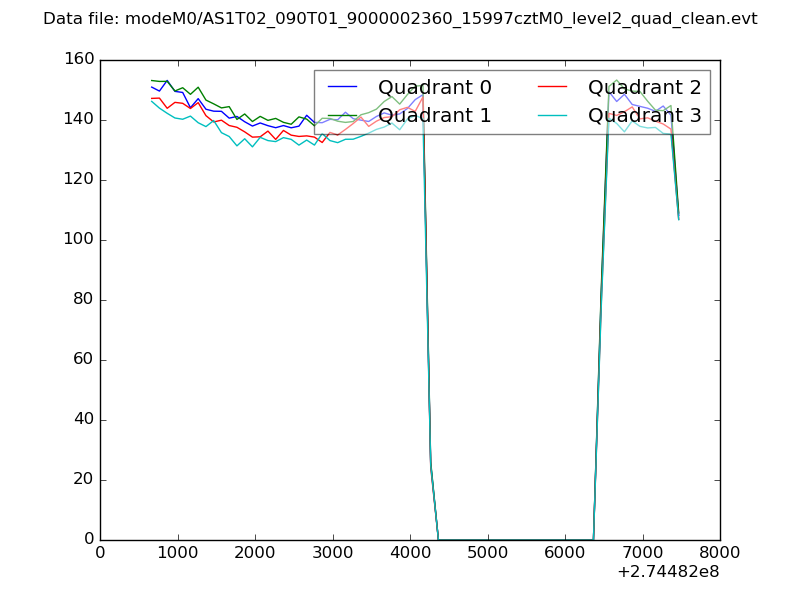 |
|
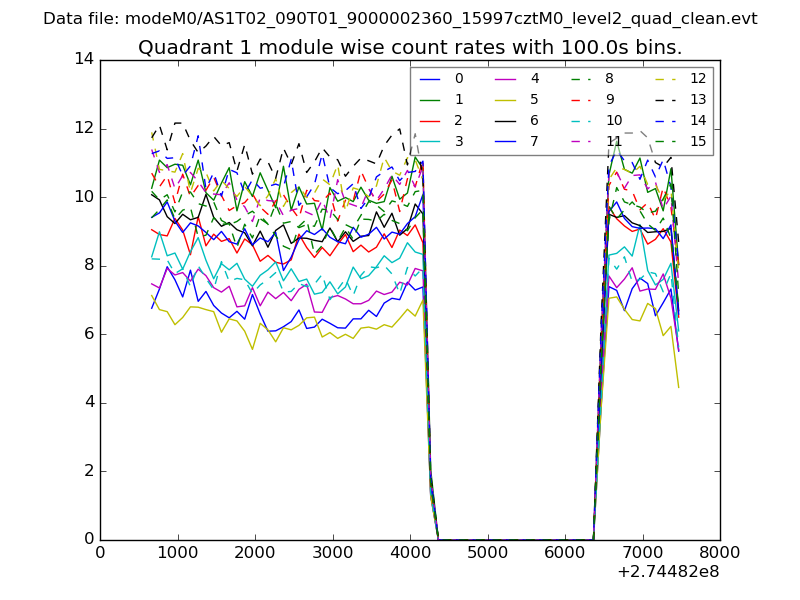
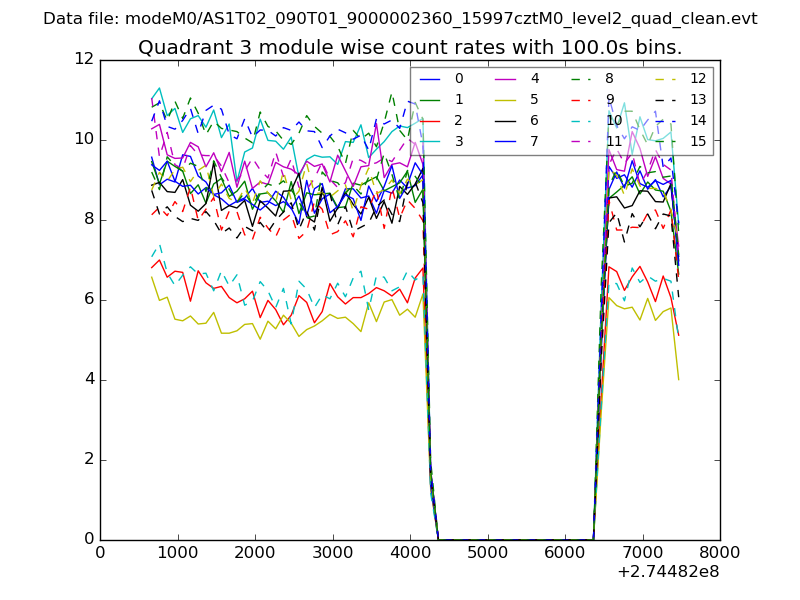
| Module-wise count rates for Quadrant A Data is divided into 100 sec bins |
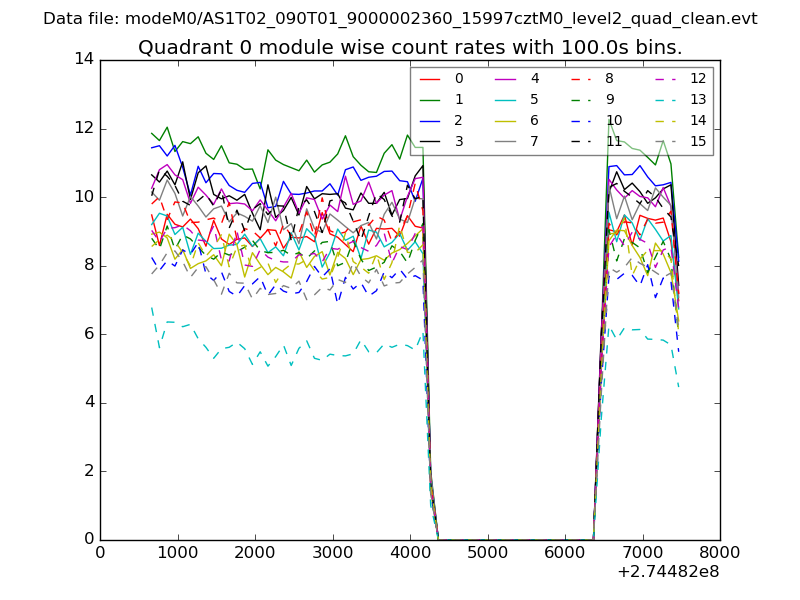 |
 |
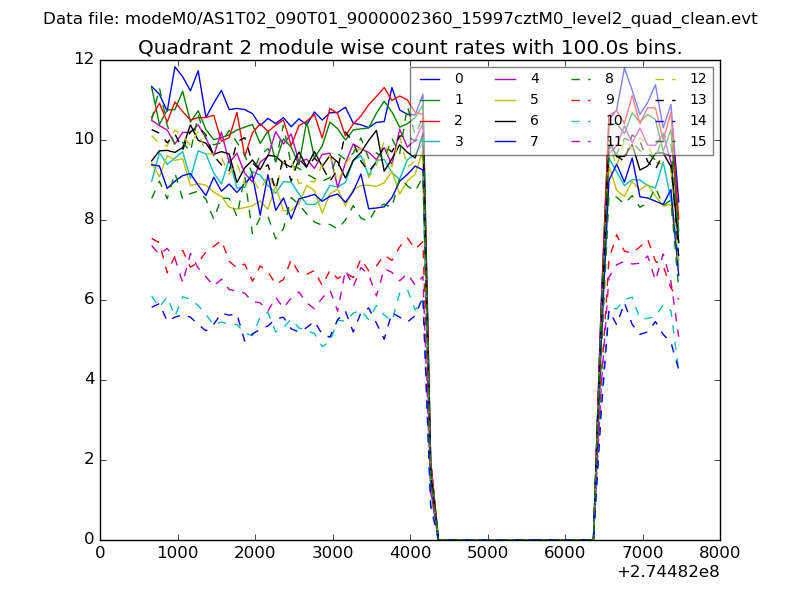
| Module-wise count rates for Quadrant B Data is divided into 100 sec bins |
 |
 |
| Module-wise count rates for Quadrant C Data is divided into 100 sec bins |
 |
 |
| Module-wise count rates for Quadrant D Data is divided into 100 sec bins |
 |
 |
| Parameter | Plot |
|---|---|
| CZT HV Monitor | 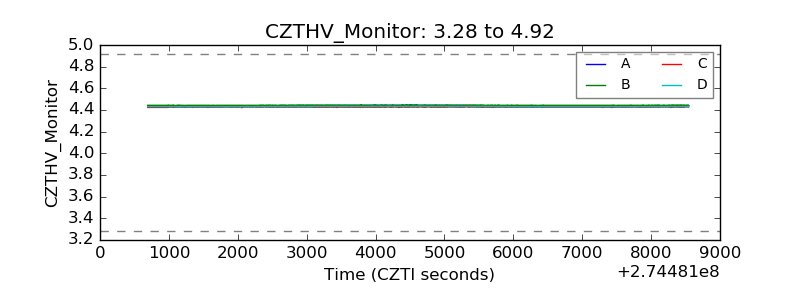 |
| D_VDD | 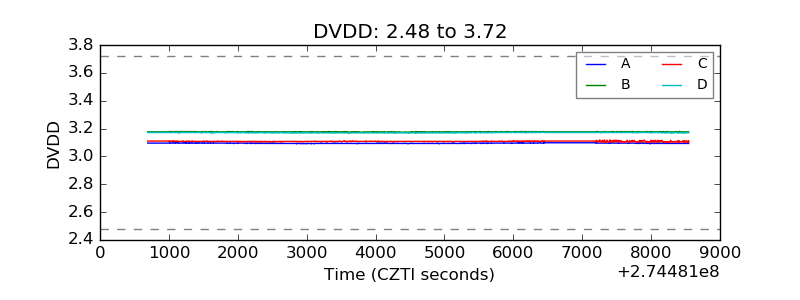 |
| Temperature 1 | 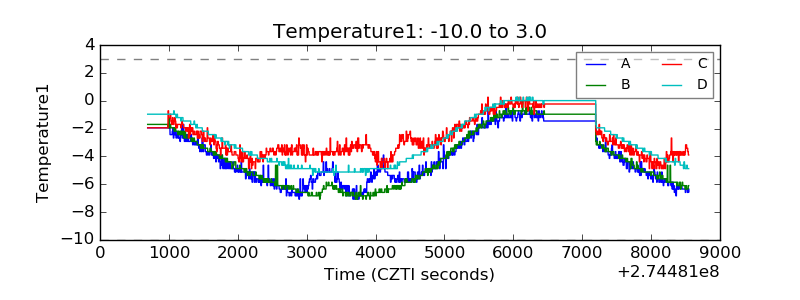 |
| Veto HV Monitor | 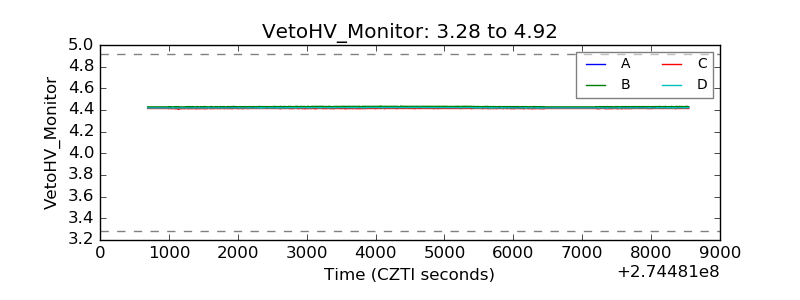 |
| Veto LLD | 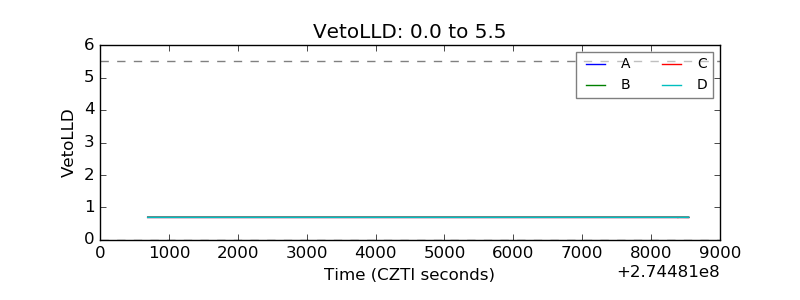 |
| Alpha Counter | 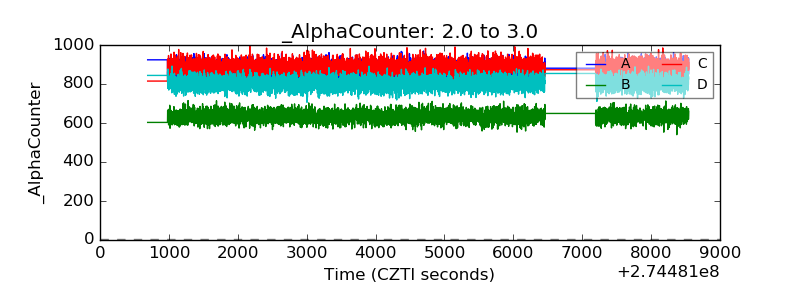 |
| _CPM_Rate | 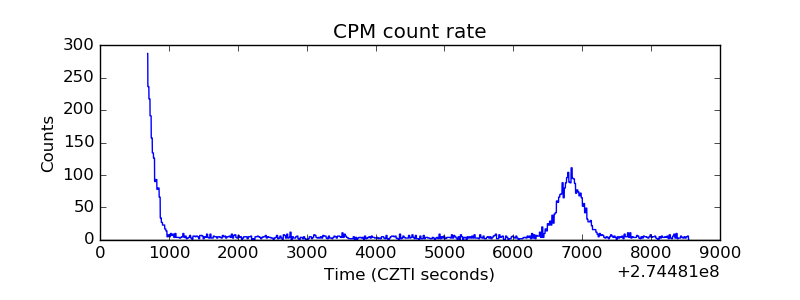 |
| CZT Counter | 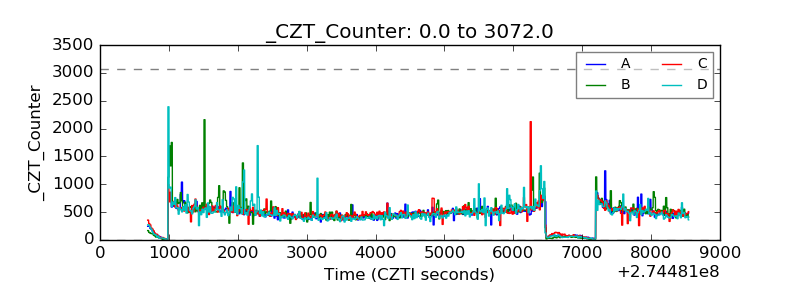 |
| +2.5 Volts monitor |  |
| +5 Volts monitor | 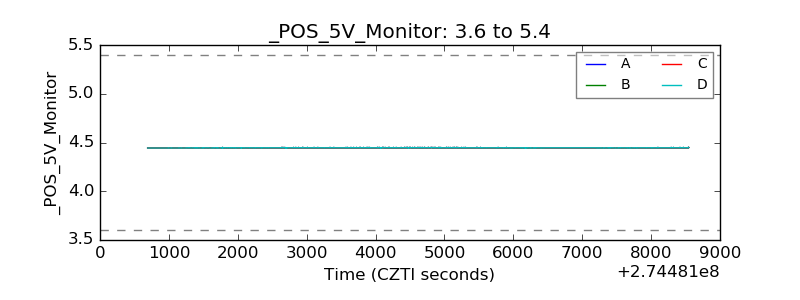 |
| _ROLL_ROT | 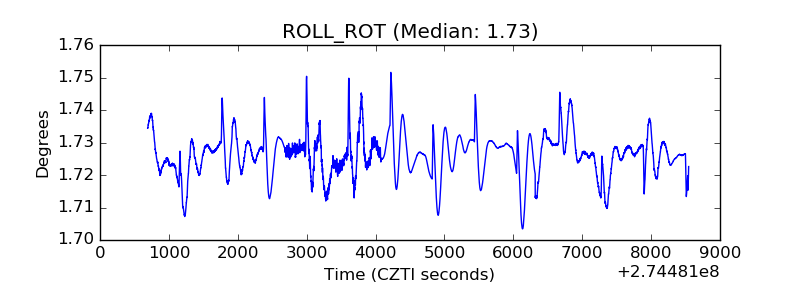 |
| _Roll_DEC | 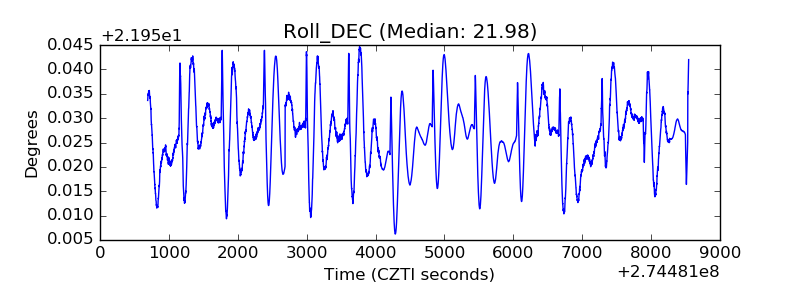 |
| _Roll_RA | 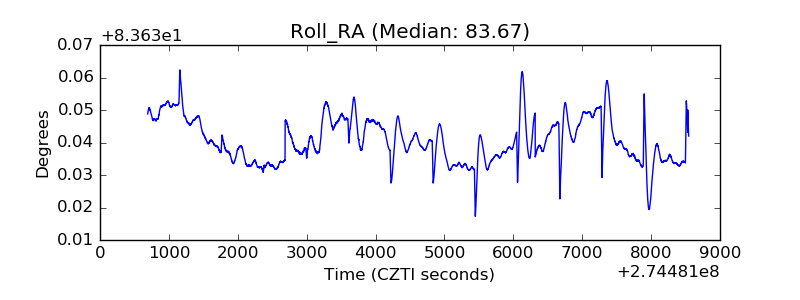 |
| Veto Counter | 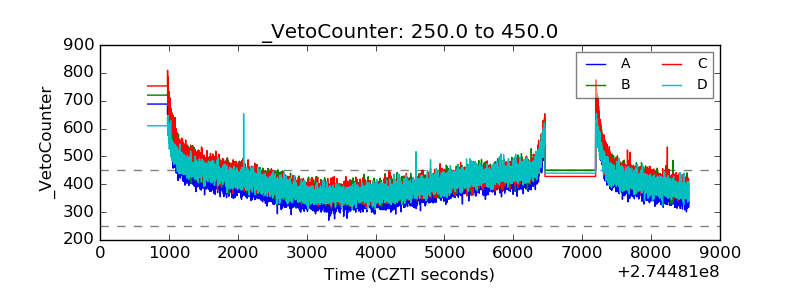 |