| Param | Original file | Final file |
|---|---|---|
| Filename | modeM0/AS1T02_090T01_9000002360_15998cztM0_level2.evt | modeM0/AS1T02_090T01_9000002360_15998cztM0_level2_quad_clean.evt |
| Size (bytes) | 522,123,840 | 82,823,040 |
| Size | 497.9 MB | 79.0 MB |
| Events in quadrant A | 3,832,922 | 501,872 |
| Events in quadrant B | 3,909,996 | 507,677 |
| Events in quadrant C | 3,787,499 | 488,858 |
| Events in quadrant D | 3,765,542 | 480,348 |
| Mode M0 | |||
|---|---|---|---|
| Quadrant | BADHDUFLAG | Total packets | Discarded packets |
| A | 0 | 16317 | 3 |
| B | 0 | 16464 | 2 |
| C | 0 | 16069 | 2 |
| D | 0 | 16523 | 2 |
| Mode SS | |||
|---|---|---|---|
| Quadrant | BADHDUFLAG | Total packets | Discarded packets |
| A | 0 | 156 | 0 |
| B | 0 | 156 | 0 |
| C | 0 | 156 | 0 |
| D | 0 | 156 | 0 |
| Mode M9 | |||
|---|---|---|---|
| Quadrant | BADHDUFLAG | Total packets | Discarded packets |
| A | 0 | 11 | 0 |
| B | 0 | 11 | 0 |
| C | 0 | 11 | 0 |
| D | 0 | 11 | 0 |
| Quadrant | Total seconds | Saturated seconds | Saturation percentage |
|---|---|---|---|
| A | 7608 | 91 | 1.196109% |
| B | 7608 | 138 | 1.813880% |
| C | 7608 | 128 | 1.682440% |
| D | 7608 | 55 | 0.722923% |
Noise dominated data is calculated using 1-second bins in cleaned event files. If a bin has >2000 counts, and if more than 50% of those come from <1% of pixels, then it is considered to be noise-dominated and hence unusable.
| Quadrant | # 1 sec bins | Bins with >0 counts | Bins with >2000 counts | High rate bins dominated by noise | Noise dominated (total time) | Noise dominated (detector-on time) | Marked lightcurve |
|---|---|---|---|---|---|---|---|
| A | 8684 | 7611 | 26 | 26 | 0.30% | 0.34% | 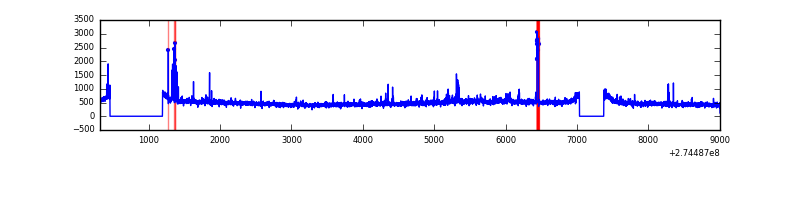 |
| B | 8684 | 7611 | 9 | 9 | 0.10% | 0.12% | 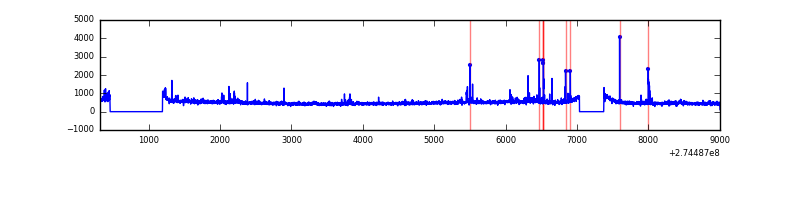 |
| C | 8684 | 7610 | 2 | 2 | 0.02% | 0.03% | 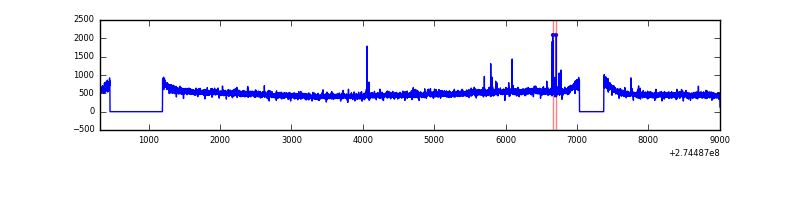 |
| D | 8684 | 7611 | 16 | 16 | 0.18% | 0.21% | 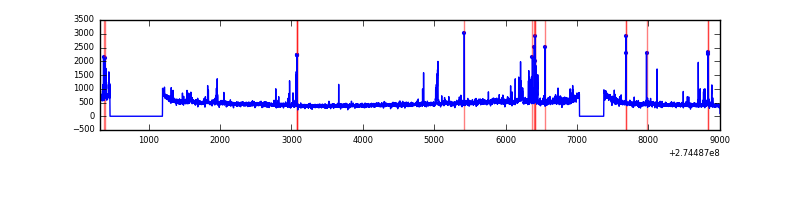 |
Top three noisy pixels from each quadrant. If the there are fewer than three noisy pixels in the level2.evt file, extra rows are filled as -1
| Pixel properties | Quadrant properties | ||||||
|---|---|---|---|---|---|---|---|
| Quadrant | DetID | PixID | Counts | Sigma | Mean | Median | Sigma |
| A | 13 | 210 | 86103 | 446.15 | 932 | 912 | 190.9 |
| A | 15 | 69 | 59723 | 308.0 | 932 | 912 | 190.9 |
| A | 15 | 239 | 51917 | 267.12 | 932 | 912 | 190.9 |
| B | 7 | 220 | 57336 | 315.37 | 937 | 916 | 178.9 |
| B | 0 | 229 | 46337 | 253.89 | 937 | 916 | 178.9 |
| B | 15 | 222 | 40355 | 220.45 | 937 | 916 | 178.9 |
| C | 14 | 238 | 137093 | 640.99 | 905 | 911 | 212.5 |
| C | 3 | 233 | 74974 | 348.61 | 905 | 911 | 212.5 |
| C | 0 | 207 | 19580 | 87.87 | 905 | 911 | 212.5 |
| D | 2 | 152 | 75476 | 332.74 | 913 | 886 | 224.2 |
| D | 4 | 239 | 57789 | 253.84 | 913 | 886 | 224.2 |
| D | 10 | 70 | 52742 | 231.33 | 913 | 886 | 224.2 |
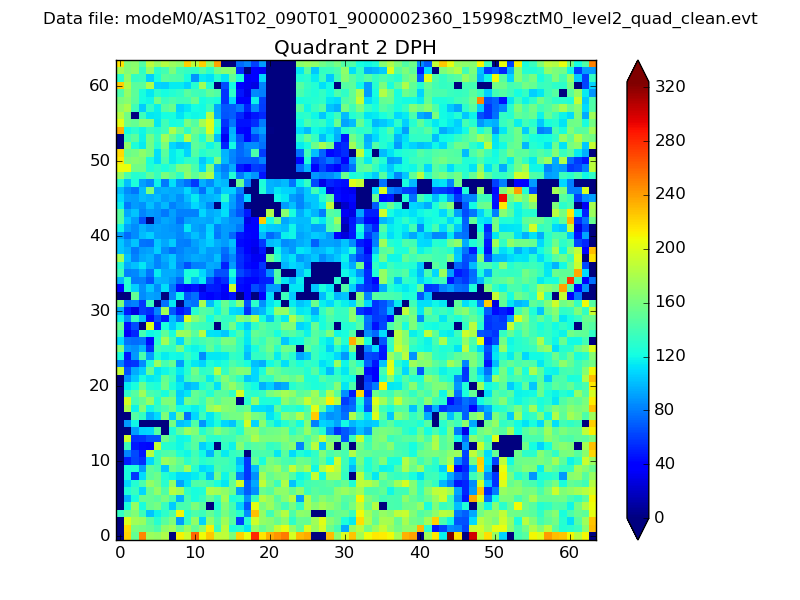
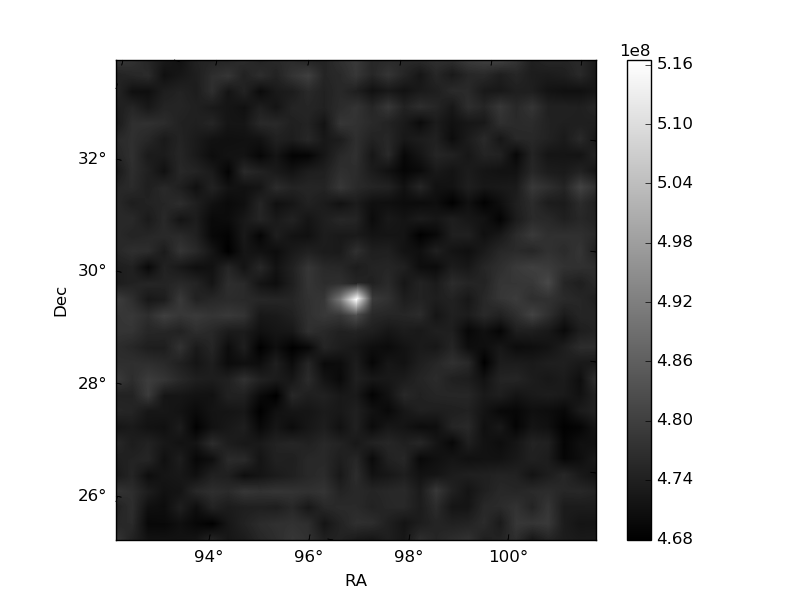
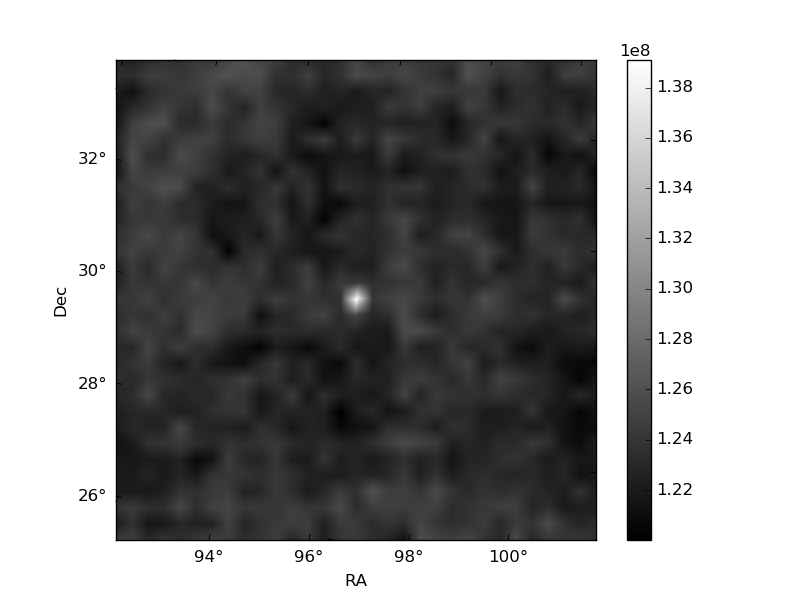
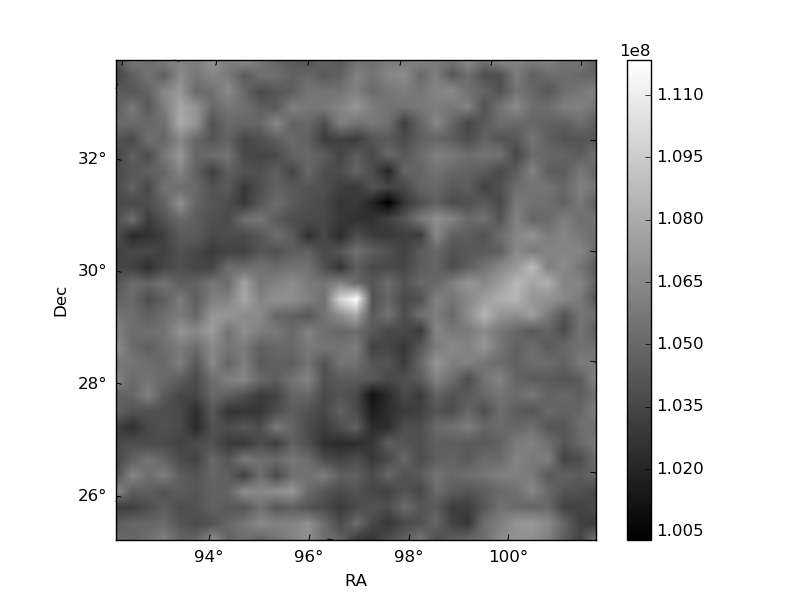
Histogram calculated using DETX and DETY for each event in the final _common_clean file
| Quadrant A | 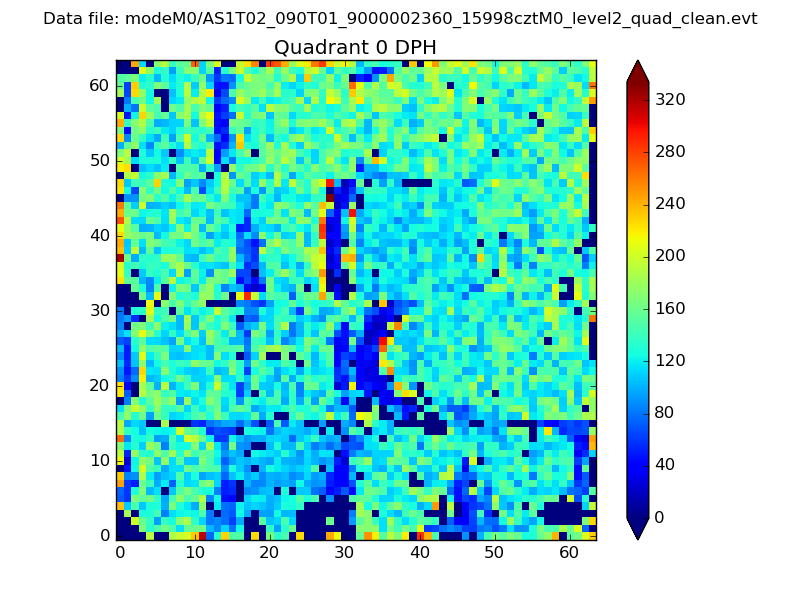 |
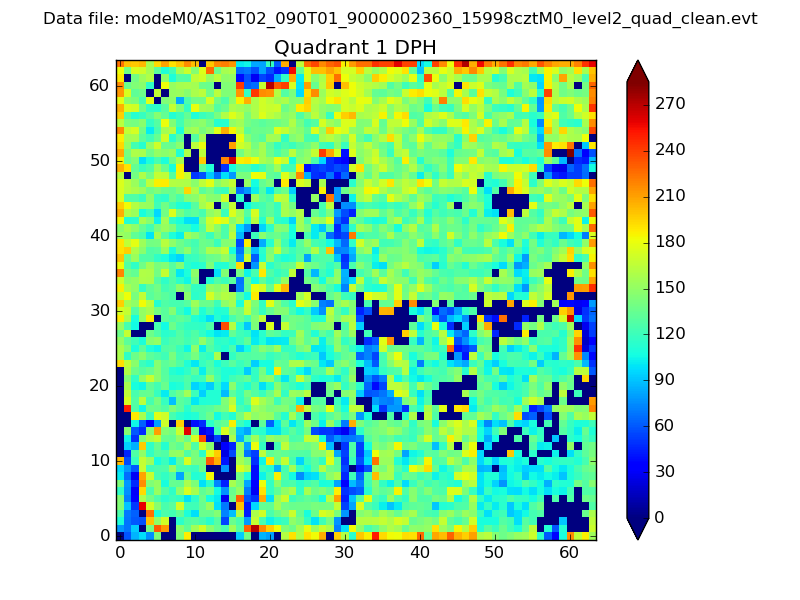 |
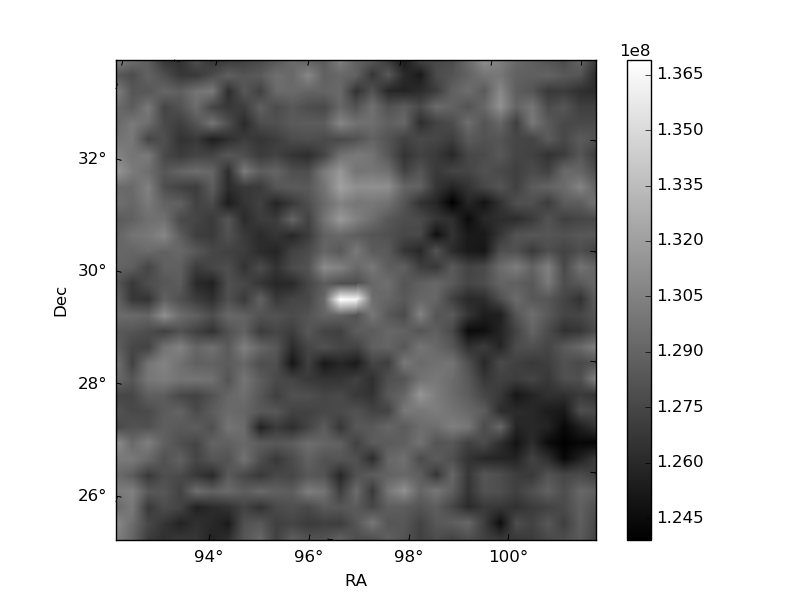
Quadrant B |
|---|---|---|---|
| Quadrant D | 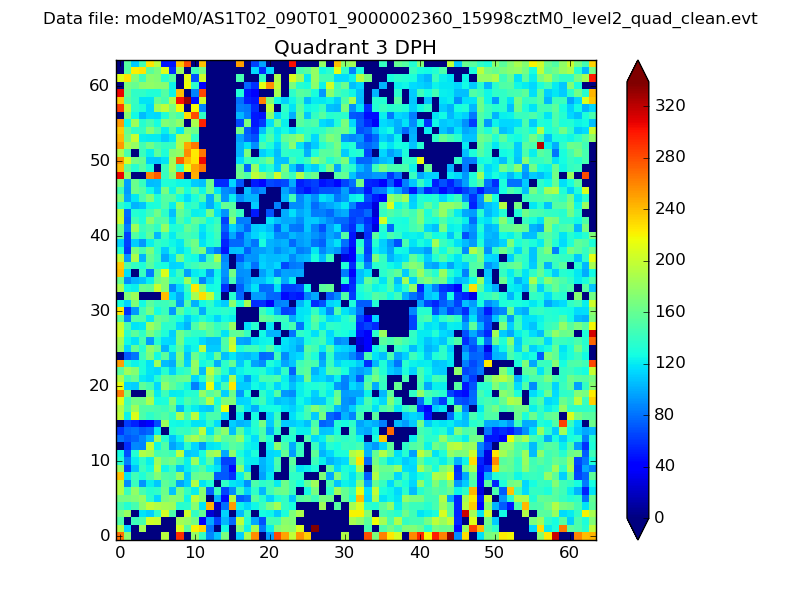 |
 |
Quadrant C |
| Plot type | Count rate plots | Images |
|---|---|---|
| Comparison with Poisson distribution Blue bars denote a histogram of data divided into 1 sec bins. Red curve is a Poisson curve with rate = median count rate of data. |
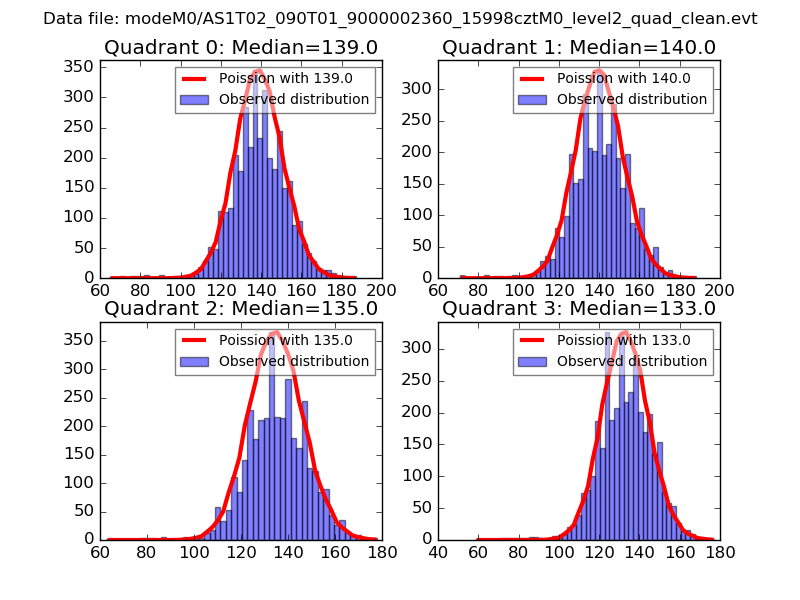 |
 |
| Quadrant-wise count rates Data is divided into 100 sec bins |
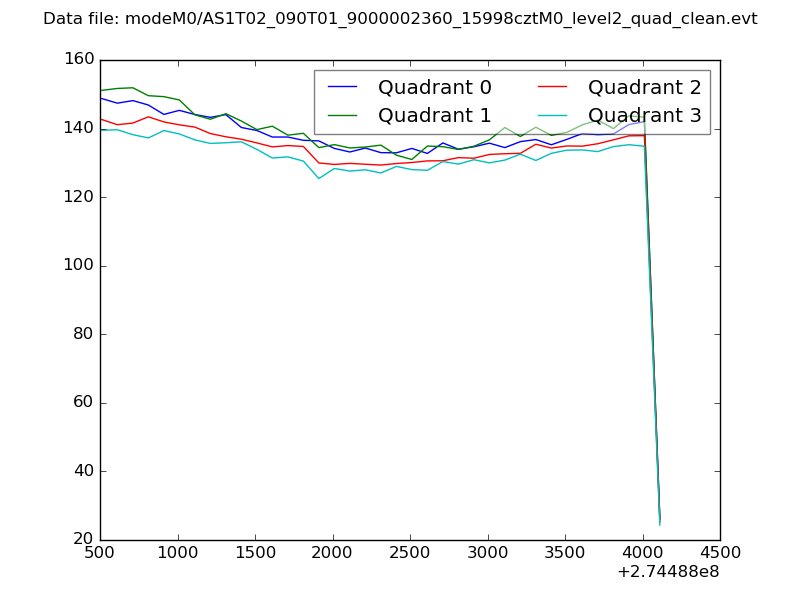 |
|
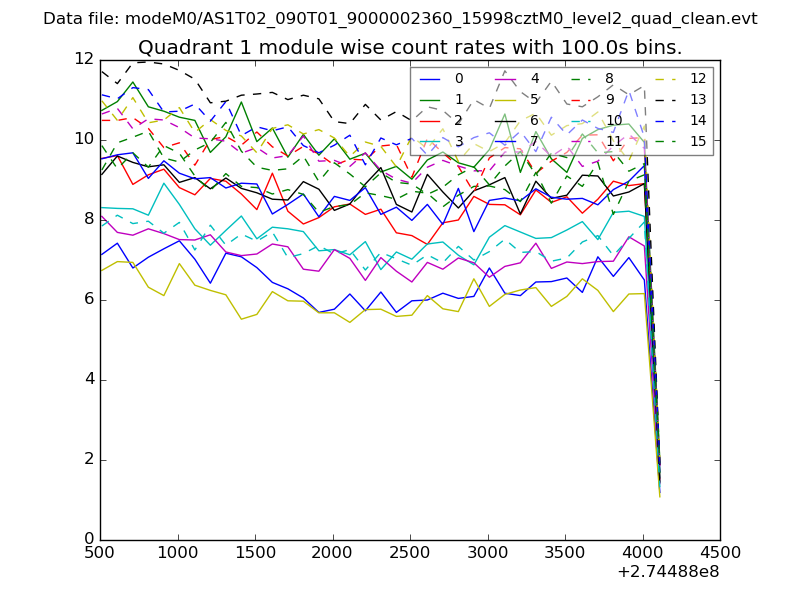
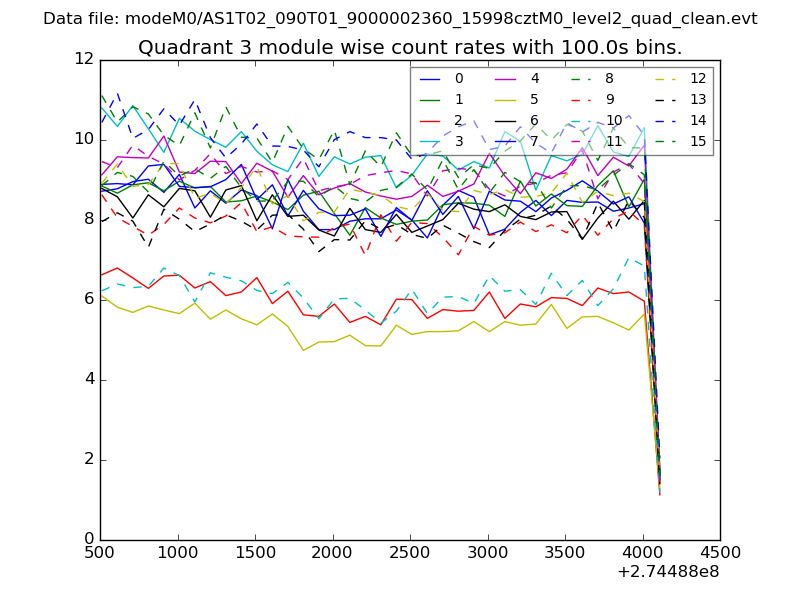
| Module-wise count rates for Quadrant A Data is divided into 100 sec bins |
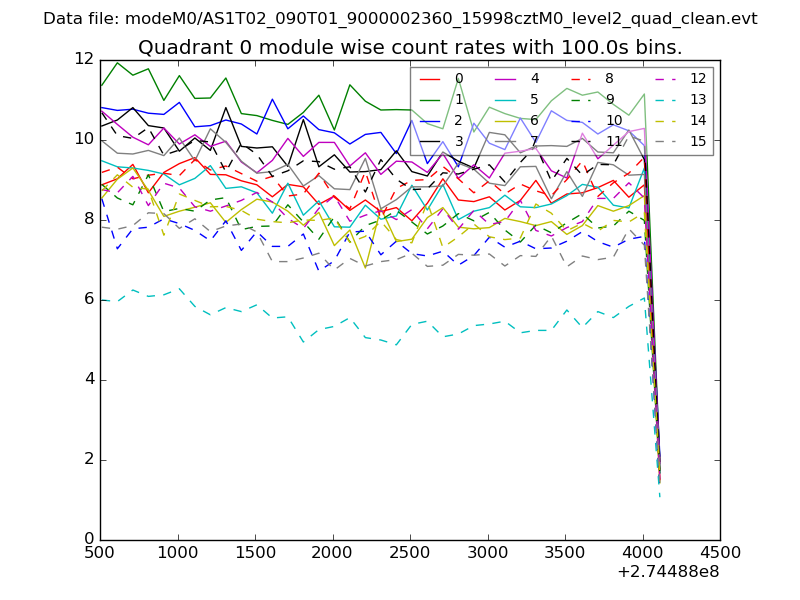 |
 |
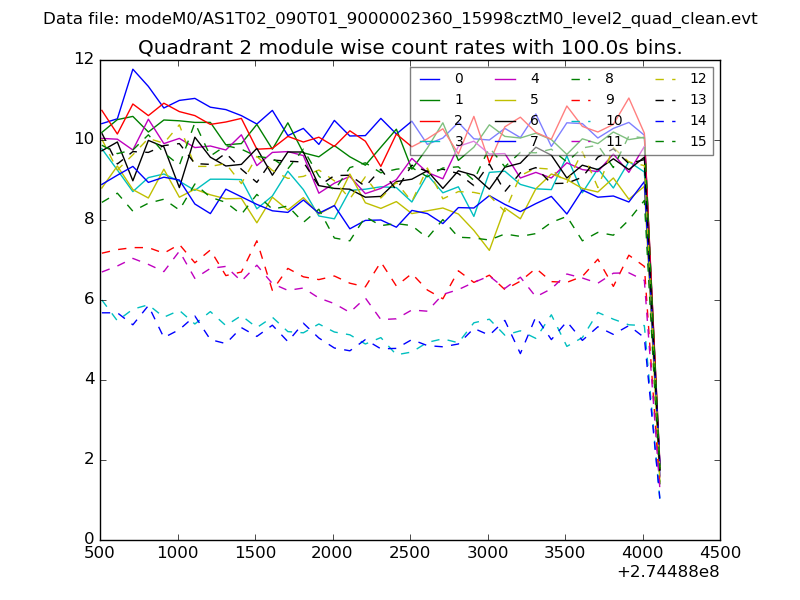
| Module-wise count rates for Quadrant B Data is divided into 100 sec bins |
 |
 |
| Module-wise count rates for Quadrant C Data is divided into 100 sec bins |
 |
 |
| Module-wise count rates for Quadrant D Data is divided into 100 sec bins |
 |
 |
| Parameter | Plot |
|---|---|
| CZT HV Monitor | 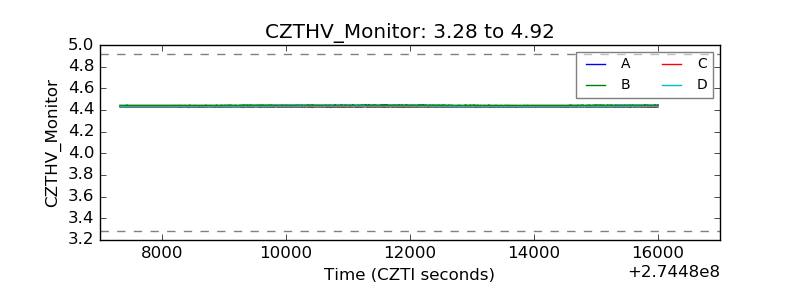 |
| D_VDD | 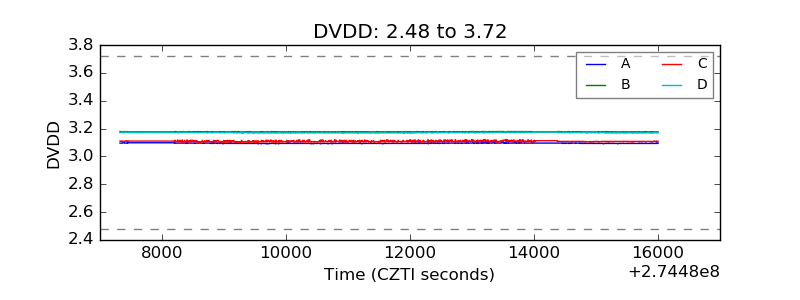 |
| Temperature 1 | 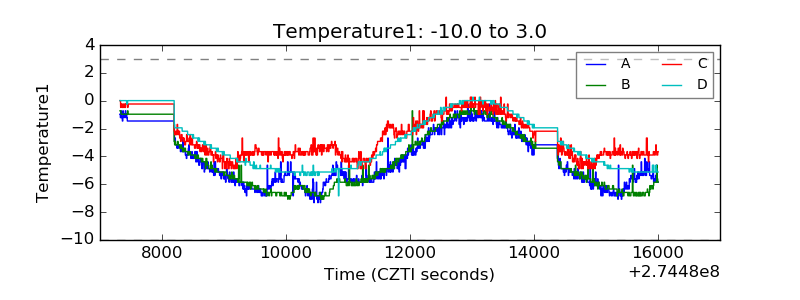 |
| Veto HV Monitor | 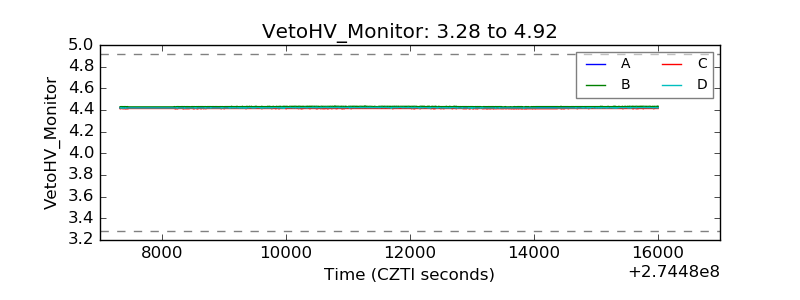 |
| Veto LLD | 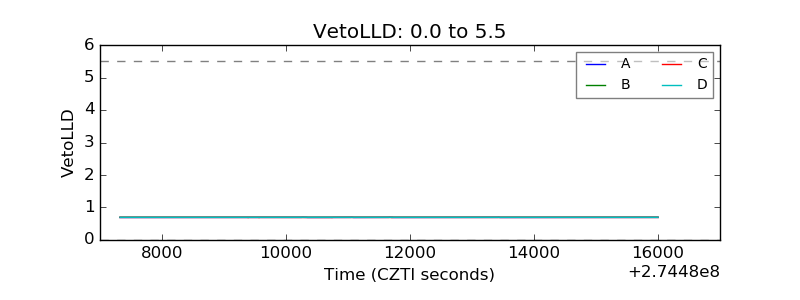 |
| Alpha Counter |  |
| _CPM_Rate | 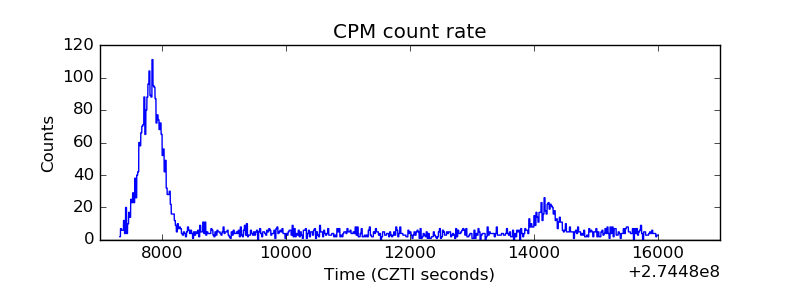 |
| CZT Counter |  |
| +2.5 Volts monitor | 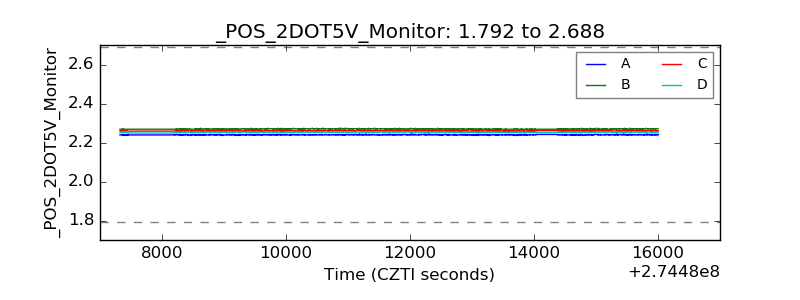 |
| +5 Volts monitor |  |
| _ROLL_ROT | 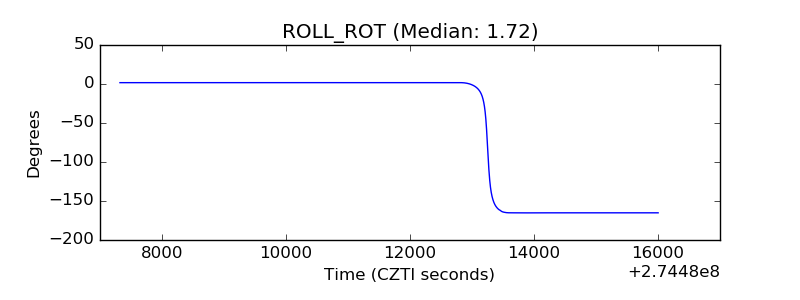 |
| _Roll_DEC | 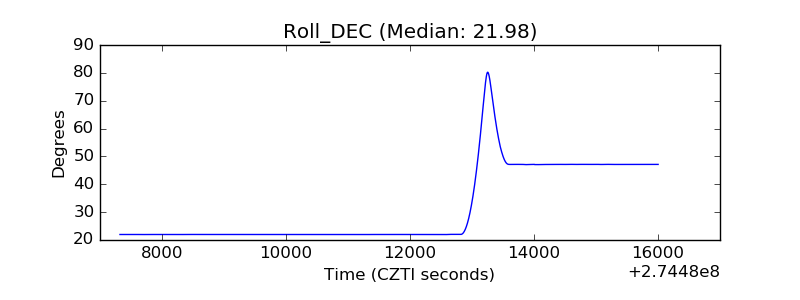 |
| _Roll_RA | 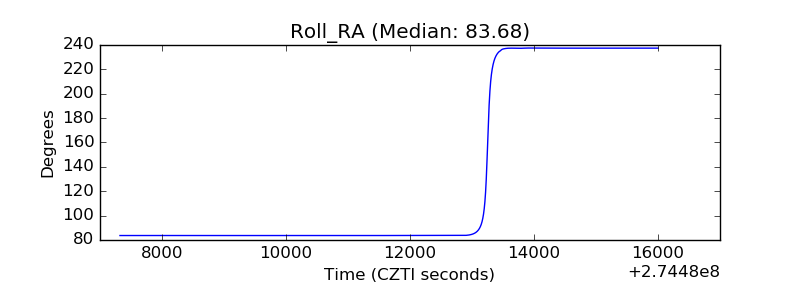 |
| Veto Counter | 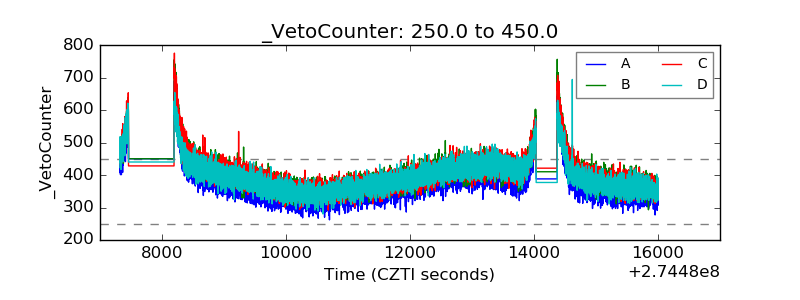 |