| Param | Original file | Final file |
|---|---|---|
| Filename | modeM0/AS1T02_090T01_9000002360_16000cztM0_level2.evt | modeM0/AS1T02_090T01_9000002360_16000cztM0_level2_quad_clean.evt |
| Size (bytes) | 608,443,200 | 101,108,160 |
| Size | 580.3 MB | 96.4 MB |
| Events in quadrant A | 5,189,730 | 615,958 |
| Events in quadrant B | 4,285,684 | 632,631 |
| Events in quadrant C | 4,122,533 | 610,967 |
| Events in quadrant D | 4,248,290 | 607,960 |
| Mode M0 | |||
|---|---|---|---|
| Quadrant | BADHDUFLAG | Total packets | Discarded packets |
| A | 0 | 21166 | 3 |
| B | 0 | 18250 | 2 |
| C | 0 | 17702 | 2 |
| D | 0 | 18605 | 2 |
| Mode SS | |||
|---|---|---|---|
| Quadrant | BADHDUFLAG | Total packets | Discarded packets |
| A | 0 | 174 | 0 |
| B | 0 | 174 | 0 |
| C | 0 | 174 | 0 |
| D | 0 | 174 | 0 |
| Mode M9 | |||
|---|---|---|---|
| Quadrant | BADHDUFLAG | Total packets | Discarded packets |
| A | 0 | 7 | 0 |
| B | 0 | 7 | 0 |
| C | 0 | 7 | 0 |
| D | 0 | 7 | 0 |
| Quadrant | Total seconds | Saturated seconds | Saturation percentage |
|---|---|---|---|
| A | 8561 | 340 | 3.971499% |
| B | 8561 | 190 | 2.219367% |
| C | 8561 | 196 | 2.289452% |
| D | 8561 | 133 | 1.553557% |
Noise dominated data is calculated using 1-second bins in cleaned event files. If a bin has >2000 counts, and if more than 50% of those come from <1% of pixels, then it is considered to be noise-dominated and hence unusable.
| Quadrant | # 1 sec bins | Bins with >0 counts | Bins with >2000 counts | High rate bins dominated by noise | Noise dominated (total time) | Noise dominated (detector-on time) | Marked lightcurve |
|---|---|---|---|---|---|---|---|
| A | 9177 | 8563 | 145 | 145 | 1.58% | 1.69% | 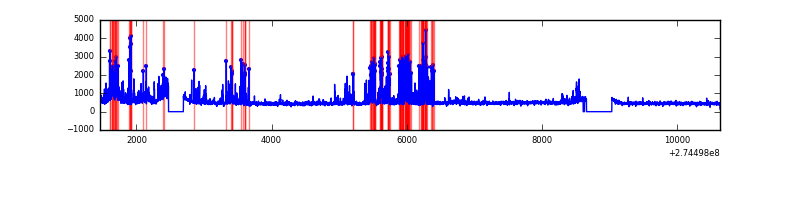 |
| B | 9177 | 8563 | 13 | 13 | 0.14% | 0.15% | 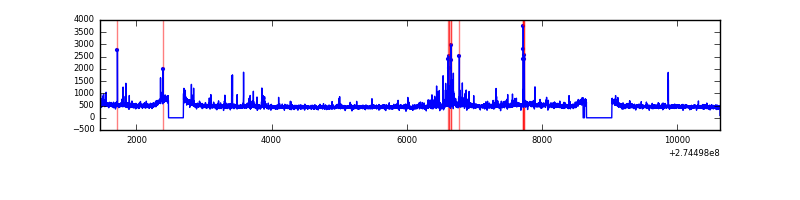 |
| C | 9177 | 8563 | 0 | 0 | 0.00% | 0.00% |  |
| D | 9177 | 8563 | 43 | 43 | 0.47% | 0.50% | 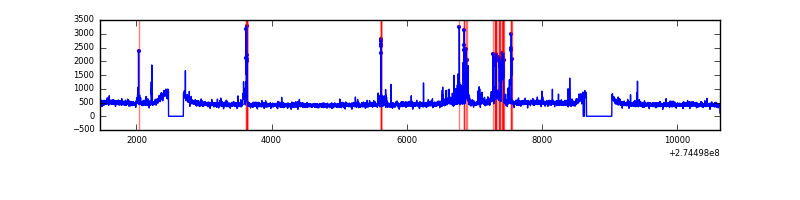 |
Top three noisy pixels from each quadrant. If the there are fewer than three noisy pixels in the level2.evt file, extra rows are filled as -1
| Pixel properties | Quadrant properties | ||||||
|---|---|---|---|---|---|---|---|
| Quadrant | DetID | PixID | Counts | Sigma | Mean | Median | Sigma |
| A | 10 | 253 | 1124599 | 5480.54 | 1011 | 988 | 205.0 |
| A | 13 | 210 | 138984 | 673.09 | 1011 | 988 | 205.0 |
| A | 15 | 157 | 26281 | 123.37 | 1011 | 988 | 205.0 |
| B | 7 | 220 | 113191 | 564.17 | 1029 | 1001 | 198.9 |
| B | 4 | 173 | 30335 | 147.51 | 1029 | 1001 | 198.9 |
| B | 3 | 209 | 29339 | 142.5 | 1029 | 1001 | 198.9 |
| C | 14 | 238 | 153982 | 656.79 | 991 | 994 | 232.9 |
| C | 3 | 233 | 79978 | 339.08 | 991 | 994 | 232.9 |
| C | 8 | 128 | 10207 | 39.55 | 991 | 994 | 232.9 |
| D | 7 | 38 | 224640 | 907.1 | 1006 | 973 | 246.6 |
| D | 9 | 85 | 73557 | 294.37 | 1006 | 973 | 246.6 |
| D | 2 | 152 | 70477 | 281.88 | 1006 | 973 | 246.6 |
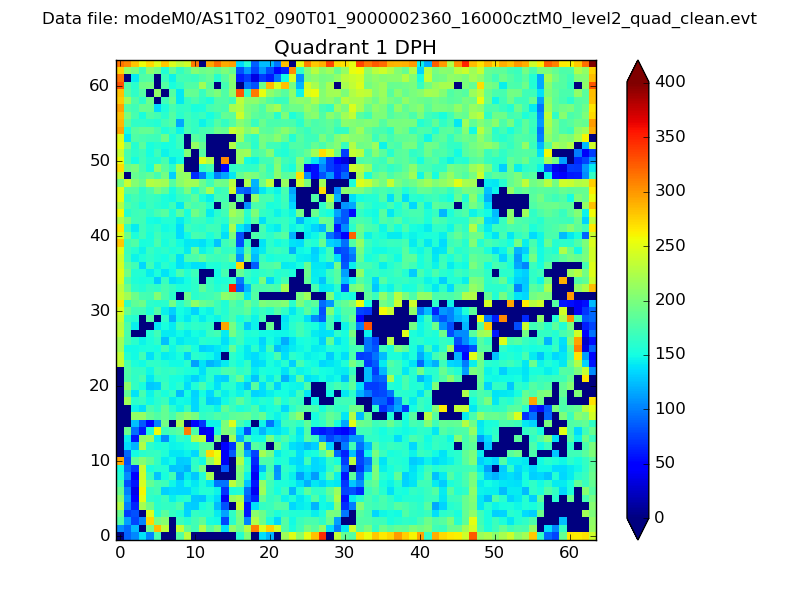
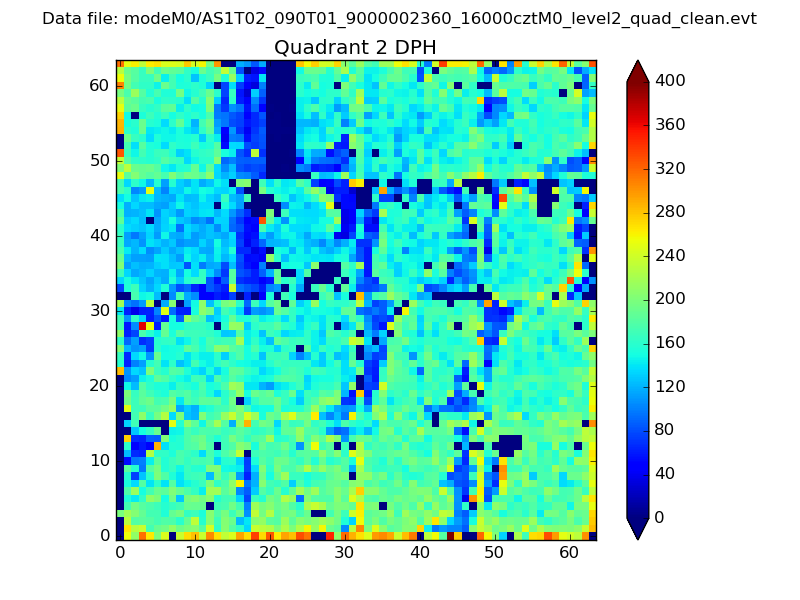
Histogram calculated using DETX and DETY for each event in the final _common_clean file
| Quadrant A | 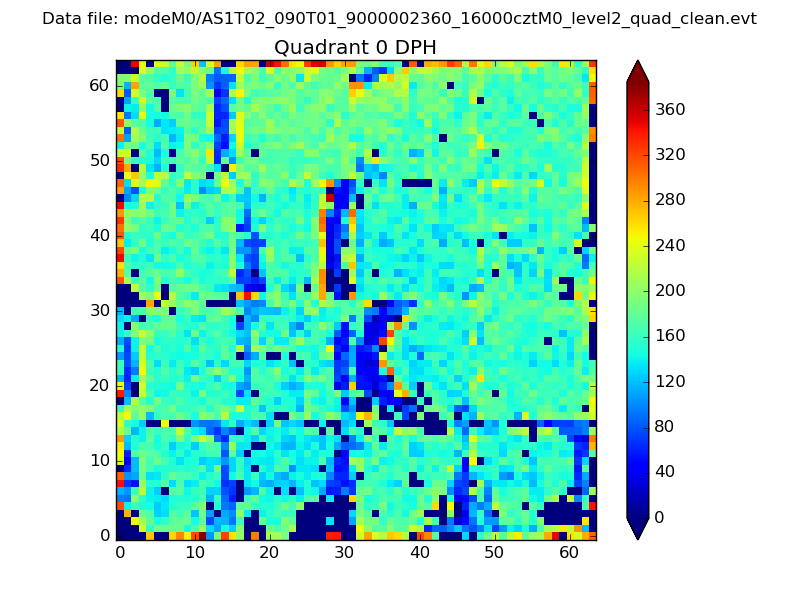 |
 |
Quadrant B |
|---|---|---|---|
| Quadrant D | 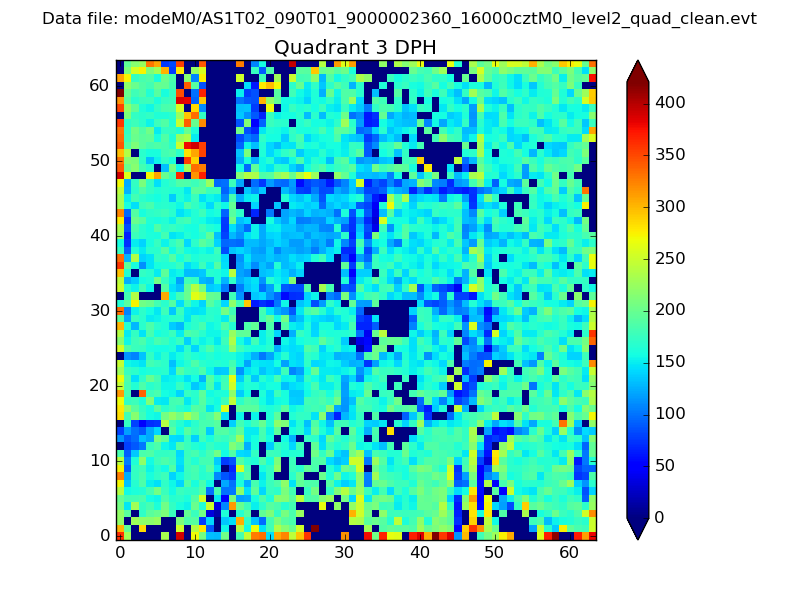 |
 |
Quadrant C |
| Plot type | Count rate plots | Images |
|---|---|---|
| Comparison with Poisson distribution Blue bars denote a histogram of data divided into 1 sec bins. Red curve is a Poisson curve with rate = median count rate of data. |
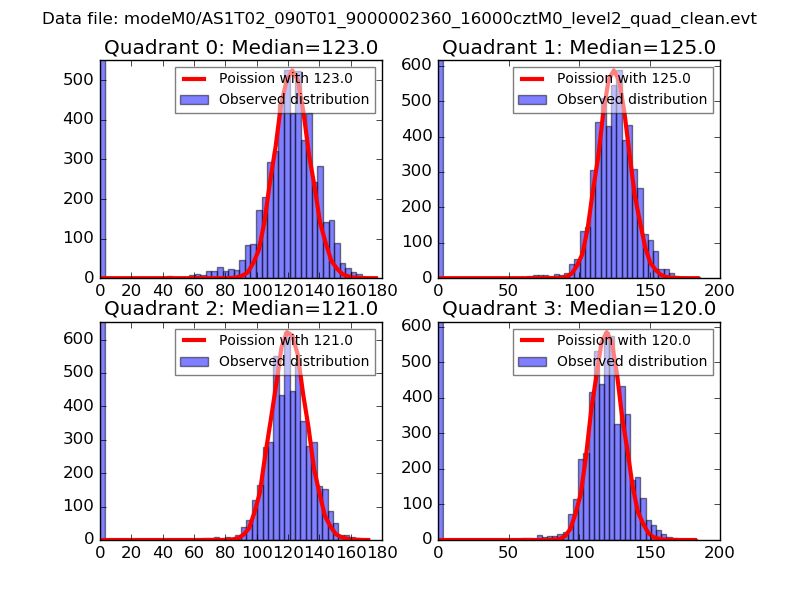 |
 |
| Quadrant-wise count rates Data is divided into 100 sec bins |
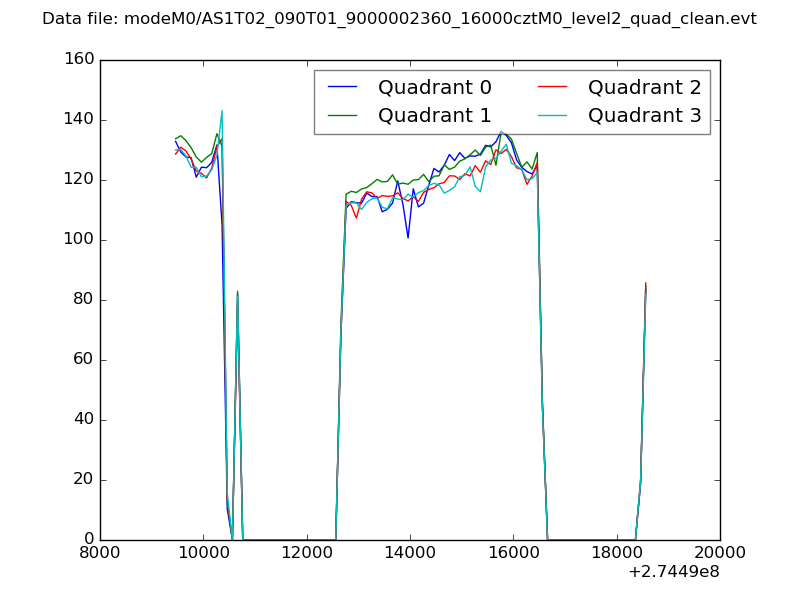 |
|
| Module-wise count rates for Quadrant A Data is divided into 100 sec bins |
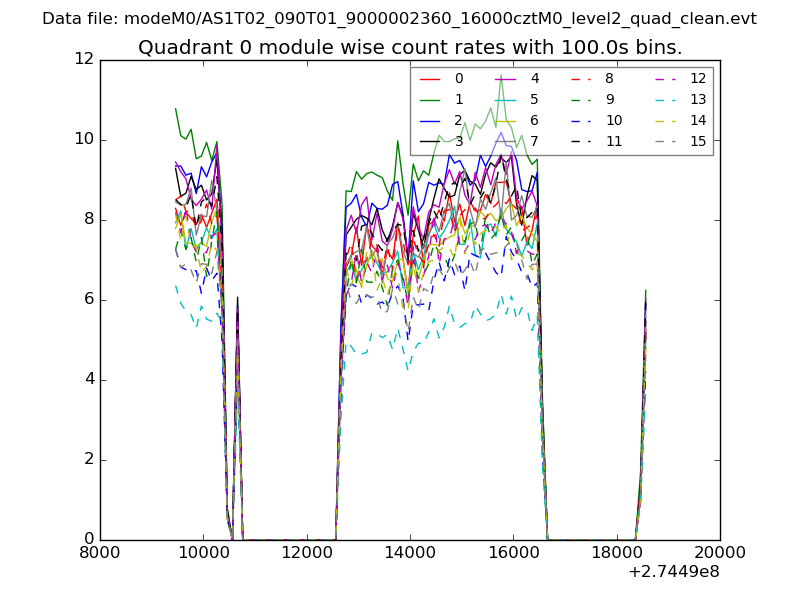 |
 |
| Module-wise count rates for Quadrant B Data is divided into 100 sec bins |
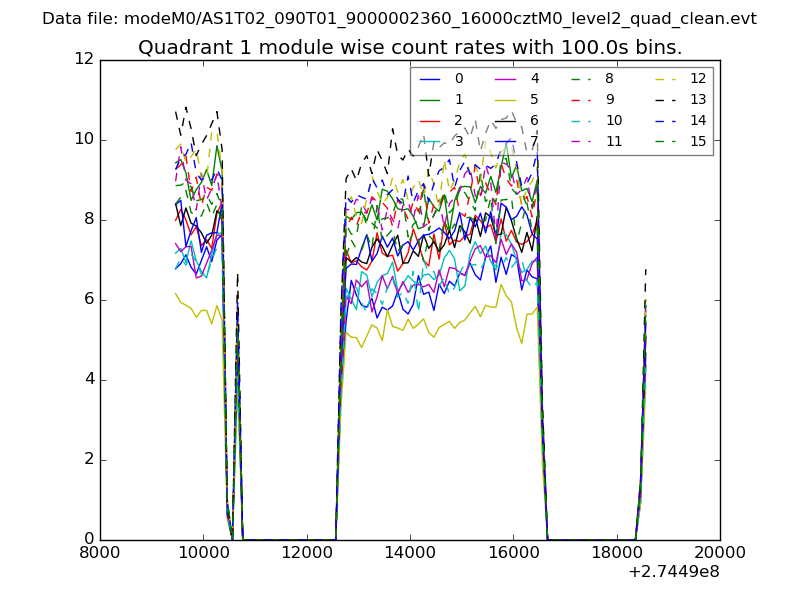 |
 |
| Module-wise count rates for Quadrant C Data is divided into 100 sec bins |
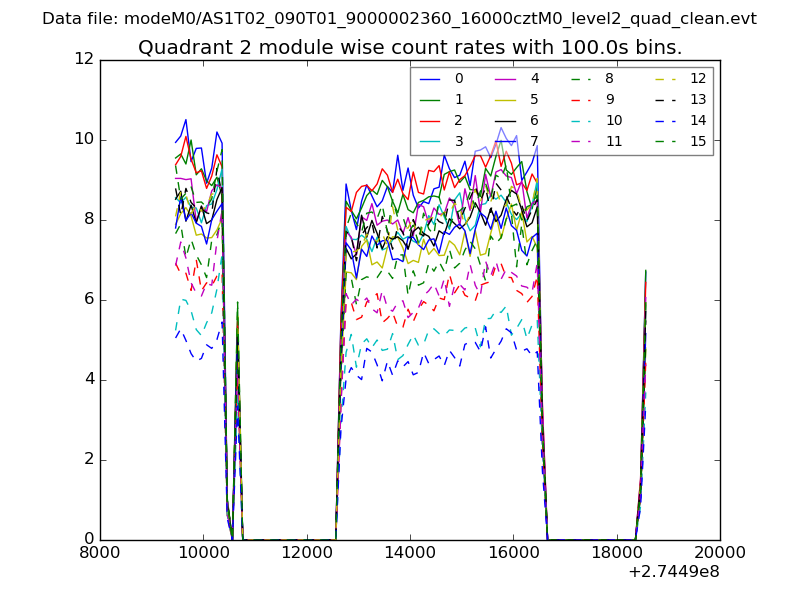 |
 |
| Module-wise count rates for Quadrant D Data is divided into 100 sec bins |
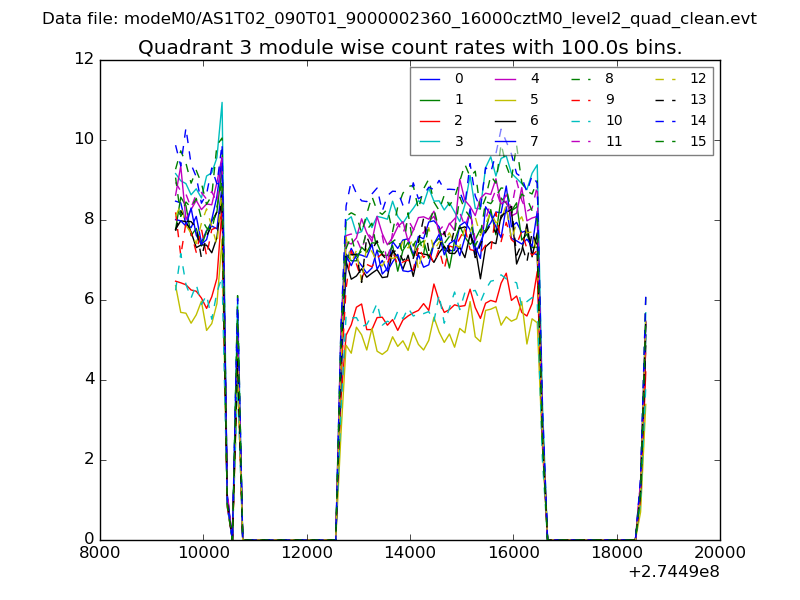 |
 |
| Parameter | Plot |
|---|---|
| CZT HV Monitor | 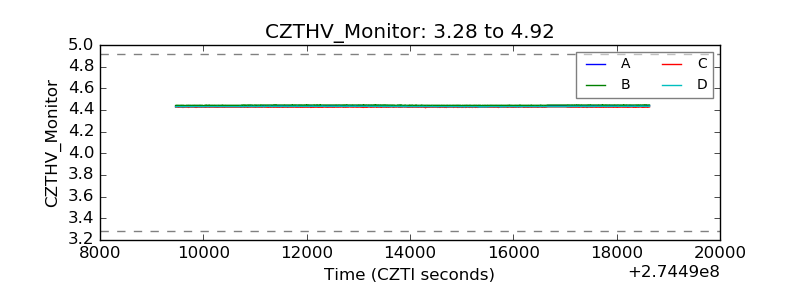 |
| D_VDD | 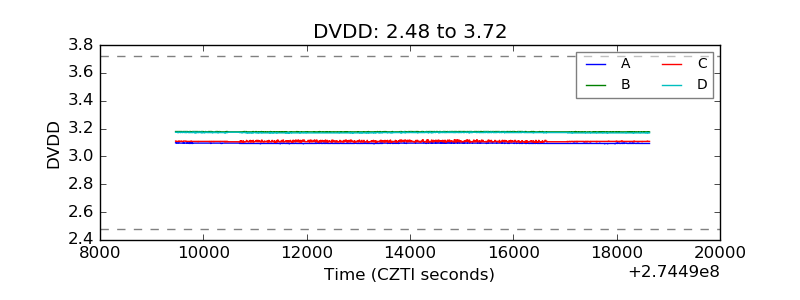 |
| Temperature 1 | 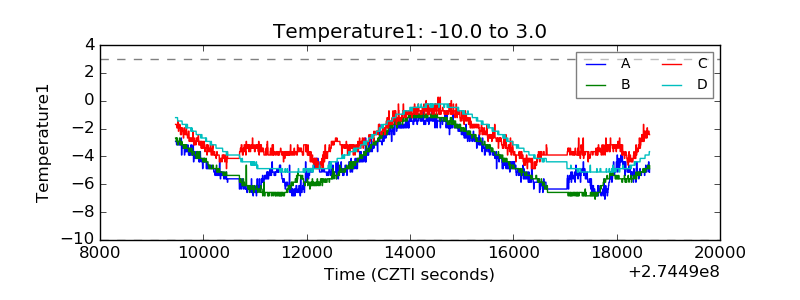 |
| Veto HV Monitor | 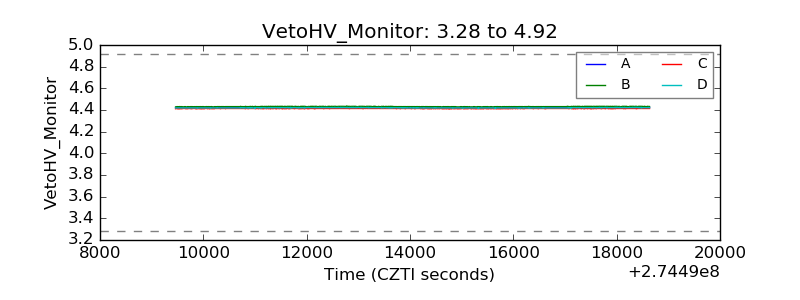 |
| Veto LLD |  |
| Alpha Counter | 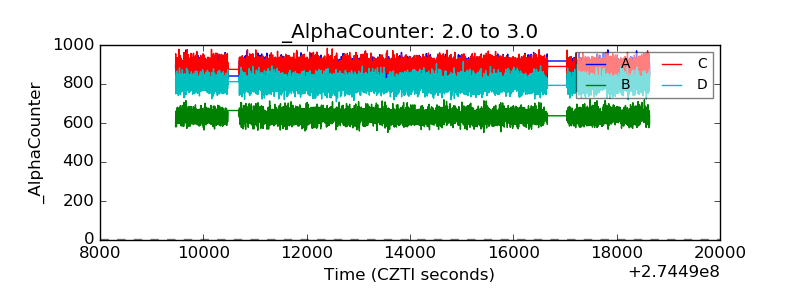 |
| _CPM_Rate | 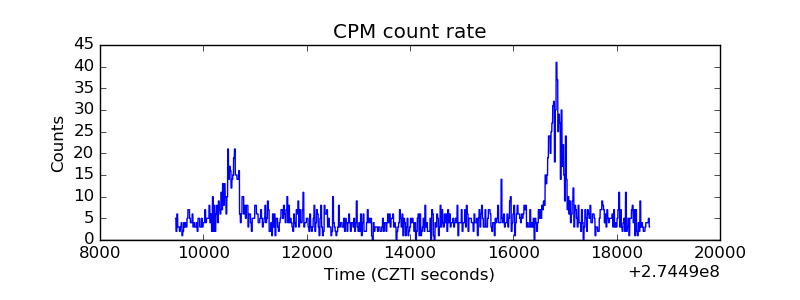 |
| CZT Counter | 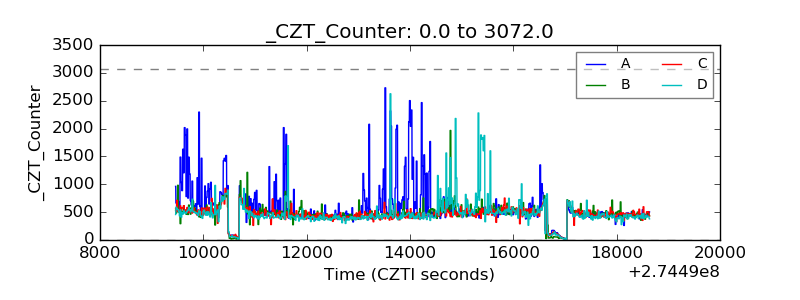 |
| +2.5 Volts monitor |  |
| +5 Volts monitor |  |
| _ROLL_ROT | 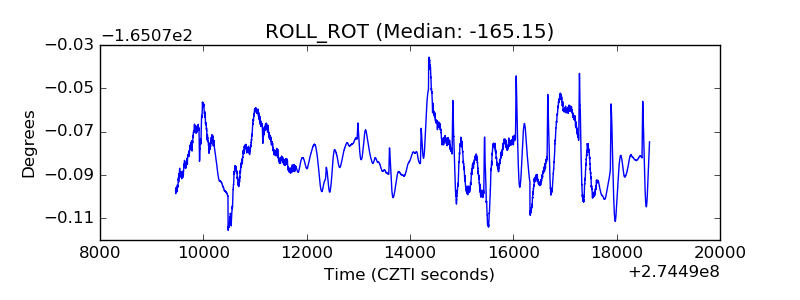 |
| _Roll_DEC | 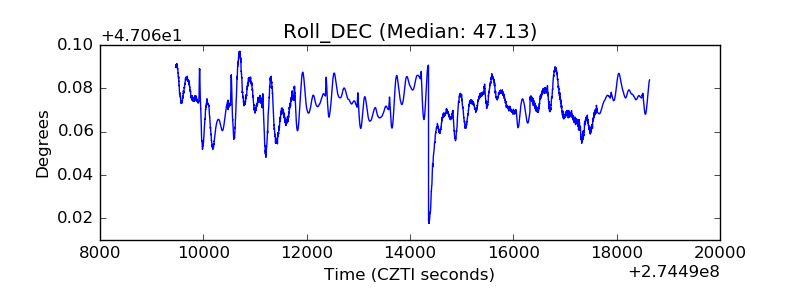 |
| _Roll_RA | 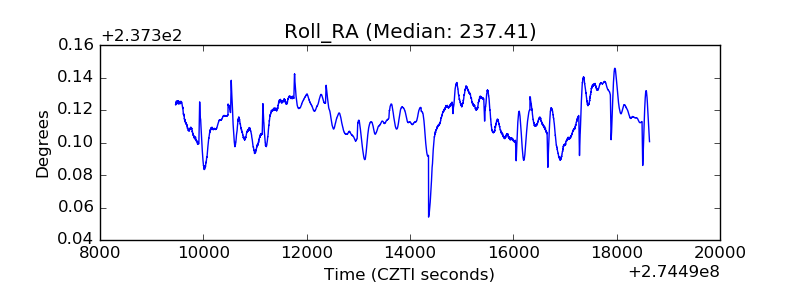 |
| Veto Counter | 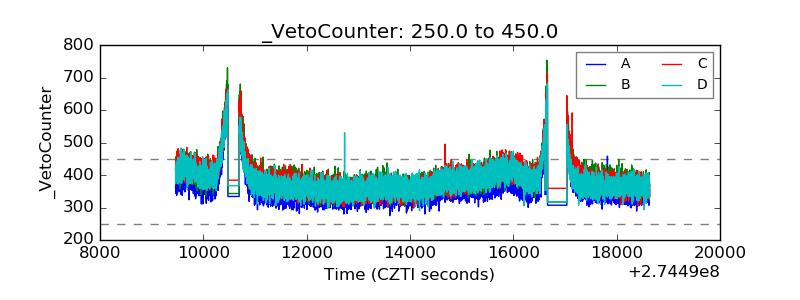 |