| Param | Original file | Final file |
|---|---|---|
| Filename | modeM0/AS1T02_090T01_9000002360_16009cztM0_level2.evt | modeM0/AS1T02_090T01_9000002360_16009cztM0_level2_quad_clean.evt |
| Size (bytes) | 497,589,120 | 78,756,480 |
| Size | 474.5 MB | 75.1 MB |
| Events in quadrant A | 3,582,921 | 494,574 |
| Events in quadrant B | 3,866,906 | 498,019 |
| Events in quadrant C | 3,625,416 | 484,237 |
| Events in quadrant D | 3,571,887 | 473,583 |
| Mode M0 | |||
|---|---|---|---|
| Quadrant | BADHDUFLAG | Total packets | Discarded packets |
| A | 0 | 14537 | 3 |
| B | 0 | 15624 | 2 |
| C | 0 | 14857 | 2 |
| D | 0 | 14610 | 2 |
| Mode SS | |||
|---|---|---|---|
| Quadrant | BADHDUFLAG | Total packets | Discarded packets |
| A | 0 | 126 | 0 |
| B | 0 | 126 | 0 |
| C | 0 | 126 | 0 |
| D | 0 | 126 | 0 |
| Mode M9 | |||
|---|---|---|---|
| Quadrant | BADHDUFLAG | Total packets | Discarded packets |
| A | 0 | 20 | 0 |
| B | 0 | 20 | 0 |
| C | 0 | 20 | 0 |
| D | 0 | 21 | 0 |
| Quadrant | Total seconds | Saturated seconds | Saturation percentage |
|---|---|---|---|
| A | 6226 | 120 | 1.927401% |
| B | 6226 | 181 | 2.907164% |
| C | 6226 | 148 | 2.377128% |
| D | 6226 | 132 | 2.120141% |
Noise dominated data is calculated using 1-second bins in cleaned event files. If a bin has >2000 counts, and if more than 50% of those come from <1% of pixels, then it is considered to be noise-dominated and hence unusable.
| Quadrant | # 1 sec bins | Bins with >0 counts | Bins with >2000 counts | High rate bins dominated by noise | Noise dominated (total time) | Noise dominated (detector-on time) | Marked lightcurve |
|---|---|---|---|---|---|---|---|
| A | 7562 | 6227 | 1 | 1 | 0.01% | 0.02% | 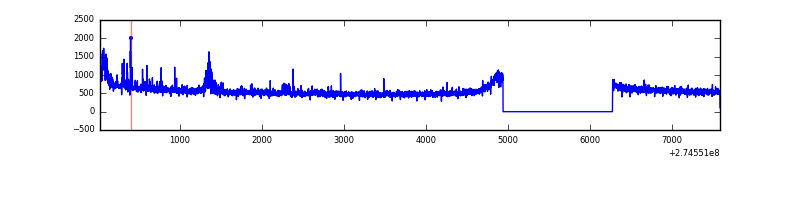 |
| B | 7562 | 6227 | 54 | 54 | 0.71% | 0.87% | 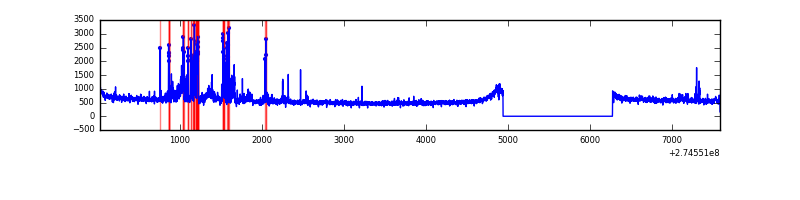 |
| C | 7562 | 6227 | 0 | 0 | 0.00% | 0.00% | 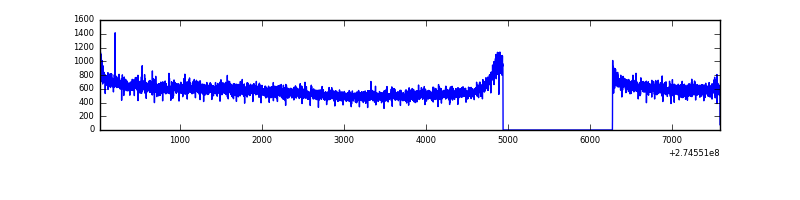 |
| D | 7562 | 6227 | 38 | 38 | 0.50% | 0.61% | 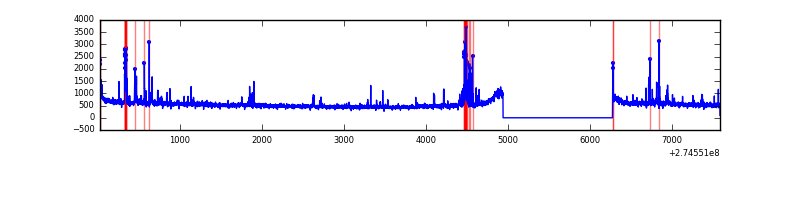 |
Top three noisy pixels from each quadrant. If the there are fewer than three noisy pixels in the level2.evt file, extra rows are filled as -1
| Pixel properties | Quadrant properties | ||||||
|---|---|---|---|---|---|---|---|
| Quadrant | DetID | PixID | Counts | Sigma | Mean | Median | Sigma |
| A | 14 | 235 | 113584 | 636.88 | 880 | 865 | 177.0 |
| A | 15 | 157 | 63555 | 354.21 | 880 | 865 | 177.0 |
| A | 13 | 210 | 18972 | 102.31 | 880 | 865 | 177.0 |
| B | 5 | 65 | 145716 | 886.52 | 876 | 859 | 163.4 |
| B | 7 | 220 | 130654 | 794.34 | 876 | 859 | 163.4 |
| B | 4 | 216 | 47090 | 282.93 | 876 | 859 | 163.4 |
| C | 3 | 233 | 169598 | 855.82 | 852 | 862 | 197.2 |
| C | 14 | 238 | 131480 | 662.48 | 852 | 862 | 197.2 |
| C | 13 | 61 | 6180 | 26.97 | 852 | 862 | 197.2 |
| D | 12 | 218 | 223633 | 1057.72 | 865 | 843 | 210.6 |
| D | 2 | 234 | 25306 | 116.14 | 865 | 843 | 210.6 |
| D | 2 | 152 | 21676 | 98.91 | 865 | 843 | 210.6 |
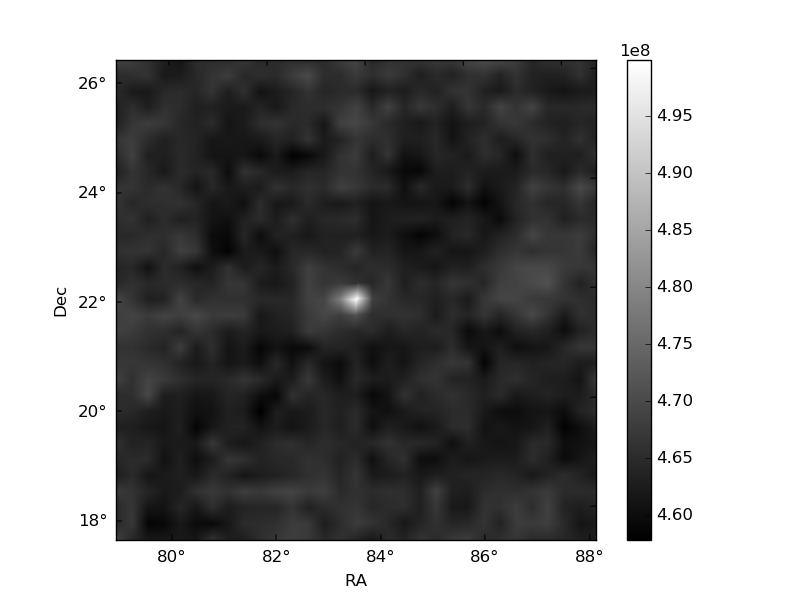
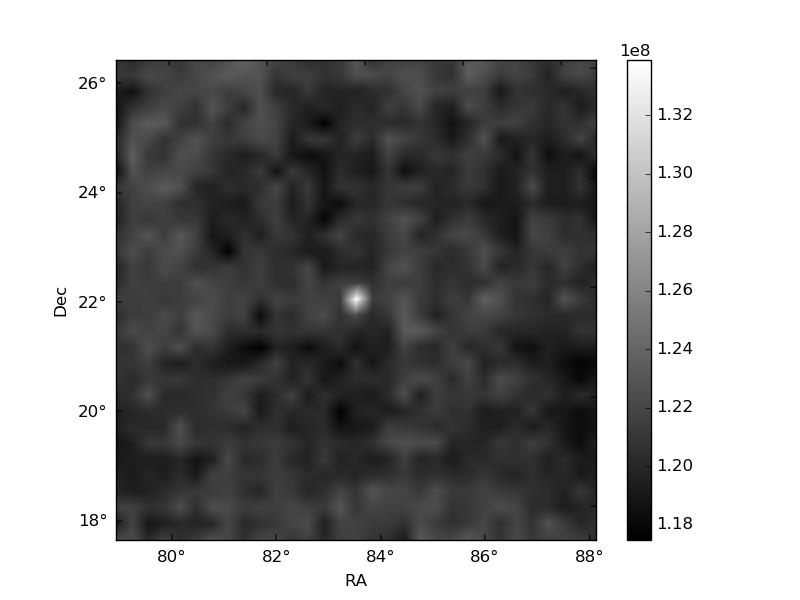
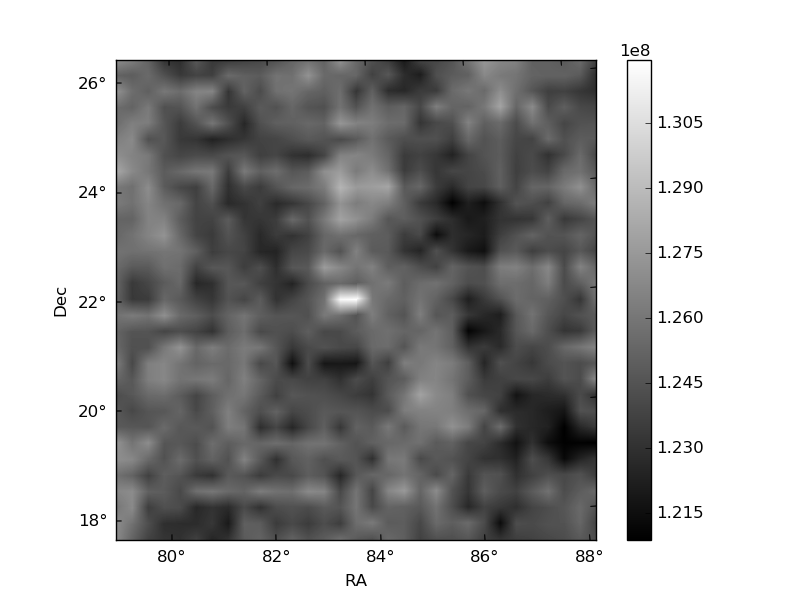
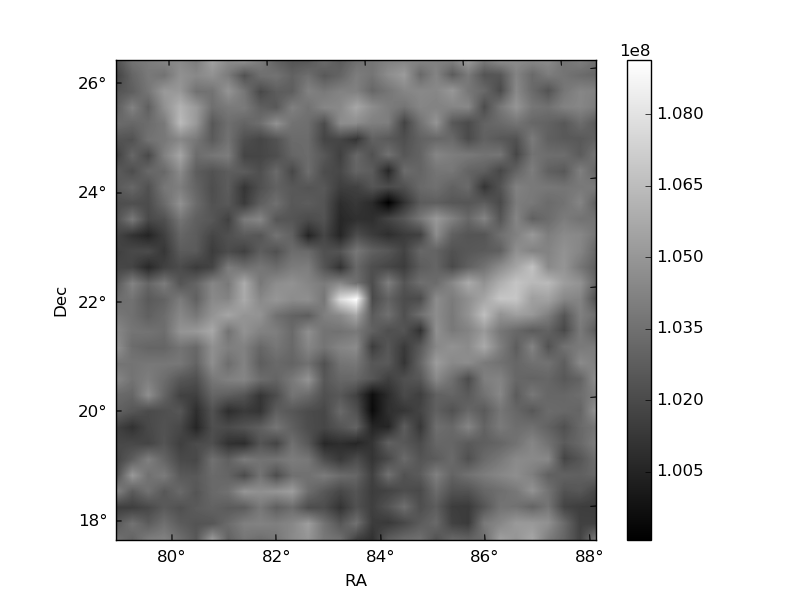
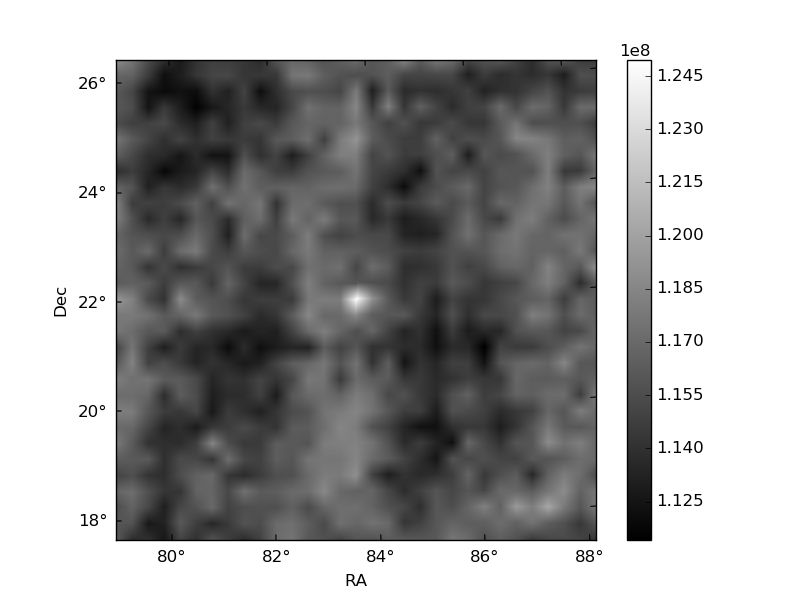
Histogram calculated using DETX and DETY for each event in the final _common_clean file
| Quadrant A | 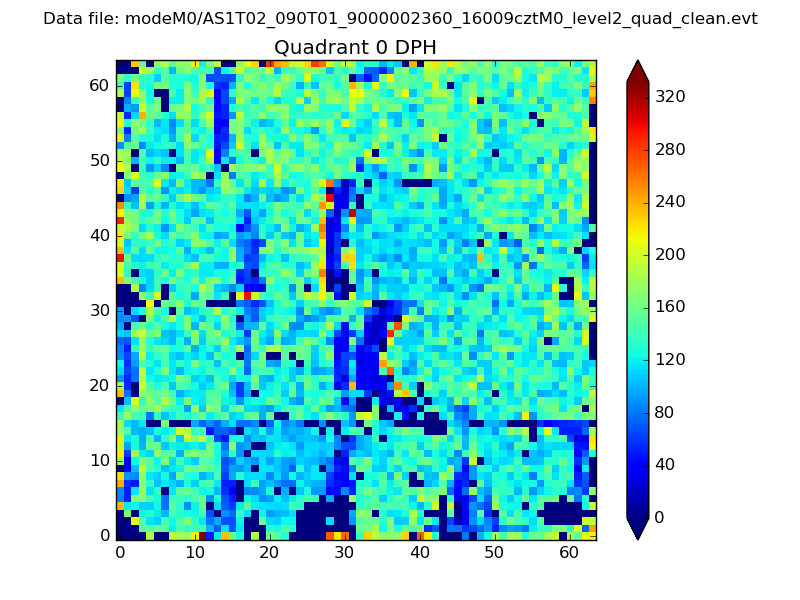 |
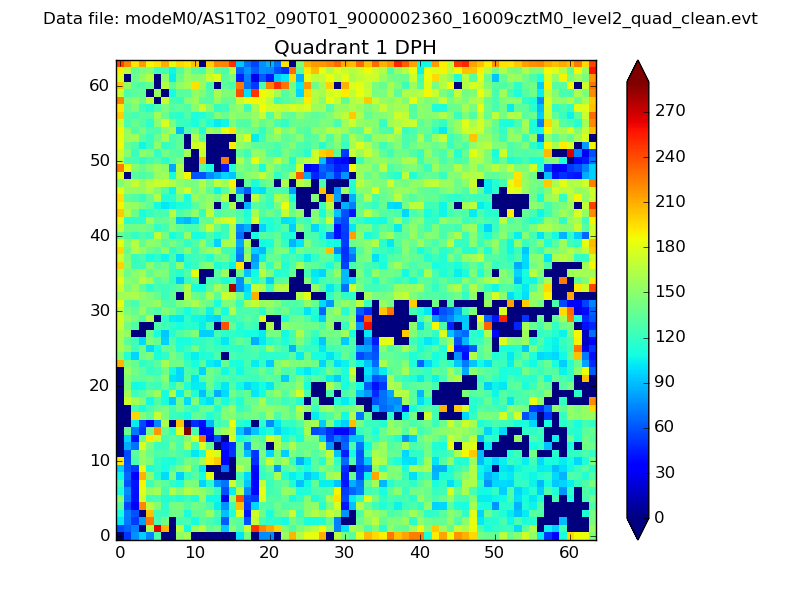 |
Quadrant B |
|---|---|---|---|
| Quadrant D | 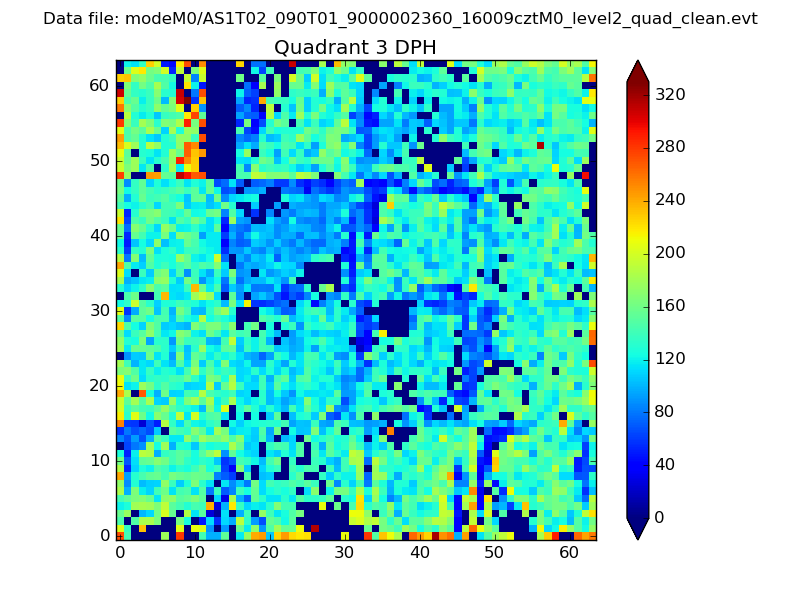 |
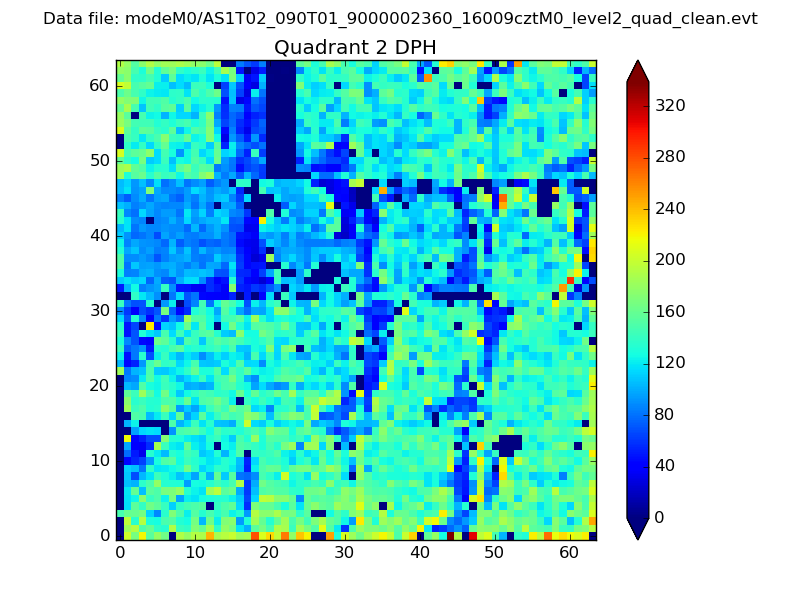 |
Quadrant C |
| Plot type | Count rate plots | Images |
|---|---|---|
| Comparison with Poisson distribution Blue bars denote a histogram of data divided into 1 sec bins. Red curve is a Poisson curve with rate = median count rate of data. |
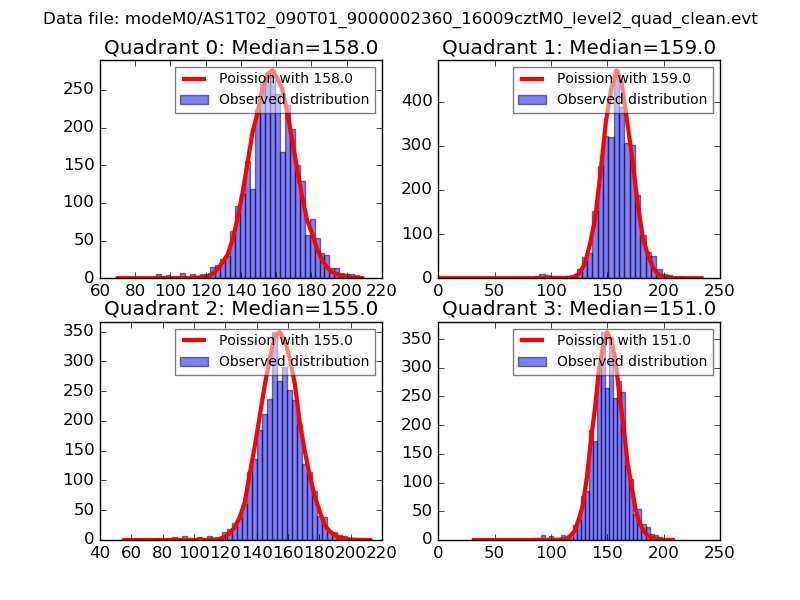 |
 |
| Quadrant-wise count rates Data is divided into 100 sec bins |
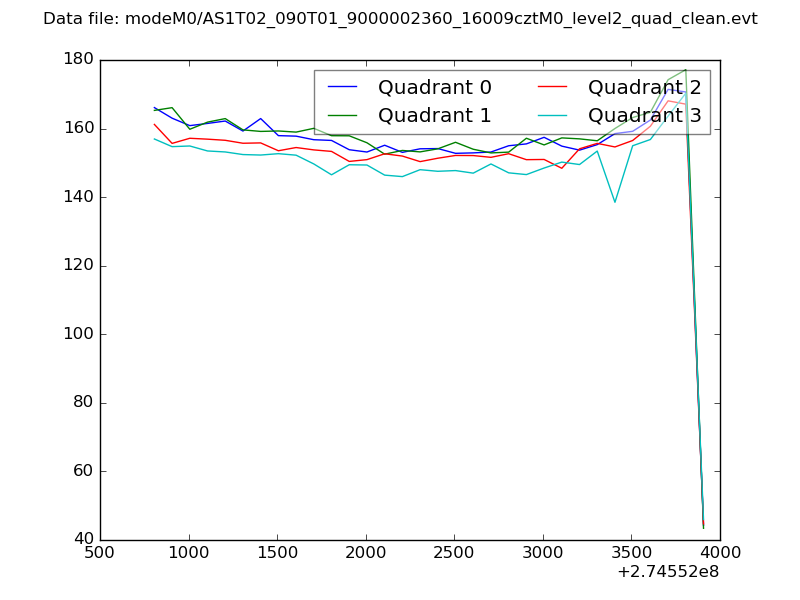 |
|
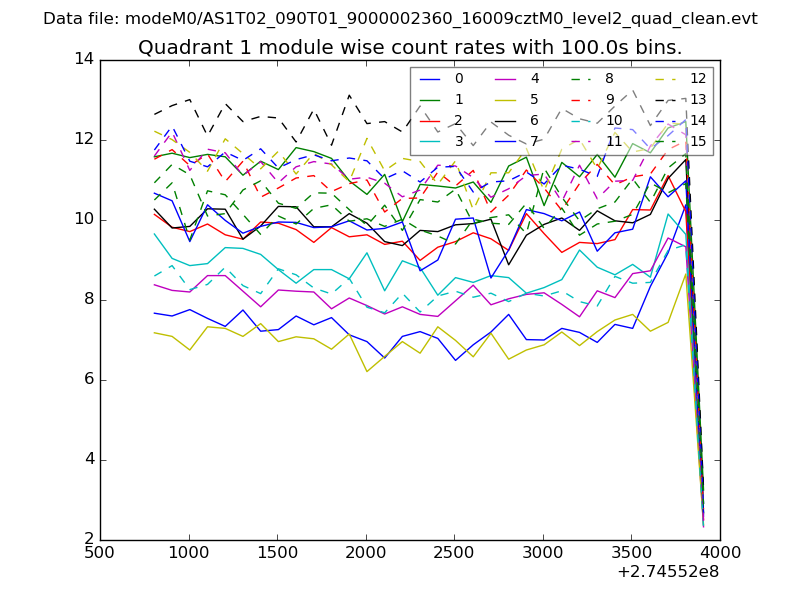
| Module-wise count rates for Quadrant A Data is divided into 100 sec bins |
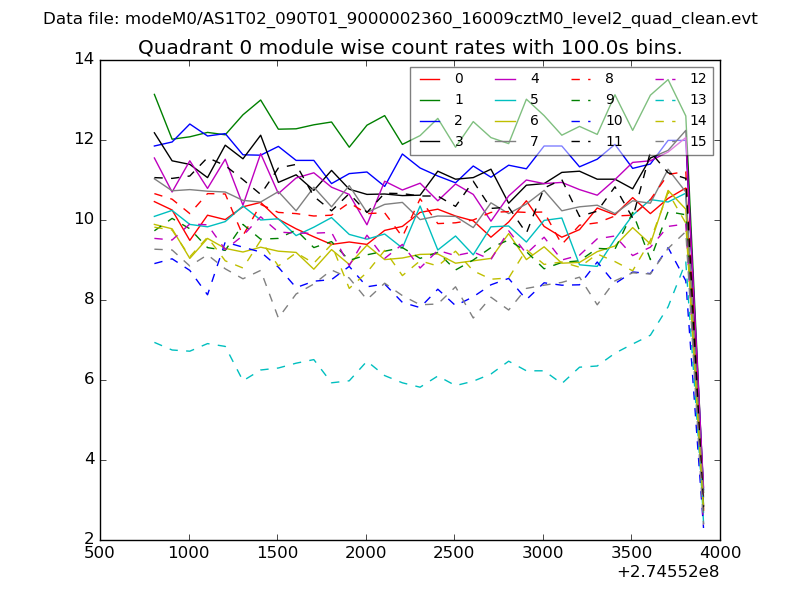 |
 |
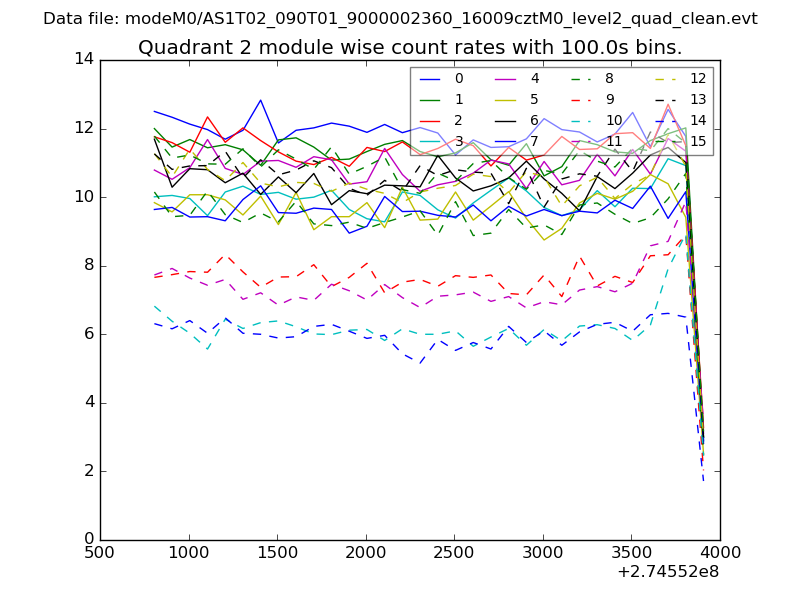
| Module-wise count rates for Quadrant B Data is divided into 100 sec bins |
 |
 |
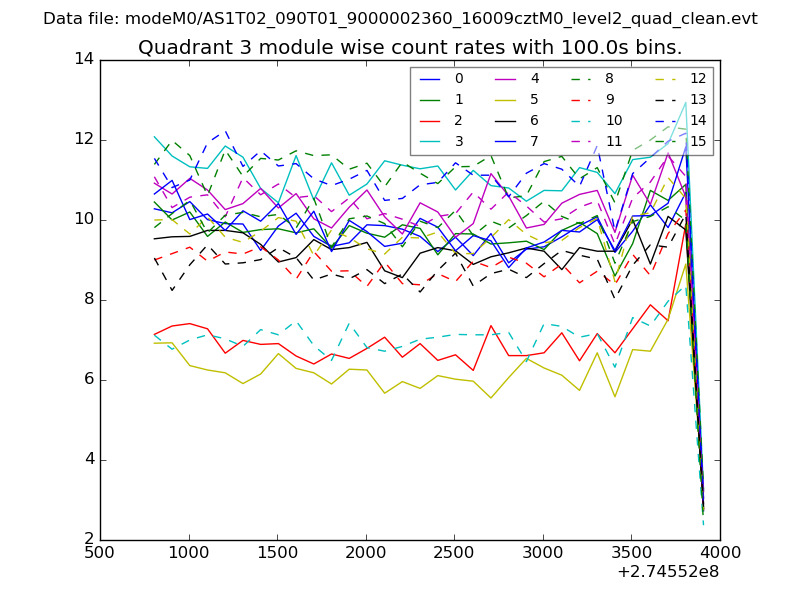
| Module-wise count rates for Quadrant C Data is divided into 100 sec bins |
 |
 |
| Module-wise count rates for Quadrant D Data is divided into 100 sec bins |
 |
 |
| Parameter | Plot |
|---|---|
| CZT HV Monitor | 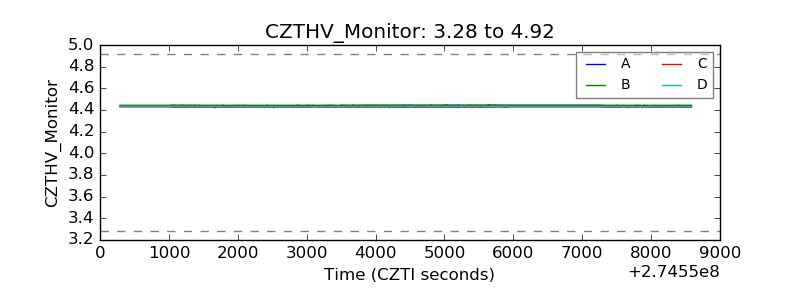 |
| D_VDD | 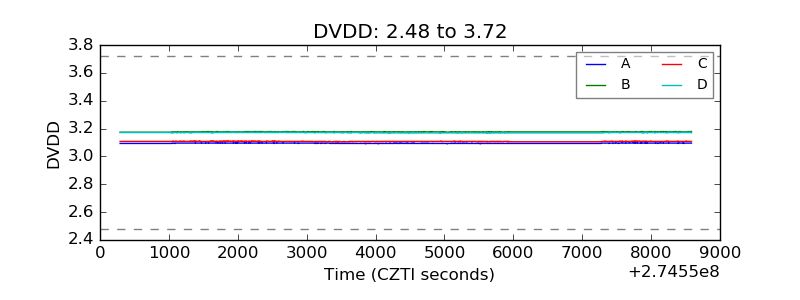 |
| Temperature 1 | 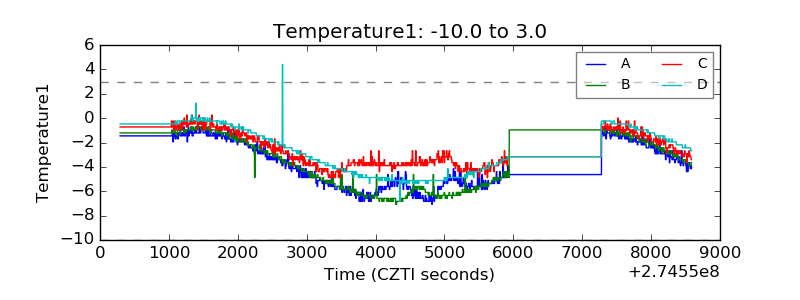 |
| Veto HV Monitor | 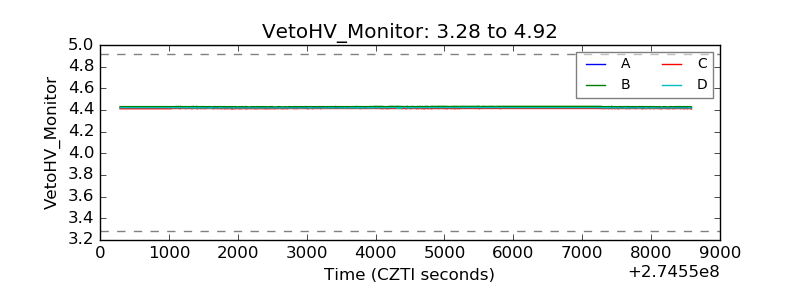 |
| Veto LLD | 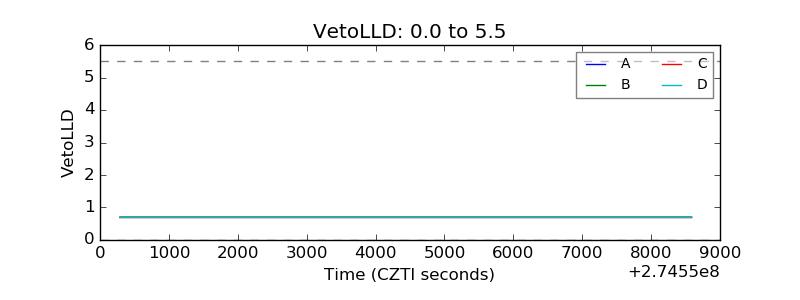 |
| Alpha Counter | 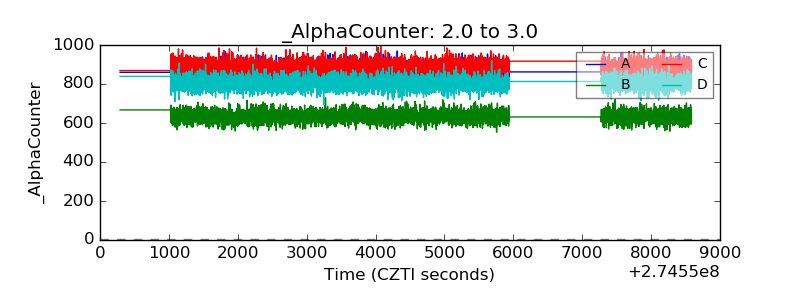 |
| _CPM_Rate | 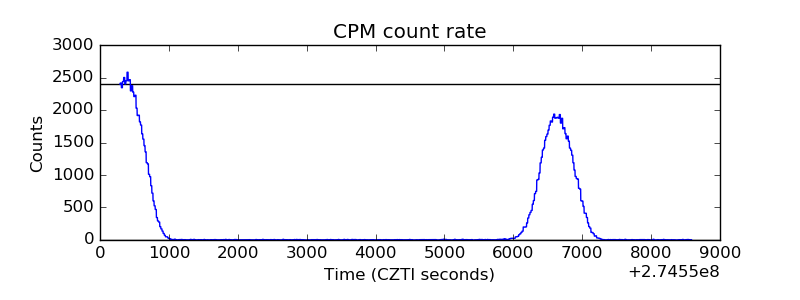 |
| CZT Counter | 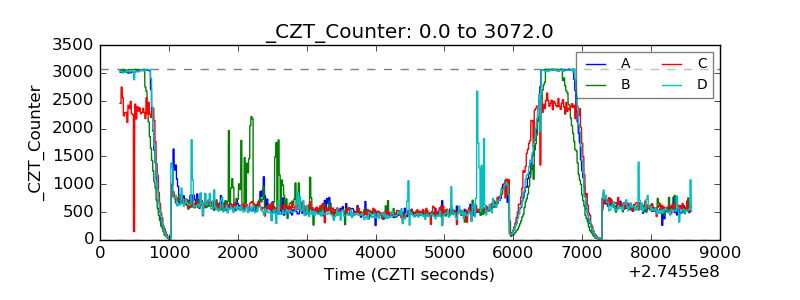 |
| +2.5 Volts monitor |  |
| +5 Volts monitor |  |
| _ROLL_ROT |  |
| _Roll_DEC | 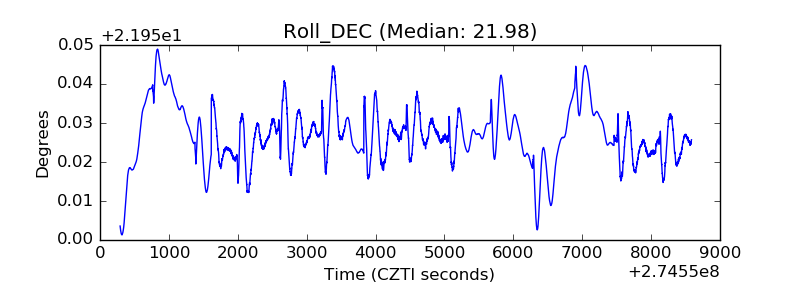 |
| _Roll_RA | 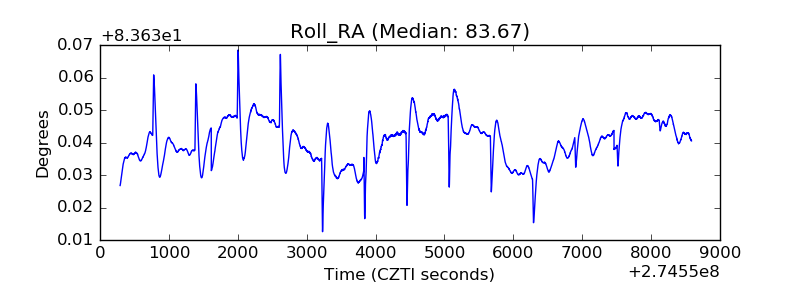 |
| Veto Counter | 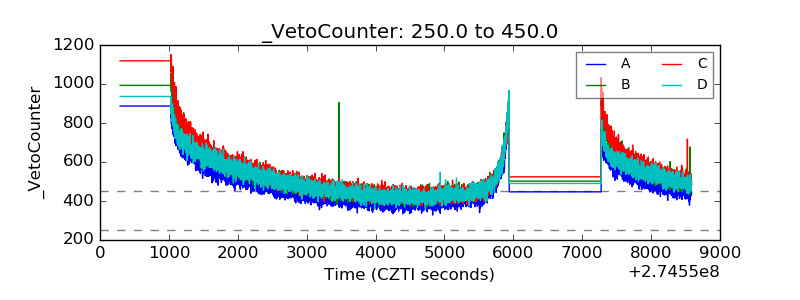 |