| Param | Original file | Final file |
|---|---|---|
| Filename | modeM0/AS1T02_090T01_9000002360_16011cztM0_level2.evt | modeM0/AS1T02_090T01_9000002360_16011cztM0_level2_quad_clean.evt |
| Size (bytes) | 133,061,760 | 21,055,680 |
| Size | 126.9 MB | 20.1 MB |
| Events in quadrant A | 931,196 | 128,807 |
| Events in quadrant B | 1,009,144 | 130,856 |
| Events in quadrant C | 957,395 | 124,936 |
| Events in quadrant D | 1,008,518 | 122,181 |
| Mode M0 | |||
|---|---|---|---|
| Quadrant | BADHDUFLAG | Total packets | Discarded packets |
| A | 0 | 3733 | 1 |
| B | 0 | 4052 | 1 |
| C | 0 | 3835 | 1 |
| D | 0 | 4061 | 1 |
| Mode SS | |||
|---|---|---|---|
| Quadrant | BADHDUFLAG | Total packets | Discarded packets |
| A | 0 | 36 | 0 |
| B | 0 | 36 | 0 |
| C | 0 | 36 | 0 |
| D | 0 | 36 | 0 |
| Quadrant | Total seconds | Saturated seconds | Saturation percentage |
|---|---|---|---|
| A | 1777 | 5 | 0.281373% |
| B | 1777 | 14 | 0.787845% |
| C | 1777 | 19 | 1.069218% |
| D | 1777 | 14 | 0.787845% |
Noise dominated data is calculated using 1-second bins in cleaned event files. If a bin has >2000 counts, and if more than 50% of those come from <1% of pixels, then it is considered to be noise-dominated and hence unusable.
| Quadrant | # 1 sec bins | Bins with >0 counts | Bins with >2000 counts | High rate bins dominated by noise | Noise dominated (total time) | Noise dominated (detector-on time) | Marked lightcurve |
|---|---|---|---|---|---|---|---|
| A | 1778 | 1778 | 0 | 0 | 0.00% | 0.00% | 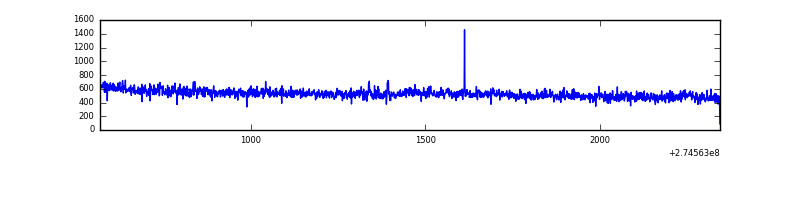 |
| B | 1778 | 1778 | 4 | 4 | 0.22% | 0.22% | 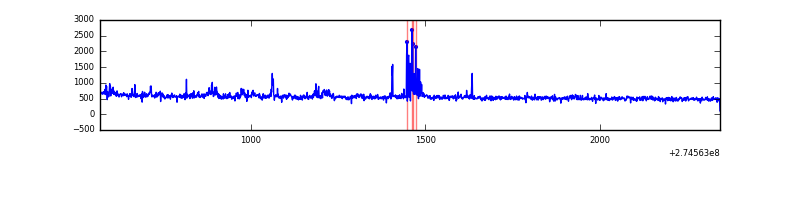 |
| C | 1778 | 1778 | 0 | 0 | 0.00% | 0.00% | 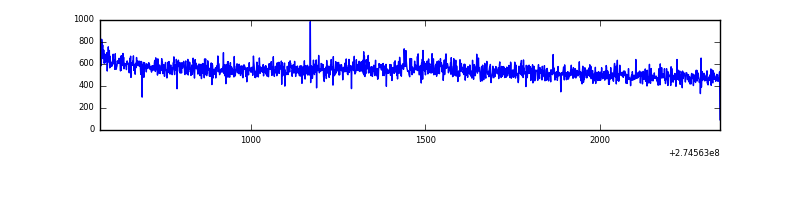 |
| D | 1778 | 1778 | 6 | 6 | 0.34% | 0.34% | 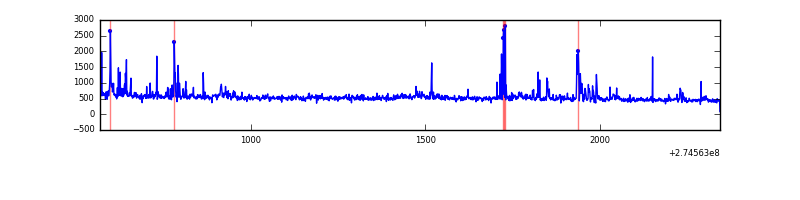 |
Top three noisy pixels from each quadrant. If the there are fewer than three noisy pixels in the level2.evt file, extra rows are filled as -1
| Pixel properties | Quadrant properties | ||||||
|---|---|---|---|---|---|---|---|
| Quadrant | DetID | PixID | Counts | Sigma | Mean | Median | Sigma |
| A | 14 | 235 | 6437 | 122.31 | 239 | 233 | 50.7 |
| A | 15 | 157 | 5478 | 103.4 | 239 | 233 | 50.7 |
| A | 0 | 226 | 2192 | 38.61 | 239 | 233 | 50.7 |
| B | 0 | 228 | 33148 | 701.49 | 240 | 235 | 46.9 |
| B | 4 | 216 | 18015 | 378.95 | 240 | 235 | 46.9 |
| B | 3 | 209 | 9756 | 202.92 | 240 | 235 | 46.9 |
| C | 14 | 238 | 36121 | 646.92 | 232 | 233 | 55.5 |
| C | 3 | 233 | 15500 | 275.21 | 232 | 233 | 55.5 |
| C | 13 | 61 | 1647 | 25.49 | 232 | 233 | 55.5 |
| D | 12 | 218 | 87423 | 1463.32 | 233 | 226 | 59.6 |
| D | 2 | 152 | 15281 | 252.65 | 233 | 226 | 59.6 |
| D | 2 | 234 | 6935 | 112.59 | 233 | 226 | 59.6 |
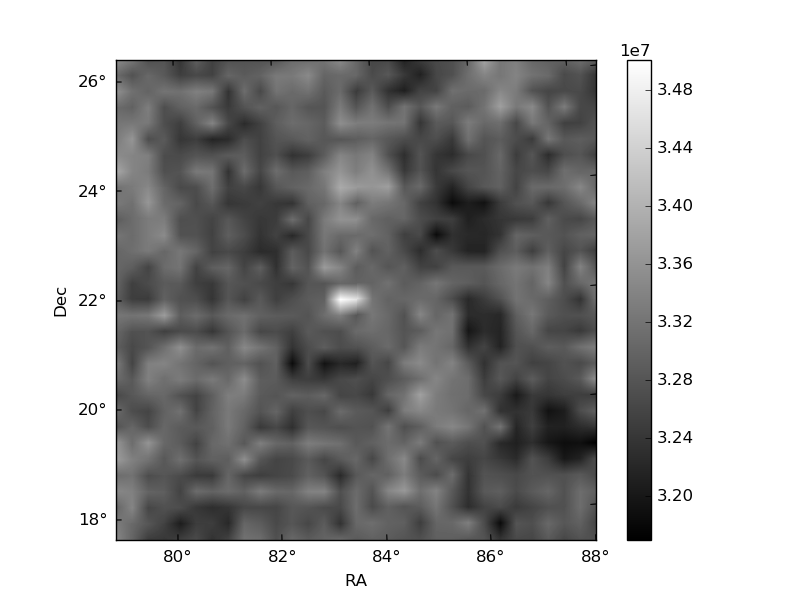
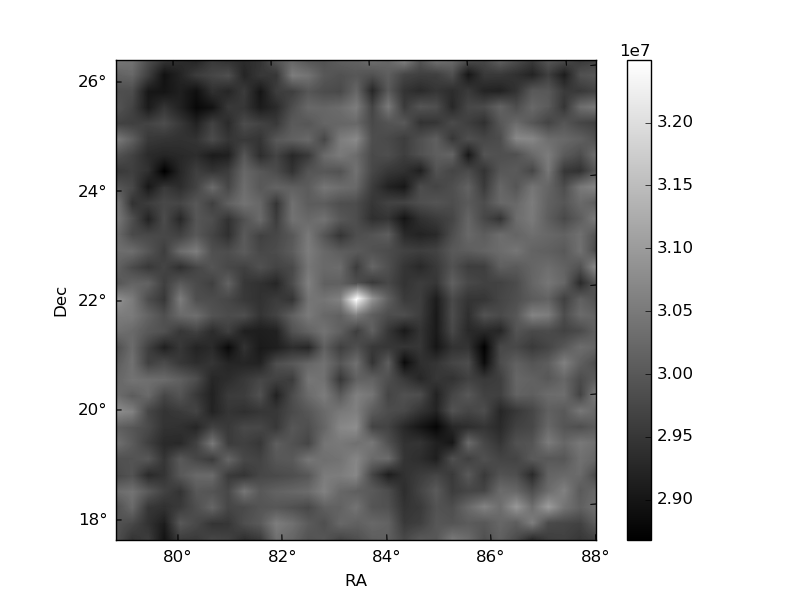
Histogram calculated using DETX and DETY for each event in the final _common_clean file
| Quadrant A | 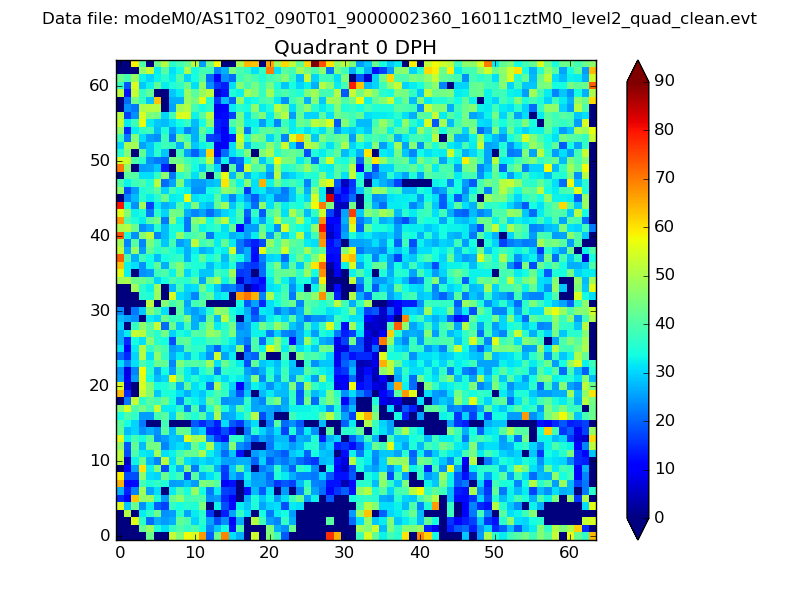 |
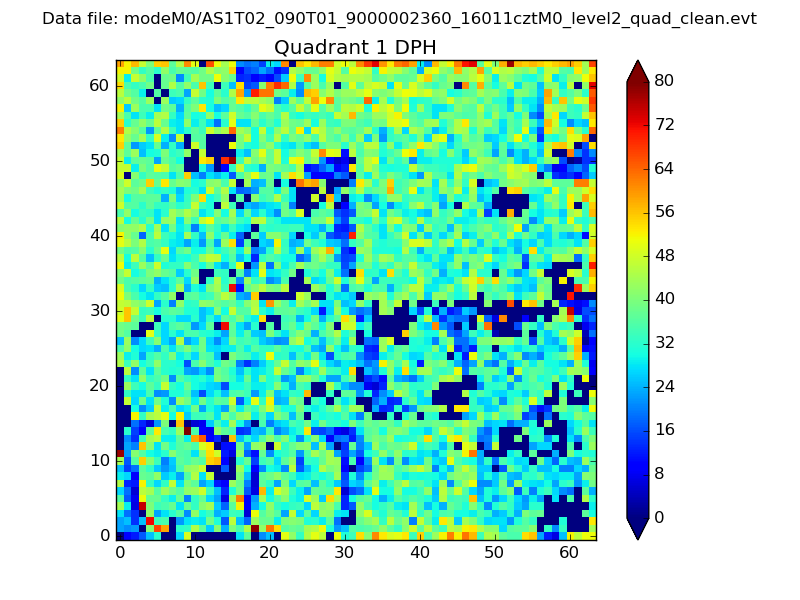 |
Quadrant B |
|---|---|---|---|
| Quadrant D | 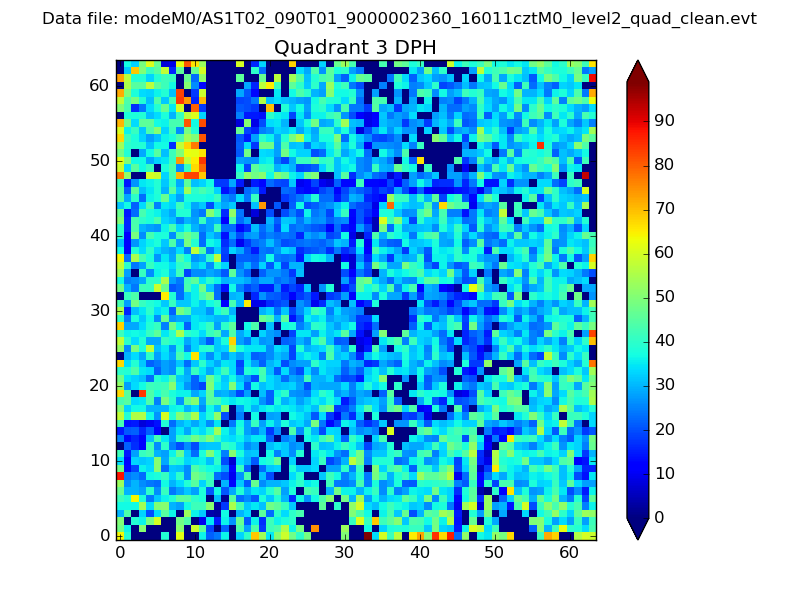 |
 |
Quadrant C |
| Plot type | Count rate plots | Images |
|---|---|---|
| Comparison with Poisson distribution Blue bars denote a histogram of data divided into 1 sec bins. Red curve is a Poisson curve with rate = median count rate of data. |
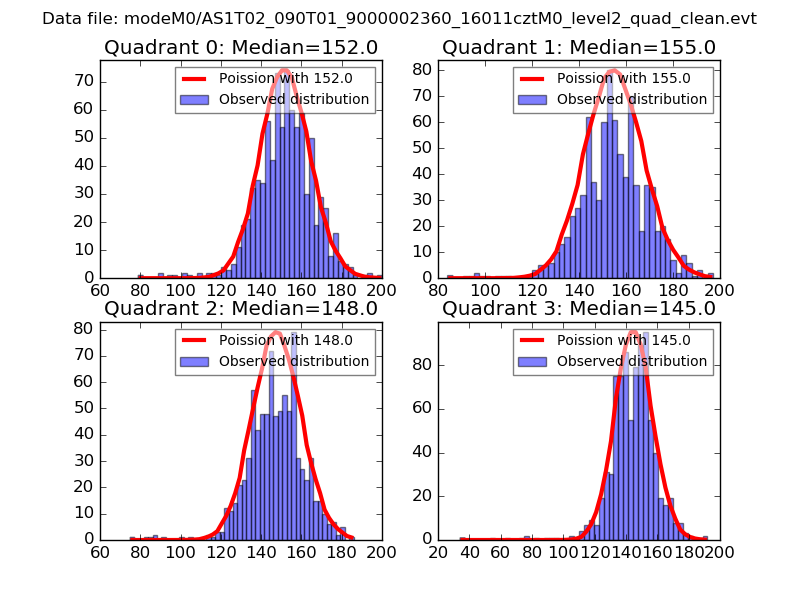 |
 |
| Quadrant-wise count rates Data is divided into 100 sec bins |
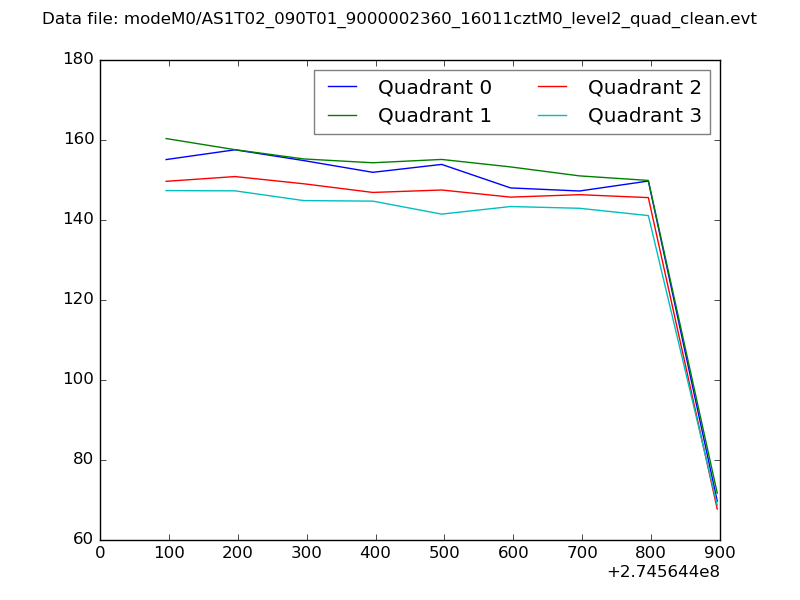 |
|
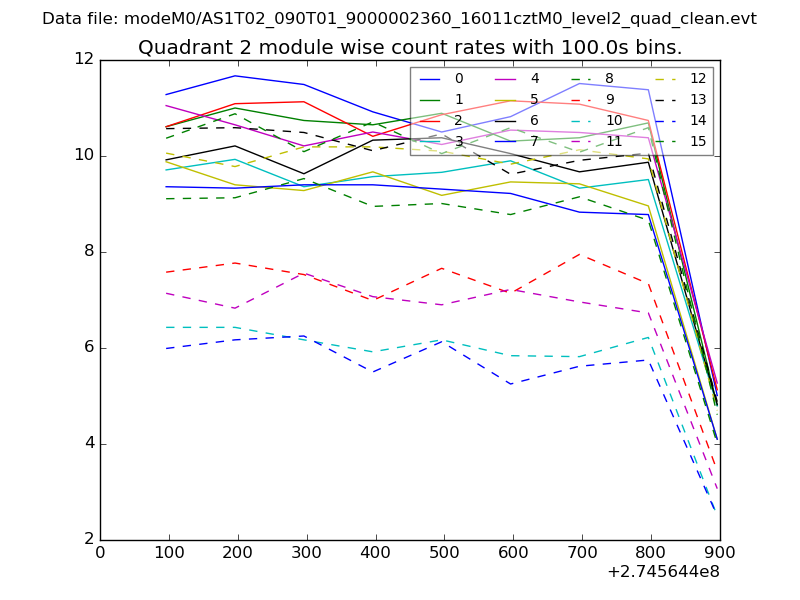
| Module-wise count rates for Quadrant A Data is divided into 100 sec bins |
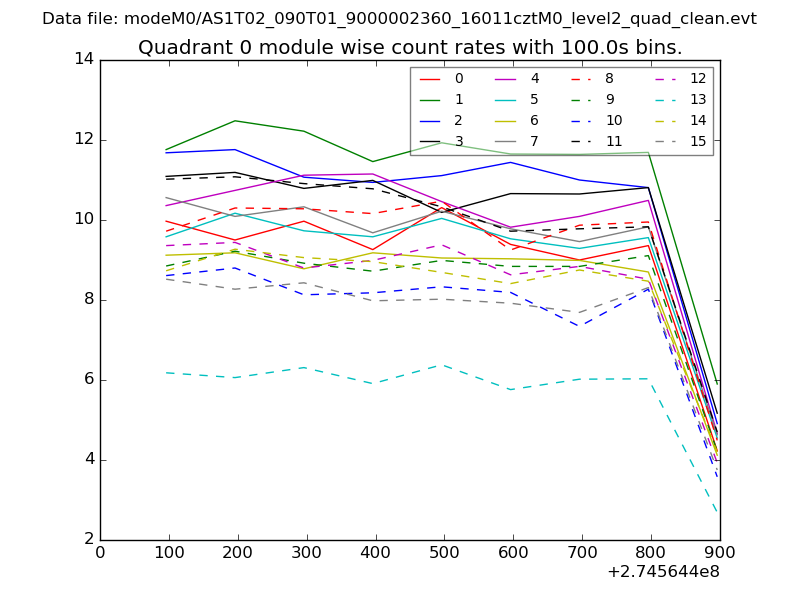 |
 |
| Module-wise count rates for Quadrant B Data is divided into 100 sec bins |
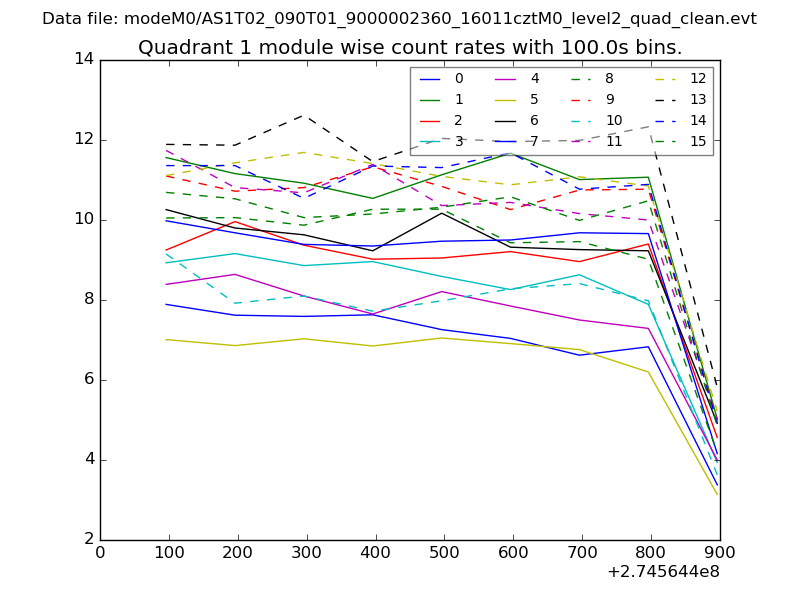 |
 |
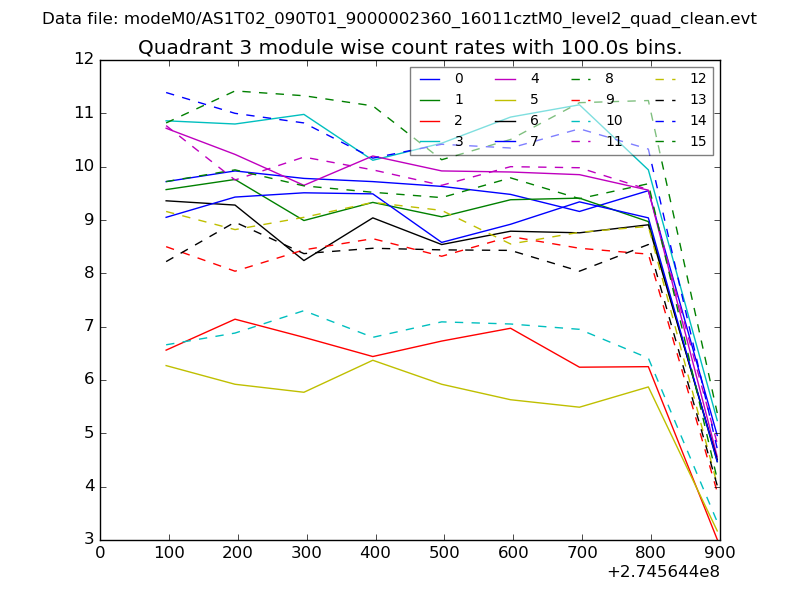
| Module-wise count rates for Quadrant C Data is divided into 100 sec bins |
 |
 |
| Module-wise count rates for Quadrant D Data is divided into 100 sec bins |
 |
 |
| Parameter | Plot |
|---|---|
| CZT HV Monitor | 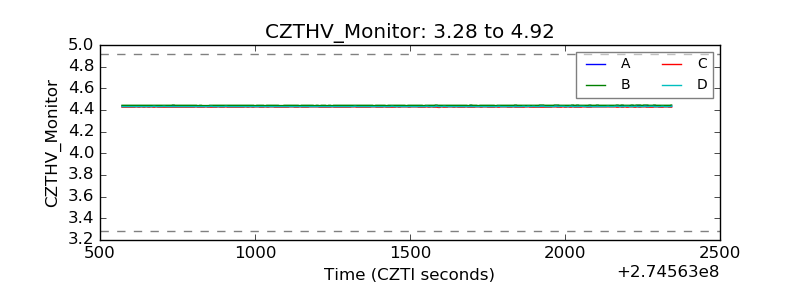 |
| D_VDD |  |
| Temperature 1 | 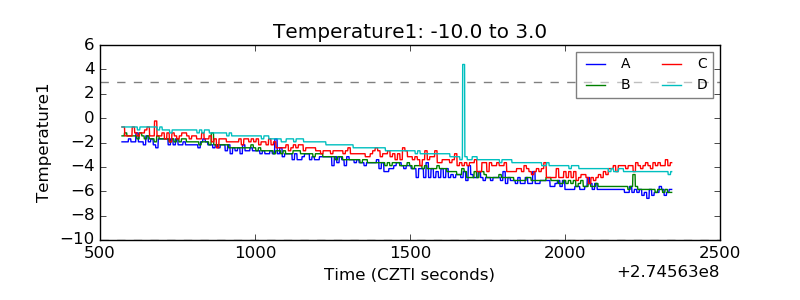 |
| Veto HV Monitor | 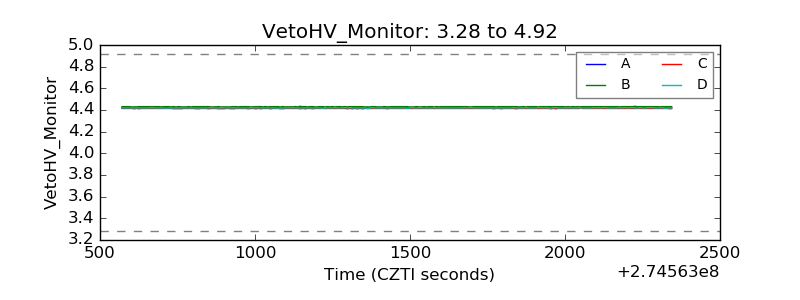 |
| Veto LLD | 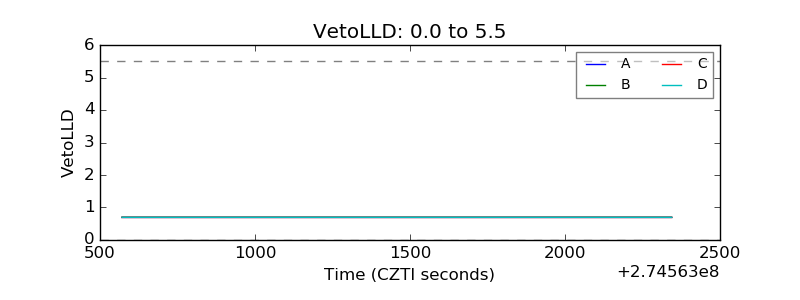 |
| Alpha Counter | 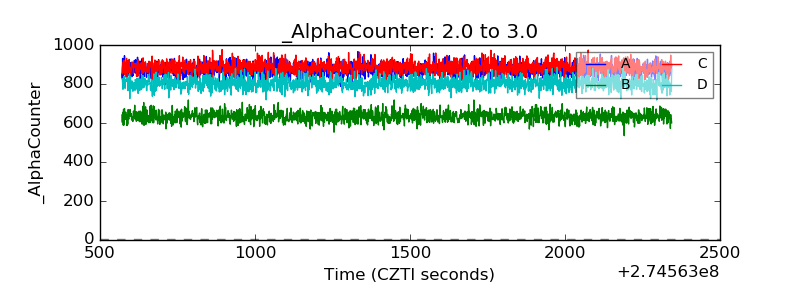 |
| _CPM_Rate | 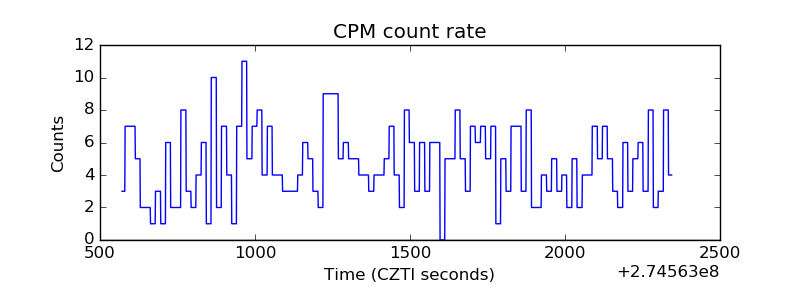 |
| CZT Counter |  |
| +2.5 Volts monitor |  |
| +5 Volts monitor |  |
| _ROLL_ROT | 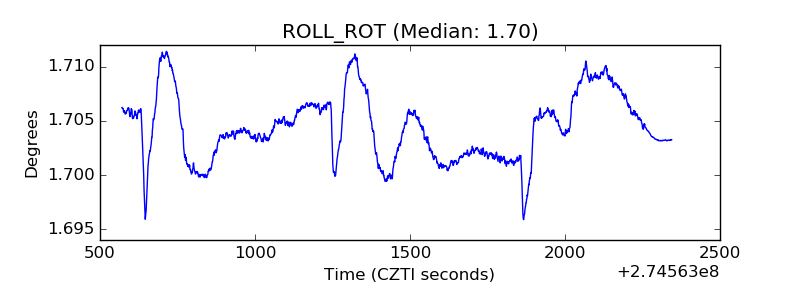 |
| _Roll_DEC | 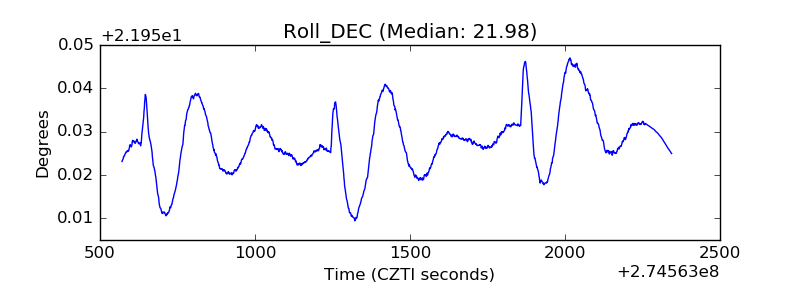 |
| _Roll_RA |  |
| Veto Counter | 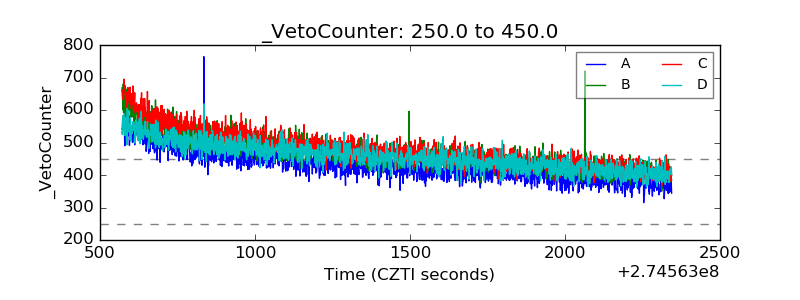 |